Readmission to Medical Intensive Care Units:
Risk Factors and Prediction
Yong Suk Jo, Yeon Joo Lee, Jong Sun Park, Ho Il Yoon, Jae Ho Lee, Choon-Taek Lee, and Young-Jae Cho
Division of Pulmonary and Critical Care Medicine, Department of Internal Medicine,
Seoul National University College of Medicine, Seoul National University Bundang Hospital, Seongnam, Korea.
Received: March 31, 2014 Revised: May 26, 2014 Accepted: May 28, 2014
Corresponding author: Dr. Young-Jae Cho, Division of Pulmonary and
Critical Care Medicine, Department of Internal Medicine,
Seoul National University College of Medicine, Seoul National University Bundang Hospital, 82 Gumi-ro 173beon-gil, Bundang-gu, Seongnam 463-707, Korea.
Tel: 82-31-787-7058, Fax: 82-31-787-4051 E-mail: [email protected]
∙ The authors have no financial conflicts of interest.
© Copyright:
Yonsei University College of Medicine 2015 This is an Open Access article distributed under the terms of the Creative Commons Attribution Non- Commercial License (http://creativecommons.org/
licenses/by-nc/3.0) which permits unrestricted non- commercial use, distribution, and reproduction in any medium, provided the original work is properly cited.
Purpose: The objectives of this study were to find factors related to medical inten- sive care unit (ICU) readmission and to develop a prediction index for determining patients who are likely to be readmitted to medical ICUs. Materials and Methods:
We performed a retrospective cohort study of 343 consecutive patients who were ad- mitted to the medical ICU of a single medical center from January 1, 2008 to De- cember 31, 2012. We analyzed a broad range of patients’ characteristics on the day of admission, extubation, and discharge from the ICU. Results: Of the 343 patients discharged from the ICU alive, 33 (9.6%) were readmitted to the ICU unexpectedly.
Using logistic regression analysis, the verified factors associated with increased risk of ICU readmission were male sex [odds ratio (OR) 3.17, 95% confidence interval (CI) 1.29‒8.48], history of diabetes mellitus (OR 3.03, 95% CI 1.29‒7.09), applica- tion of continuous renal replacement therapy during ICU stay (OR 2.78, 95% CI 0.85‒9.09), white blood cell count on the day of extubation (OR 1.13, 95% CI 1.07‒1.21), and heart rate just before ICU discharge (OR 1.03, 95% CI 1.01‒1.06).
We established a prediction index for ICU readmission using the five verified risk factors (area under the curve, 0.76, 95% CI 0.66‒0.86). Conclusion: By using spe- cific risk factors associated with increased readmission to the ICU, a numerical index could be established as an estimation tool to predict the risk of ICU readmission.
Key Words: Intensive care unit, discharge, readmission, risk, prediction score
INTRODUCTION
Readmission to the intensive care unit (ICU) is associated with unfavorable results, such as longer hospital stay, higher mortality, and increased healthcare costs.1-4 De- termining who is ready for ICU discharge usually depends on the clinical judgment of the intensivists or on the collaboration of other members of the ICU care team.5,6 Due to the highly subjective nature of ICU discharge decisions, as well as limita- tions in clinical resources or an insufficient number of beds to accept all patients who need ICU care, patients canbe discharged prematurely from the ICU, some of whom are inevitably readmitted.4,5 Therefore, early identification of patients at higher risk of ICU readmission would help clinicians to appropriately decide who is ready
admission to the ICU after ICU discharge for a problem that was directly related to the initial ICU admission and non-readmission was defined as discharge from the hospital after ICU discharge.
Data collection
Demographic, physiological, and laboratory data on the day of admission, extubation, and discharge were retrieved. We identified smoking history; types of underlying comorbidi- ties, including diabetes mellitus (DM), hypertension, coro- nary artery disease, chronic obstructive pulmonary disease, end stage renal disease, liver cirrhosis, cerebrovascular dis- ease, and cancer; cause of ICU admission; source of initial ICU admission (e.g., from the emergency department or transfer from a general ward); type of ICU admission (e.g., by arrest or planned admission); time interval between hos- pital admission and ICU admission; application of continu- ous renal replacement therapy; and extracorporeal mem- brane oxygenation or performance of a tracheostomy during ICU stay. Acute Physiology and Chronic Health Evaluation (APACHE) II scores were calculated on the day of admis- sion, extubation, and discharge. On the discharge day, we examined not only the above mentioned physiological and laboratory data but also feeding pattern, discharge time, dis- charge day of the week, discharge ward type (e.g., to gener- al ward or sub ICU), and the use of non-invasive ventila- tion (NIV). To investigate changes in volume status during the ICU stay, we reviewed differences in body weight from the ICU admission day. Since there was no comprehensive weaning and extubation protocol during the study period, it depended on the clinician’s own decision. Data were col- lected by the same investigator for the entire study period.
Statistical analysis and ethics
Statistical tests were performed with SPSS version 19 (SPSS Inc., Chicago, IL, USA). Two sided tests with significance set at 0.05 were used. Differences in baseline characteristics between the readmission and non-readmission groups were assessed with Pearson chi-square for categorical data and independent t-test for continuous data. Univariate and step- wise multivariate logistic regression analysis were used to investigate the association between specific risk factors and ICU readmission. We conducted the likelihood ratio test (LR-test) to find factors that are more precisely associated with ICU readmission among the variables after convention- al univariate analysis and then included the variables that had a p-value less than 0.2 in the LR-test in the multivariate anal- to be discharged from the ICU and prevent avoidable mor-
bidity and mortality after ICU discharge.7
Knowing the risk factors associated with readmission to the ICU might help to identify high-risk patients who can benefit from prolonged ICU treatment before discharge to the general ward.8 Several studies have identified risk factors for ICU readmission,3,4,9 which have been used in developing tools to predict the risk of ICU readmission and to help clini- cians improve their discharge decisions.10-16 Unfortunately, there is no validated scoring system for predicting readmis- sion or death after ICU discharge in Korea, until now.
The objectives of this study were as follows: 1) compare the characteristics and outcomes of patients with or without ICU readmission, 2) identify risk factors that influence the risk of ICU readmission, and 3) develop a scoring system for predicting high-risk patients who tend to be readmitted to the ICU. To our knowledge, this prediction model is unique and the first in Korea to be of use in the ICU, and we hope that the numerical index outlined in this study will help inten- sivists in determining which ICU patients are ready to be safely discharged.
MATERIALS AND METHODS
Study design and participants
This was a retrospective, single-center cohort study using the medical records of ICU patients who were hospitalized between January 1, 2008 and December 31, 2012. All pa- tients discharged from the medical ICU (10 beds out of 909 hospital beds) were included in the analysis unless any of the exclusion criteria were met. Patients with the following conditions were excluded from the analysis: age <18 years;
died in the ICU; transferred to another ICU in the same hos- pital; admitted to the ICU after an elective surgery or proce- dure; and the declaration of “do not resuscitate (DNR)” at ICU discharge. We also excluded patients who were not in- tubated or extubated within 48 hours after intubation, as is common upon admission for close monitoring of hemody- namic instability, application of continuous renal replace- ment therapy (CRRT), and respiratory failure of acute pul- monary edema due to acute myocardial infarct. We also excluded unexpected deaths in the general ward, as the ma- jority of those patients did not want to be readmitted to the ICU and requested documentation for a DNR order. We di- vided all included patients into either the readmission group or the non-readmission group: readmission was defined as
tween ICU discharge and readmission was 7.24±7.34 days.
Baseline characteristics
Table 1 presents the characteristics of both groups at admis- sion. There were no differences in the baseline characteristics between the discharge and readmission groups, including age, sex, body mass index, smoking history, hospital stay be- fore ICU admission, cardiopulmonary resuscitation admis- sion, and APACHE II score. Only the route of ICU admis- sion showed a significant difference between the two groups.
The discharge group had more patients who were admitted to the hospital from the emergency room than from the gen- eral ward (66.10% vs. 45.50%).
All comorbidities and vital signs, including blood pres- sure, heart rate, respiratory rate, body temperature, and the level of consciousness using Glasgow coma scale, showed no significant difference between the two groups.
ysis. Then, a nomogram was created based on the multivari- able logistic regression analysis and by using the package of rms in R version 3.0.1. The width of lines on the nomo- gram was proportional to the coefficient from the logistic regression to display the results of the regression models vi- sually. These statistical methods also were used to assign incremental numerical weights to the gradations of the vari- ables that make up the risk assessment scoring system re- garding ICU readmission after discharge. The actual scores use variables in order to estimate the probability of an un- planned ICU readmission. An area under the receiver opera- tor curve (AUC) was drawn to estimate the prediction of the model at the time of ICU discharge. We developed a nomo- gram calibration plot using regression coefficients and 1000 boot strap repetitions to implement internal validation of our scoring system.
This study was conducted in compliance with the Declara- tion of Helsinki and was exempted from obtaining informed consent by the Institutional Review Board Committee of our hospital due to retrospective medical record review (IRB No.
B-1303/194-107).
RESULTS
Of the 1205 patients who were admitted to the medical ICU over 5 years from January 2008 to December 2012 at a ter- tiary, teaching hospital, and excluding patients who meet any of the exclusion criteria, 343 patients were discharged from the medical ICU alive; 33 (9.6%) were readmitted to
the ICU unexpectedly (Fig. 1). The mean time interval be- Fig. 1. Flow diagram of patients through the study. ICU, intensive care unit.
Discharge (n=310) ICU readmission (n=33) Death in general ward (n=61) No intubation (n=195)
Extubation within 48 hours (n=125) Elective surgery or procedure (n=61) Death (n=374)
Others (n=46) Transfer to general ward (n=404)
ICU admission (n=1205)
Table 1. Admission Characteristics of the Discharge Group and ICU Readmission Group
No readmission (n=310) Readmission (n=33) p value
Age, yr, mean (SD) 69.05 (13.94) 68.79 (12.88) 0.92
Sex, male (n, %) 196 (63.20) 25 (75.80) 0.18
BMI, mean (SD) 21.09 (4.42) 21.12 (3.50) 0.97
Smoking (n, %) 0.84
Current 27 (8.70) 3 (9.10)
Ex-smoker 102 (32.90) 9 (27.30)
Nonsmoker 178 (57.40) 21 (63.60)
Smoking, pack-yr (SD) 18.0 (25.70) 24.0 (5.80) 0.22
Hospital stay before ICU admission
(days, SD) 4.88 (12.79) 4.93 (9.72) 0.98
Route of ICU admission, ER (n, %) 205 (66.10) 15 (45.50) 0.02
CPR admission (n, %) 28 (9.00) 2 (6.10) 0.75
APACHE II score, mean (SD) 32.02 (6.77) 30.36 (6.55) 0.18
APACHE, Acute Physiological and Chronic Health Evaluation; BMI, body mass index; CPR, cardiopulmonary resuscitation; ER, emergency room; ICU, inten- sive care unit.
sion to extubation and from admission to discharge were not influential on subsequent readmission, nor was APS at dis- charge. Also, the time interval between ICU admission and extubation and between extubation and discharge showed no significant differences.
Characteristics of readmitted patients and prediction model
Among the 33 patients who were readmitted to the ICU during their hospital stay, the most common cause of ICU readmission was respiratory failure (87.9%). The mean APACHE II score of the readmitted patients was 21±7.42, and the mean time interval between discharge from ICU and readmission was 7.24±7.34 days.
After univariate and step-wise multivariate logistic regres- sion analysis to find the factors associated with increased risk of ICU readmission (Supplementary Table 1, only online), identified risk factors were male sex [odds ratio (OR) 3.17, 95% confidence interval (CI) 1.29‒8.48], history of DM (OR 3.03, 95% CI 1.29‒7.09), application of CRRT during ICU stay (OR 2.78, 95% CI 0.85‒9.09), white blood cell (WBC) count on the day of extubation (OR 1.13, 95% CI 1.07‒1.21), and heart rate just before ICU discharge (OR 1.03, 95% CI The distribution of reasons for ICU admission was similar
in both groups. The most common cause was respiratory fail- ure (73.9% vs. 75.8%), followed by sepsis (13.5% vs. 9.4%), and cardiopulmonary arrest (7.4% vs. 6.1%) consecutively.
ICU interventions and characteristics on discharge During ICU care, continuous renal replacement therapy was performed more in the readmission group (9.40% vs. 18.20%, p=0.13), while a tracheostomy was undertaken more in the discharge group (26.10% vs. 15.20%, p=0.20), although there was no statistical significance.
Table 2 shows the characteristics of both groups on the dis- charge day. On the day of ICU discharge, there were no sig- nificant differences between the two groups in vital sign, APACHE II score, application of NIV, feeding pattern, time of discharge, and discharge to a step-down unit. Only the lev- el of consciousness according to Glasgow Coma Scale was higher in the readmission group (12.56 vs. 13.45, p=0.02).
The length of ICU stay was not different between the groups (12.26 days vs. 10.12 days, p=0.24). However, the total length of hospital stay was significantly longer in the readmission group (41.89 days vs. 57.30 days, p=0.05).
The changes in acute physiologic score (APS) from admis-
Table 2. Vital Signs, Severity of Illness, and Other Conditions at the Time of Intensive Care Unit Discharge
No readmission (n=310) Readmission (n=33) p value
MBP, mm Hg (mean, SD) 87.64 (13.63) 87.93 (12.25) 0.91
HR, /min (mean, SD) 93.49 (15.37) 97.91 (17.21) 0.12
RR, /min (mean, SD) 23.06 (5.49) 23.76 (4.29) 0.48
BT, °C (mean, SD) 36.72 (0.47) 36.72 (0.51) 0.94
GCS (mean, SD) 12.56 (3.03) 13.45 (1.89) 0.02
PaO2/FiO2 ratio (mean, SD) 331.71 (143.14) 305.74 (103.71) 0.31
APACHE II score (mean, SD) 12.92 (4.69) 12.18 (3.84) 0.39
Application of NIV (No, SD) 31 (10.30) 1 (3.00) 0.23
Body weight change from ICU admission day
(mean, SD) -2.01 (3.78) -2.11 (3.86) 0.89
Meal pattern (No, %) 1.00
Oral feeding 72 (23.20) 8 (24.20)
Levin tube feeding 193 (62.30) 21 (63.60)
PEG feeding 5 (1.60) 0 (0)
NPO 40 (12.90) 4 (12.10)
ICU discharge time (No, %) 0.25
Morning 137 (44.20) 19 (57.60)
Afternoon 163 (52.60) 13 (39.40)
Evening to night 10 (3.20) 1 (3.00)
ICU discharge at weekend (No, %) 52 (16.80) 7 (21.20) 0.48
Discharge to step-down unit (No, %) 52 (16.80) 6 (18.20) 0.81
Length of ICU stay (day, SD) 12.26 (10.19) 10.12 (7.70) 0.24
APACHE, Acute Physiological and Chronic Health Evaluation; BT, body temperature; GCS, Glasgow Coma Scale; HR, heart rate; ICU, intensive care unit;
MBP, mean blood pressure; NIV, non-invasive ventilation; NPO, nothing by mouth; PEG, percutaneous endoscopic gastrostomy; RR, respiratory rate.
on type of ICU, and the prognosis of readmitted patients is not good.3,4 We analyzed only medical ICU due to clinical differences between surgical and medical ICU. In our data, 9.6% of the patients who were discharged from the ICU to the general ward were inevitably readmitted, and 16.4% died in the general ward. Whatever the reason for their clinical derangement after ICU discharge and readmission, it is clear that readmitted patients to the ICU are at much higher risk of a longer hospital stay and death than those who are not readmitted.3,4 In our study, the total length of hospital stay was significantly longer in the readmission group. Mean- while, we could not directly compare deaths between the discharge and readmission groups, as we only included pa- tients who were alive at discharge to their home or a sana- torium as the discharge group.
Not all readmissions and deaths can be prevented, al- 1.01‒1.06).
The risk score calculation worksheet is shown in Fig. 2.
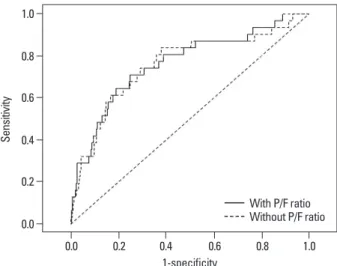
Since the most common cause of ICU readmission was respi- ratory failure, despite its statistical non-significance, we add- ed PaO2/FiO2 ratio to reflect respiratory status at ICU dis- charge. However, there was no statistically significant difference in discriminating high risk patients with or without PaO2/FiO2 ratio. Fig. 3 shows the ACU for the risk score model in assessment of high risk patients to ICU readmission with or without the PaO2/FiO2 ratio (AUC 0.76; 95% CI 0.67‒0.80 vs. AUC 0.76; 95% CI 0.66‒0.86). The predictive accuracy of the risk score calculation worksheet was quanti- fied with the area under the AUC (Supplementary Fig. 1, only online). Internal validation of the scoring model was performed by using one thousand bootstrap resamples and showed considerable predictive ability for our prediction model.
DISCUSSION
Of the 343 patients discharged from ICU alive and trans- ferred to the general ward, 33 (9.6%) were readmitted to the ICU. To discover who is likely to be readmitted to the ICU, we compared medical records from admission to discharge of hospital. Verified factors related to increased readmission to ICU included male sex, history of DM, application of CRRT, higher WBC count on the day of extubation, and a rapid heart rate just before ICU discharge. A risk prediction model regarding ICU readmission was made using these five identified risk factors and showed good predictive accuracy.
Readmission rates, ranging from 4 to 10 percent, depend
Fig. 2. Nomogram predicting the probability of ICU readmission. Instruction: locate the patient’s sex on the axis. Draw a line straight up- ward to the point axis to determine how many points toward the probability of ICU readmission the patients receive for his or her sex.
After repeating the process for each additional variable, sum the points for each of the predictors. Locate the final sum on the total point axis, and then, draw a line straight down to find the patient’s probability of ICU readmission. DM, diabetes mellitus; CRRT, continuous re- nal replacement therapy; WBC, white blood cell; HR, heart rate; ICU, intensive care unit.
Fig. 3. Area under the receiver operator curve (AUC) for risk score model in discriminating ICU readmission (AUC 0.76; 95% CI 0.67–0.80 vs. AUC 0.76;
95% CI 0.66–0.86). P/F ratio, PaO2/FiO2 ratio; CI, confidence interval.
Points
WBC_extubation DM
Total points Sex
HR_dischange CRRT
Linear predictor Risk of readmission
0
0 50
0 F N N
40
15 110 120
60 -3.5 20
10
80 90
40 -5
0.01 M
Y Y
60
25
100 -2 0.1
90
35
140 0 0.5 10
5
60 70
20 -5.5
50
20 130 140
80 -2.5 -3 0.05
80
30
-0.5 0.4 0.3 30
100 -4 -4.5
70
120 -1.5 -1
0.2
100
40 160
1-specificity
Sensitivity
0.0 0.2 0.4 0.6 0.8 1.0
0.0 0.2 0.6 0.4 0.8 1.0
With P/F ratio Without P/F ratio
tors of ICU readmission in our study did not contain any re- spiratory parameters nor acute physiology score.
There are three major strengths on our study. First, we found that ICU readmission is strongly associated with some demographical factors and comorbidities and conse- quently related to a poor prognosis. Readmission was sig- nificantly associated with a longer hospital stay and subse- quently increased medical cost, as well as several hospital acquired complications. These findings support prior stud- ies on the importance of patient characteristics as determi- nants of ICU readmission.1,3,19 A second strength is that the risk of ICU readmission was shown to be associated with physiologic abnormalities during ICU stay (application of CRRT), as well as on the day of discharge (tachycardia), and with laboratory abnormalities on the day of extubation (elevated WBC). These suggest that in addition to patient characteristics at admission, readmission to the ICU is asso- ciated with the development of complications during ICU care. Lastly, we created a new prediction model for the risk of readmission to the ICU, which showed moderate dis- criminating ability in identifying who was ready to be read- mitted to the ICU.
Notwithstanding, we realize that our study has several limitations. First, our study was conducted at a single cen- ter, and therefore, the results might not be representative of all ICUs in Korea. In addition, as we only included patients admitted to the medical ICU, it is not anticipated that the prediction score drawn by this study can be applied to other types of ICUs. Second, despite the ratio between the dis- charged and readmitted patients being correlated with previ- ous studies, the absolute number of readmitted patients was only 33 patients. Actually, we excluded patients who were not intubated or extubated within 48 hours after intubation, since most of these patients are admitted to the ICU for close monitoring of hemodynamic instability due to gastro- intestinal bleeding or for application of CRRT or respirato- ry failure due to relatively easily reversible condition, such as pulmonary edema due to acute myocardial infarct. Also, we only included patients with an ICU stay of longer than 48 hours, asmost patients discharged ICU within 48 hours had already died due to too serious conditions or were admit- ted for close monitoring after surgery. Therefore, it would be inappropriate to say that the predictive model extracted from our study can precisely predict the actual risk of readmis- sion. Third, although we examined a large number of vari- ables from admission to discharge, a great number of vari- ables did not show statistically significant differences, and though identification of high-risk patients for ICU readmis-
sion before they leave the ICU could help clinicians with deciding when to discharge. However, for patients as higher risk of ICU readmission or death, an appropriate ICU dis- charge plan can be made to incorporate delayed discharge until stabilization, discharge to a step-down unit, and more aggressive follow up in the wards.
To find factors related to an increased probability of ICU readmission, we reviewed a variety of characteristics for dis- charge and readmitted patients. We conducted the LR-test to find factors that are more strongly associated with ICU read- mission after conventional univariate logistic regression anal- ysis, and then, we only included the variables with a p-value of less than 0.2 in the LR-test in the multivariate analysis. Fi- nally, five risk factors were identified: male sex, DM history, application of CRRT, high WBC count on the day of extuba- tion, and rapid heart rate just before ICU discharge. For the next step, we assigned incremental numerical weights to the gradations of the variables that make up the risk assessment scoring system regarding ICU readmission (Fig. 2). The AUC was used to estimate the prediction of the model at the time of ICU discharge (Fig. 3) and showed favorable pre- dictive accuracy (AUC 0.76; 95% CI 0.66‒0.86). To evalu- ate the predictive ability of the developed risk assessment scoring system, we made a nomogram calibration plot using regression coefficients and 1000 boot strap repetitions to im- plement internal validation (Supplementary Fig. 1, only online), and it showed good favorable predictive ability.
There are several published literatures on tools for pre- dicting adverse outcomes following patients who have been discharged from the ICU.10-18 Most previous studies includ- ed medical and surgical ICU and evaluated combined out- comes of ICU readmission and hospital mortality. Reini, et al.13 created and evaluated the ability of Modified Early Warning Score to predict ICU readmission within 72 hours of ICU discharge. Gajic, et al.10 developed the Stability and Workload Index for Transfer score to predict ICU readmis- sion following ICU discharge within 7 days. The calculated area under the receiver operating characteristic curves ranged from 0.66 to 0.92.10-18 The characteristics that increased the probability of ICU readmission in our study are somewhat different than those in previous reports.10-18 Some reported that respiratory parameters, such as PaO2/FiO2 ratio,10 last PaCO2,10 and respiratory rate13 are predictors of ICU read- mission. Also, some referred to acute physiology points, such as APACHE II score,18 as predictive factors of adverse outomes after ICU discharge. However, identified risk fac-
REFERENCES
1. Metnitz PG, Fieux F, Jordan B, Lang T, Moreno R, Le Gall JR.
Critically ill patients readmitted to intensive care units--lessons to learn? Intensive Care Med 2003;29:241-8.
2. Renton J, Pilcher DV, Santamaria JD, Stow P, Bailey M, Hart G, et al. Factors associated with increased risk of readmission to in- tensive care in Australia. Intensive Care Med 2011;37:1800-8.
3. Rosenberg AL, Hofer TP, Hayward RA, Strachan C, Watts CM.
Who bounces back? Physiologic and other predictors of intensive care unit readmission. Crit Care Med 2001;29:511-8.
4. Rosenberg AL, Watts C. Patients readmitted to ICUs*: a systemat- ic review of risk factors and outcomes. Chest 2000;118:492-502.
5. Capuzzo M, Moreno RP, Alvisi R. Admission and discharge of critically ill patients. Curr Opin Crit Care 2010;16:499-504.
6. Heidegger CP, Treggiari MM, Romand JA; Swiss ICU Network.
A nationwide survey of intensive care unit discharge practices. In- tensive Care Med 2005;31:1676-82.
7. Skowronski GA. Bed rationing and allocation in the intensive care unit. Curr Opin Crit Care 2001;7:480-4.
8. Kramer AA, Higgins TL, Zimmerman JE. Intensive care unit re- admissions in U.S. hospitals: patient characteristics, risk factors, and outcomes. Crit Care Med 2012;40:3-10.
9. Chrusch CA, Olafson KP, McMillan PM, Roberts DE, Gray PR.
High occupancy increases the risk of early death or readmission after transfer from intensive care. Crit Care Med 2009;37:2753-8.
10. Gajic O, Malinchoc M, Comfere TB, Harris MR, Achouiti A, Yilmaz M, et al. The Stability and Workload Index for Transfer score predicts unplanned intensive care unit patient readmission:
initial development and validation. Crit Care Med 2008;36:676-82.
11. Campbell AJ, Cook JA, Adey G, Cuthbertson BH. Predicting death and readmission after intensive care discharge. Br J Anaesth 2008;100:656-62.
12. Fernandez R, Serrano JM, Umaran I, Abizanda R, Carrillo A, Lo- pez-Pueyo MJ, et al. Ward mortality after ICU discharge: a multi- center validation of the Sabadell score. Intensive Care Med 2010;
36:1196-201.
13. Reini K, Fredrikson M, Oscarsson A. The prognostic value of the Modified Early Warning Score in critically ill patients: a prospec- tive, observational study. Eur J Anaesthesiol 2012;29:152-7.
14. Badawi O, Breslow MJ. Readmissions and death after ICU dis- charge: development and validation of two predictive models.
PLoS One 2012;7:e48758.
15. Fernandez R, Baigorri F, Navarro G, Artigas A. A modified Mc- Cabe score for stratification of patients after intensive care unit discharge: the Sabadell score. Crit Care 2006;10:R179.
16. Ouanes I, Schwebel C, Français A, Bruel C, Philippart F, Vesin A, et al. A model to predict short-term death or readmission after in- tensive care unit discharge. J Crit Care 2012;27:422.
17. Hosein FS, Bobrovitz N, Berthelot S, Zygun D, Ghali WA, Stelfox HT. A systematic review of tools for predicting severe adverse events following patient discharge from intensive care units. Crit Care 2013;17:R102.
18. Frost SA, Alexandrou E, Bogdanovski T, Salamonson Y, David- son PM, Parr MJ, et al. Severity of illness and risk of readmission to intensive care: a meta-analysis. Resuscitation 2009;80:505-10.
19. Kaben A, Corrêa F, Reinhart K, Settmacher U, Gummert J, Kalff R, et al. Readmission to a surgical intensive care unit: incidence, outcome and risk factors. Crit Care 2008;12:R123.
just five risk factors verified. This may be because of our study design. We did not include patients who did not want to be readmitted to the ICU after being discharged to anoth- er ward. Due to refusal, they did not get ICU care and died in the ward; nevertheless, considering them as part of the re- admission group is also reasonable. Similarly, selection bias may also be present due to excluding severely ill patients. In the initial stages, we expected that time (night vs. day) or day of the week (weekday vs. weekend) could influence the clinical course of ICU discharged patients. However, we did not find any significant differences in the two groups. In ad- dition, discharge to a step-down unit for close monitoring did not show any benefits for ICU readmission. These re- sults could be due to the lack of objective indication for ad- mission to step-down units, and depends largely on clini- cians’ decisions.
The most common cause of both initial ICU admission and readmission is respiratory failure, although our data showed no statistically significant differences in respiratory parame- ters between the discharge group and readmission group. A unique finding is that the severity of illness represented by the APACHE II score at ICU admission and discharge and changes there in between admission and discharge did not have an influence on readmission to ICU. These findings are similar to the results of a recent meta-analysis, which showed that the timing of the severity measurement had little impact on the readmission risk.18 This suggests that while patients may improve their physiologic status during their stay in the ICU, physiologic abnormalities might necessitatea longer stay in the ICU before discharge.
In conclusion, we found five risk factors to be related to an increased risk of ICU readmission: male sex, DM history, ap- plication of CRRT, high WBC count on the day of extuba- tion, and a rapid heart rate just before ICU discharge. There- from, a prediction model for assessment of risk of ICU readmission was developed. Although the prediction model derived from our study showed considerable predictive value upon internal validation, external validation is also needed.
Application of the model may help clinicians to prevent read- missions to the ICU and thereby improve patient outcomes.
ACKNOWLEDGEMENTS
We thank Prof. Soyeon Ahn at the Medical Research Col- laborating Center, Seoul National University Bundang Hos- pital for the considerable statistical review.
Unadjusted OR (95% CI) p value Adjusted OR (95% CI) p value Baseline characteristics
Sex (male) 1.82 (0.79‒4.16) 0.16 3.17 (1.29‒8.48) 0.01
Age
≥65, <80 0.62 (0.27‒1.42) 0.26
≥80 0.86 (0.33‒2.23) 0.76
BMI
≥20, <25 1.43 (0.64‒3.18) 0.38
≥25 1.18 (0.42‒3.31) 0.75
Smoking
Current smoker 0.94 (0.26‒3.37) 0.93
Ex-smoker 0.75 (0.33‒1.70) 0.49
Smoking (pack-yr) 1.01 (1.00‒1.02) 0.22
Underlying disease
Diabetes mellitus 2.04 (0.99‒4.20) 0.05 3.03 (1.29‒7.09) 0.01
Hypertension 1.36 (0.66‒2.79) 0.40
Coronary artery disease 1.44 (0.52‒3.99) 0.48
COPD 1.80 (0.70‒4.68) 0.23
ESRD 1.47 (0.32‒6.83) 0.62
Liver cirrhosis 1.27 (0.28‒5.81) 0.76
Cerebrovascular disease 1.12 (0.47‒2.71) 0.80
Cancer 1.04 (0.45‒2.40) 0.93
Characteristics at ICU admission
Route of ICU admission: ER 0.43 (0.21‒0.88) 0.02
Hospital stay before ICU admission, ≥7 days 1.28 (0.53‒3.09) 0.59
Unexpected ICU admission: CPR 0.65 (0.15‒2.86) 0.57
APACHE II score at admission 0.97 (0.92‒1.02) 0.18
Vital sign at ICU admission
MBP 1.01 (0.99‒1.04) 0.37
HR 1.00 (1.00‒1.01) 0.14
RR, ≥30/min 0.58 (0.25‒1.33) 0.20
BT 0.85 (0.58‒1.24) 0.40
Laboratory data at admission
WBC 1.00 (0.98‒1.03) 0.82
Hb 1.04 (0.87‒1.25) 0.65
Platelet 1.00 (1.00‒1.00) 0.54
BUN 1.02 (1.00‒1.04) 0.12
Creatinine 1.07 (0.89‒1.29) 0.50
Na 0.97 (0.92‒1.03) 0.31
K 1.13 (0.75‒1.69) 0.57
Total cholesterol 1.00 (0.99‒1.01) 0.62
Total bilirubin 1.00 (0.77‒1.31) 0.98
Total protein 0.99 (0.61‒1.60) 0.96
Albumin 1.08 (0.52‒2.28) 0.83
CRP 0.97 (0.93‒1.01) 0.12
Glucose 1.00 (1.00‒1.01) 0.14
pH 1.70 (0.15‒19.20) 0.67
pO2 1.00 (0.99‒1.01) 0.82
pCO2 1.01 (0.99‒1.03) 0.51
HCO3 1.03 (0.98‒1.09) 0.19
Unadjusted OR (95% CI) p value Adjusted OR (95% CI) p value
PaO2/FiO2 ratio 0.91 (1.00‒1.00) 0.91
ICU intervention
CRRT 2.15 (0.75‒5.35) 0.12 2.78 (0.85‒9.09) 0.01
ECMO 0 (0‒N) 1.00
Tracheostomy 0.51 (0.19‒1.35) 0.17
Vital sign at extubation
MBP 1.00 (0.99‒1.02) 0.88
HR 1.01 (0.99‒1.03) 0.47
RR, ≥30/min 1.00 (0.95‒1.05) 0.90
BT 0.93 (0.65‒1.33) 0.68
GCS 1.28 (0.93‒1.76) 0.13
APACHE II score at extubation 1.02 (0.98‒1.06) 0.28
Laboratory data at extubation day
WBC 1.09 (1.03‒1.15) 0.00 1.13 (1.07‒1.21) <0.001
Hb 1.04 (0.82‒1.33) 0.74
Platelet 1.00 (1.00‒1.00) 0.83
BUN 1.01 (0.99‒1.03) 0.19
Creatinine 1.11 (0.88‒1.39) 0.38
Na 0.97 (0.91‒1.04) 0.36
K 1.00 (0.52‒1.95) 1.00
Total cholesterol 1.00 (0.99‒1.01) 0.64
Total bilirubin 1.12 (0.95‒1.31) 0.18
Total protein 0.84 (0.52‒1.37) 0.49
Albumin 0.56 (0.25‒1.24) 0.15
CRP 1.02 (0.96‒1.09) 0.48
Glucose 1.00 (1.00‒1.00) 0.94
pH 0.09 (0‒467.81) 0.58
pO2 1.00 (0.99‒1.01) 0.62
pCO2 1.01 (0.97‒1.05) 0.72
HCO3 1.00 (0.93‒1.08) 0.98
PaO2/FiO2 ratio 1.00 (1.00‒1.00) 0.73
Vital signs at discharge
MBP 1.00 (0.98‒1.03) 0.91
HR 1.02 (1.00‒1.04) 0.12 1.03 (1.01‒1.06) 0.02
RR, ≥30/min 0.45 (0.06‒3.48) 0.45
BT 1.03 (0.49‒2.19) 0.94
GCS 1.14 (0.98‒1.33) 0.10
Laboratory data at discharge
WBC 1.09 (1.02‒1.16) 0.01
Hb 0.99 (0.78‒1.26) 0.95
Platelet 1.00 (1.00‒1.00) 0.61
BUN 1.02 (1.00‒1.04) 0.02
Creatinine 1.18 (0.91‒1.52) 0.21
Na 0.99 (0.93‒1.07) 0.87
K 1.16 (0.61‒2.21) 0.66
Total cholesterol 1.00 (0.99‒1.01) 0.40
Total bilirubin 1.11 (0.97‒1.28) 0.14
Total protein 0.77 (0.47‒1.27) 0.31
Albumin 1.02 (0.44‒2.34) 0.97
Unadjusted OR (95% CI) p value Adjusted OR (95% CI) p value
CRP 0.97 (0.89‒1.05) 0.45
Glucose 1.00 (0.99‒1.01) 0.76
pH 0.18 (0‒1243.45) 0.70
pO2 1.00 (0.99‒1.01) 0.66
pCO2 1.00 (0.96‒1.04) 0.93
HCO3 0.99 (0.92‒1.07) 0.86
PaO2/FiO2 ratio 1.00 (1.00‒1.00) 0.31
Other characteristics at discharge
Application of NIV 3.68 (0.49‒27.87) 0.21
Change body weight between admission
and discharge 0.99 (0.90‒1.09) 0.89
Meal pattern
Oral feeding 1.11 (0.32‒3.92) 0.87
Levin tube feeding 1.09 (0.35‒3.34) 0.88
PEG feeding 0 (0) 1.00
ICU Discharge time
Afternoon 0.58 (0.27‒1.21) 0.14
Evening to night 0.72 (0.09‒5.95) 0.76
ICU discharge at weekend 1.34 (0.55‒3.24) 0.52
Discharge to step-down unit 1.10 (0.43‒2.80) 0.84
Length of ICU stay 0.97 (0.93‒1.02) 0.25
Change in APACHE II score during staying in ICU
Between admission and extubation 1.02 (0.97‒1.07) 0.50
Between admission and discharge 1.03 (1.00‒1.07) 0.06
BMI, body mass index; BUN, blood urea nitrogen; COPD, chronic obstructive pulmonary disease; CPR, cardiopulmonary resuscitation; CRP, C-reactive pro- tein; CRRT, continuous renal replacement therapy; ECMO, extracorporeal membrane oxygenation; ER, emergency room; ESRD, end stage renal disease;
Hb, hemoglobin; K, potassium; Na, sodium; WBC, white blood cell; ICU, intensive care unit; APACHE, Acute Physiology and Chronic Health Evaluation;
MBP, mean blood pressure; HR, heart rate; RR, respiratory rate; BT, body temperature; GCS, Glasgow Coma Scale; BUN, blood urea nitrogen; MBP, mean blood pressure; NIV, non-invasive ventilation; PEG, percutaneous endoscopic gastrostomy; OR, odds ratio; CI, confidence interval.
Supplementary Fig. 1. Nomogram calibration plot developed using regres- sion coefficients. The x-axis is the predicted probability and the y-axis is the actual probability of ICU readmission. The dotted line indicates the lo- cation of the ideal nomogram, in which the predicted and actual probabili- ties are identical. The broken line indicates the actual nomogram perfor- mance without correction for overfitting. The solid line represents the bootstrap-corrected performance of the nomogram. ICU, intensive care unit.
Predicted Pr (event=Y) B=1000 repetitions, boot Mean absolute error=0.015, n=337
Actual probability
0.0 0.1 0.2 0.3 0.4
0.0 0.1 0.3
0.2