Degradation of the Selected Pesticides by Gas Discharge Plasma
Zaw Win Min, Su-Myeong Hong*, Chul-Kyoon Mok
1and Geon-Jae Im
Chemical Safety Division, Department of Agro-food Safety, Rural Development Administration, National Academy of Agricultural Science, Suwon 441-707, Republic of Korea,
1Gachon University
(Received on December 2, 2011. Revised on February 1, 2012. Accepted on February 28, 2012)
As increasing the use of pesticides both in number and amount to boost crop production, consumer concerns over food quality and safety with respect to residual pesticides are also continuously increasing. However, there is still lacking of information that can effectively help to remove residual pesticides in foods. In recent years, contaminant removal by gas (or) glow discharge plasma (GDP) attracts great interests on environmental scientists because of its high removal efficiency and environmental compatibility. It was shown to be effective for the removal of some organophosphorus pesticides, phenols, benzoic acid, dyes, and nitrobenzene on solid substrate or in aqueous solution. This work mainly focuses on the removal of wide range of residual pesticides from fresh fruits and vegetables. As for preliminary study, the experiments were carried out to investigate whether GDP can be used as an effective tool for degrading target pesticides or not. With this objective, 60 selected pesticides drop wised onto glass slides were exposed to two types of GDP, dielectric barrier discharge plasma (DBDP) and low pressure discharge plasma (LPDP), for 5 min. Then, they were washed with 2 mL MeCN which were collected and used for determination of remaining concentration of pesticides using LC-MS/MS.
Among selected pesticides, degradation of 18 pesticides (endosulfan-total was counted as one pesticide) by GDP could not be examined because control treatments, which were left in ambient environment, of those pesticides recovered less than 70% or even did not recover. However, majority of tested pesticides (42) were degraded by both types of GDP with satisfactory recovery (>80%) of control sample. Pesticides degradation ranged from 66.88% to 100% were achieved by both types of plasma except clothianidin which degradation in LPDP was 26.9%. The results clearly indicate that both types of gas discharge plasma are promising tools for degrading wide range of pesticides on glass substrate.
Key words Gas discharge plasma, dielectric barrier discharge plasma, low pressure discharge plasma, pesticides, food safety
Abstract
*Corresponding author: Tel. +82-31-290-0514 Fax. +82-31-290-0506, E-mail. [email protected]
Introduction
Pesticides are widely used in producing food and feed.
The role of pesticides in modern agriculture is continuously increasing and their contribution to crop protection is also continuously increasing. Pesticides residue may remain in small amount in or on agricultural products and processed
foods. As a result, consumers are becoming aware of food quality and safety issues, and are realizing the need to be selective about the foods. Therefore, governments take legislative action to ensure that only safe food of acceptable quality is sold, and that the risk of food-borne health hazards is minimized. To ensure the safety of foods, most governments regulate the maximum level of
11
ORIGINAL ARTICLE / RESIDUE and SAFETY Open Access
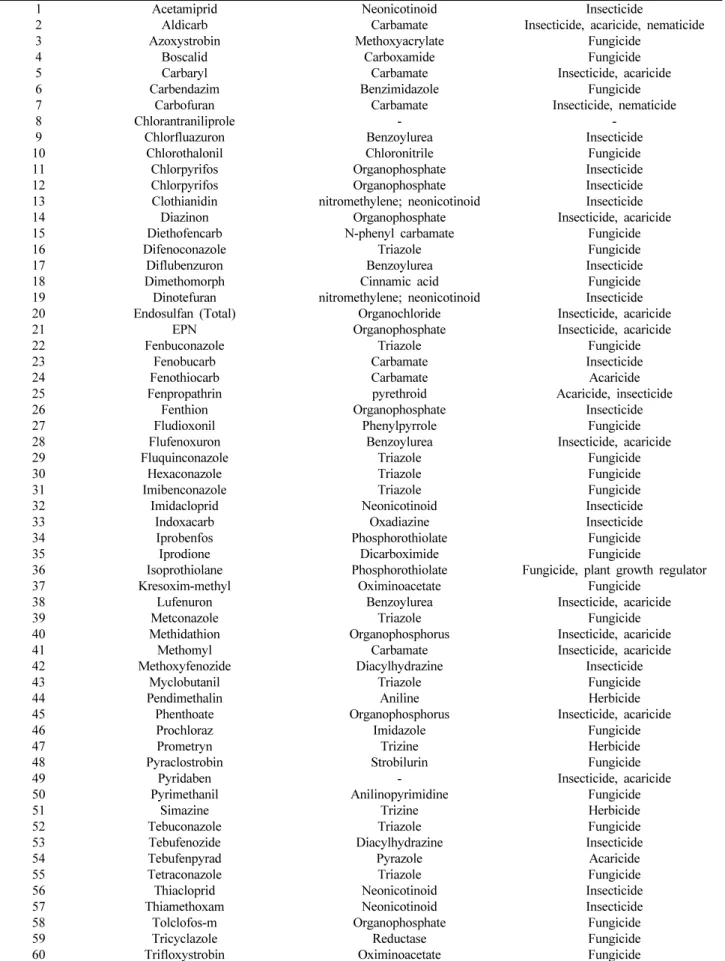
Table 1. Selected pesticides to be treated with GDP
No. Pesticides Name Group Type
1 Acetamiprid Neonicotinoid Insecticide
2 Aldicarb Carbamate Insecticide, acaricide, nematicide
3 Azoxystrobin Methoxyacrylate Fungicide
4 Boscalid Carboxamide Fungicide
5 Carbaryl Carbamate Insecticide, acaricide
6 Carbendazim Benzimidazole Fungicide
7 Carbofuran Carbamate Insecticide, nematicide
8 Chlorantraniliprole - -
9 Chlorfluazuron Benzoylurea Insecticide
10 Chlorothalonil Chloronitrile Fungicide
11 Chlorpyrifos Organophosphate Insecticide
12 Chlorpyrifos Organophosphate Insecticide
13 Clothianidin nitromethylene; neonicotinoid Insecticide
14 Diazinon Organophosphate Insecticide, acaricide
15 Diethofencarb N-phenyl carbamate Fungicide
16 Difenoconazole Triazole Fungicide
17 Diflubenzuron Benzoylurea Insecticide
18 Dimethomorph Cinnamic acid Fungicide
19 Dinotefuran nitromethylene; neonicotinoid Insecticide
20 Endosulfan (Total) Organochloride Insecticide, acaricide
21 EPN Organophosphate Insecticide, acaricide
22 Fenbuconazole Triazole Fungicide
23 Fenobucarb Carbamate Insecticide
24 Fenothiocarb Carbamate Acaricide
25 Fenpropathrin pyrethroid Acaricide, insecticide
26 Fenthion Organophosphate Insecticide
27 Fludioxonil Phenylpyrrole Fungicide
28 Flufenoxuron Benzoylurea Insecticide, acaricide
29 Fluquinconazole Triazole Fungicide
30 Hexaconazole Triazole Fungicide
31 Imibenconazole Triazole Fungicide
32 Imidacloprid Neonicotinoid Insecticide
33 Indoxacarb Oxadiazine Insecticide
34 Iprobenfos Phosphorothiolate Fungicide
35 Iprodione Dicarboximide Fungicide
36 Isoprothiolane Phosphorothiolate Fungicide, plant growth regulator
37 Kresoxim-methyl Oximinoacetate Fungicide
38 Lufenuron Benzoylurea Insecticide, acaricide
39 Metconazole Triazole Fungicide
40 Methidathion Organophosphorus Insecticide, acaricide
41 Methomyl Carbamate Insecticide, acaricide
42 Methoxyfenozide Diacylhydrazine Insecticide
43 Myclobutanil Triazole Fungicide
44 Pendimethalin Aniline Herbicide
45 Phenthoate Organophosphorus Insecticide, acaricide
46 Prochloraz Imidazole Fungicide
47 Prometryn Trizine Herbicide
48 Pyraclostrobin Strobilurin Fungicide
49 Pyridaben - Insecticide, acaricide
50 Pyrimethanil Anilinopyrimidine Fungicide
51 Simazine Trizine Herbicide
52 Tebuconazole Triazole Fungicide
53 Tebufenozide Diacylhydrazine Insecticide
54 Tebufenpyrad Pyrazole Acaricide
55 Tetraconazole Triazole Fungicide
56 Thiacloprid Neonicotinoid Insecticide
57 Thiamethoxam Neonicotinoid Insecticide
58 Tolclofos-m Organophosphate Fungicide
59 Tricyclazole Reductase Fungicide
60 Trifloxystrobin Oximinoacetate Fungicide
each permitted pesticide residue (MRLs).
However, pesticide residues are still observed in Korea (Min et al., 2011). Consumers’ concerns are therefore still increasing regarding food safety issues. For this reason, removal of pesticides residue from market foods becomes a paramount important with respect to food safety.
On the other hand, recently emerging technologies (eg., advanced oxidation processes-AOPs, zerovalent iron-ZVI) for the removal of pesticides residue are mainly focusing onto residue from soil and water (Min et al., 2009 and 2011; Glass, 1972; Hofstetter et al., 2003; Ghauch and Suptil 2000; Satapanajaru et al., 2003), and are obviously unsuitable to apply for fresh fruits and vegetables due to the necessity to add external elements into reaction media.
The main disadvantage of these techniques for the use in food is the need to add external reagents, which are hazardous to human, into the reaction medium. Moreover, chemical oxidation also often results in incomplete destruction of pesticides molecules and tends to the formation of undesirable by-products (Ikehata and El-Din, 2005). Among the methods developed so far, ozonation may be the best way for the removal of residual pesticides from fruits and vegetables since it has a long history of investigation for aqueous pesticide degradation (Reynolds et al., 1989;
Rice, 1997). However, its removal efficiency to certain pesticides is relatively low compare to other AOPs such as O
3/H
2O
2(Ikehata and El-Din, 2005). There is still lacking of information about removal of residual pesticides from fresh fruits and vegetables.
In recent years, contaminants removal by gas discharge plasma (GDP) attracts great interests of environmental scientists because of its high removal efficiency and environmental compatibility. Plasma is more or less ionized gas. It consists of electrons, ions and neutrals which are in fundamental and excited states. The feature of GDP is that high energy electrons generated from plasma provide sufficient energy to dissociate the molecules of the feed gas or target contaminants producing various active species such as H
2O
2and
•OH (Hickling, 1971; Susanta et al., 1998). Recent studies have shown that phenols, benzoic acid, aniline, dyes, and nitrobenzene could be effectively degraded by GDP (Liu and Jiang, 2005; Gao
et al., 2003; Tezuka M. and Iwasaki M., 1999 and 2001;
Hu et al., 2001; Gao et al., 2003; Wang et al., 2007).
Degradation of organophosphorus pesticides, parathion, dichlorvos, and omethoate on solid substrate by GDP was also reported (Bai et al., 2010; Bai et al., 2009; Kim et al., 2007). It is interesting that GDP can provide reductive reaction as reported by Wang and Jiang, 2008. In their experiment, Cr ( Ⅵ) in aqueous solution was reduced to Cr ( Ⅲ) after exposed to GDP for 15 min.
However, to the best of our knowledge, no report reveals the degradation of other pesticides by GDP rather than organophosphates as described above. This field of science is still a gap to be explored not only for the issues of food safety but also for the scientific significances. Since contaminant degradation by GDP is achieved by reactive species in the gaseous phase, this will be safer technology for the removal of residual pesticides from fresh fruits and vegetables. This work will be the first attempt to observe the effectiveness of GDP for degrading wide range of pesticides in agricultural commodities. Moreover, this work will help fulfill the demands of consumers for safe food with acceptable quality.
As for preliminary study, the experiment was conducted to investigate whether GDP can be used as an effective tool for degrading wide range of pesticides or not without using real fruits and vegetables. To this point, target pesticides were selected based on diversity in chemical structures and properties, their wide use in Korea, and potential hazardous effect on human being. List of selected pesticides are shown in Table 1.
Materials and Methods
Chemicals
Pesticides were purchased from Dr Ehrenstorfer (GmbH), Augsburg, Germany. Solvent acetone and acetonitrile were purchased from Merck (KGaA), Darmstadt, Germany.
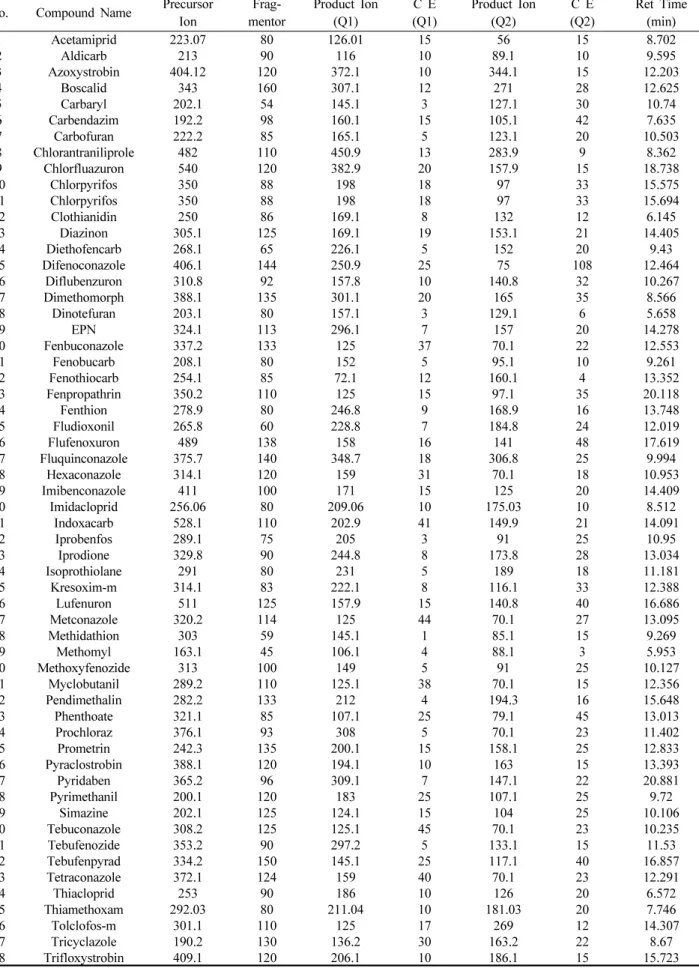
LC-MS/MS condition
Precursor ions and product ions were predetermined at
scan mode. The fragmentor voltage and collision energy
Table 2. LC-MS/MS set up condition for selected pesticides
No. Compound Name Precursor Ion
Frag- mentor
Product Ion (Q1)
C E (Q1)
Product Ion (Q2)
C E (Q2)
Ret Time (min)
1 Acetamiprid 223.07 80 126.01 15 56 15 8.702
2 Aldicarb 213 90 116 10 89.1 10 9.595
3 Azoxystrobin 404.12 120 372.1 10 344.1 15 12.203
4 Boscalid 343 160 307.1 12 271 28 12.625
5 Carbaryl 202.1 54 145.1 3 127.1 30 10.74
6 Carbendazim 192.2 98 160.1 15 105.1 42 7.635
7 Carbofuran 222.2 85 165.1 5 123.1 20 10.503
8 Chlorantraniliprole 482 110 450.9 13 283.9 9 8.362
9 Chlorfluazuron 540 120 382.9 20 157.9 15 18.738
10 Chlorpyrifos 350 88 198 18 97 33 15.575
11 Chlorpyrifos 350 88 198 18 97 33 15.694
12 Clothianidin 250 86 169.1 8 132 12 6.145
13 Diazinon 305.1 125 169.1 19 153.1 21 14.405
14 Diethofencarb 268.1 65 226.1 5 152 20 9.43
15 Difenoconazole 406.1 144 250.9 25 75 108 12.464
16 Diflubenzuron 310.8 92 157.8 10 140.8 32 10.267
17 Dimethomorph 388.1 135 301.1 20 165 35 8.566
18 Dinotefuran 203.1 80 157.1 3 129.1 6 5.658
19 EPN 324.1 113 296.1 7 157 20 14.278
20 Fenbuconazole 337.2 133 125 37 70.1 22 12.553
21 Fenobucarb 208.1 80 152 5 95.1 10 9.261
22 Fenothiocarb 254.1 85 72.1 12 160.1 4 13.352
23 Fenpropathrin 350.2 110 125 15 97.1 35 20.118
24 Fenthion 278.9 80 246.8 9 168.9 16 13.748
25 Fludioxonil 265.8 60 228.8 7 184.8 24 12.019
26 Flufenoxuron 489 138 158 16 141 48 17.619
27 Fluquinconazole 375.7 140 348.7 18 306.8 25 9.994
28 Hexaconazole 314.1 120 159 31 70.1 18 10.953
29 Imibenconazole 411 100 171 15 125 20 14.409
30 Imidacloprid 256.06 80 209.06 10 175.03 10 8.512
31 Indoxacarb 528.1 110 202.9 41 149.9 21 14.091
32 Iprobenfos 289.1 75 205 3 91 25 10.95
33 Iprodione 329.8 90 244.8 8 173.8 28 13.034
34 Isoprothiolane 291 80 231 5 189 18 11.181
35 Kresoxim-m 314.1 83 222.1 8 116.1 33 12.388
36 Lufenuron 511 125 157.9 15 140.8 40 16.686
37 Metconazole 320.2 114 125 44 70.1 27 13.095
38 Methidathion 303 59 145.1 1 85.1 15 9.269
39 Methomyl 163.1 45 106.1 4 88.1 3 5.953
40 Methoxyfenozide 313 100 149 5 91 25 10.127
41 Myclobutanil 289.2 110 125.1 38 70.1 15 12.356
42 Pendimethalin 282.2 133 212 4 194.3 16 15.648
43 Phenthoate 321.1 85 107.1 25 79.1 45 13.013
44 Prochloraz 376.1 93 308 5 70.1 23 11.402
45 Prometrin 242.3 135 200.1 15 158.1 25 12.833
46 Pyraclostrobin 388.1 120 194.1 10 163 15 13.393
47 Pyridaben 365.2 96 309.1 7 147.1 22 20.881
48 Pyrimethanil 200.1 120 183 25 107.1 25 9.72
49 Simazine 202.1 125 124.1 15 104 25 10.106
50 Tebuconazole 308.2 125 125.1 45 70.1 23 10.235
51 Tebufenozide 353.2 90 297.2 5 133.1 15 11.53
52 Tebufenpyrad 334.2 150 145.1 25 117.1 40 16.857
53 Tetraconazole 372.1 124 159 40 70.1 23 12.291
54 Thiacloprid 253 90 186 10 126 20 6.572
55 Thiamethoxam 292.03 80 211.04 10 181.03 20 7.746
56 Tolclofos-m 301.1 110 125 17 269 12 14.307
57 Tricyclazole 190.2 130 136.2 30 163.2 22 8.67
58 Trifloxystrobin 409.1 120 206.1 10 186.1 15 15.723
that gave the most intense peak of selected ions of respective pesticide were used as analytical condition of LC-MS/MS. Dynamic multi-reaction monitoring mode was used for quantitative analysis at positive ionization.
Detail LC-MS/MS conditions for selected pesticides were shown in Table 2.
GC-ECD condition
Agilent 6890-N GC coupled with electron capture detector was used for analysis of chlorothalonil and endo- sulfan (total). Restek-931000 (30 m × 320 μm × 0.50 μm i.d) column was mounted in the oven where temperature programmed from 100 ℃ (hold 3 min) to 280℃ (hold 15 min) at the rate of 15 ℃ min
-1. Injection port and detector temperature were set at 280 ℃ and 310℃ respectively.
Post running time was 10 min at 280 ℃. N
2was used as carrier gas with flow rate of 1 mLmin
-1. Sample injection was conducted at splitless mode with injection volume of 2 μL.
GDP types and condition
Two types of plasma, dielectric barrier discharge plasma (DBDP) (PL-2011, Plasmalife Co., Incheon, Korea) and low pressure discharge plasma (LPDP) (Cute-B, Femto Science Inc., Hwaseong, Korea) were used in this experiment.
In DBDP, two electrodes were covered by dielectric barriers and glow discharge was created between them when potential differences were provided using 50 kV d. c.
discharge voltage at pulse mode with the frequency of 50 kHz. It was operated at atmospheric pressure using 2.65 mm discharge length and 1.25 Amp current. In LPDP, dielectric cylinder is surrounded by magnetic coil. 1.5 kV d. c. discharge voltage at pulse mode with the frequency of 20 kHz from antenna propagated along plasma tube.
Once plasma was created, it flowed from source chamber to process chamber where the substrate was placed. LPDP was operated at the pressure of 3-0.5 torr using 45 mm discharge length and 0.35 Amp current. Oxygen was used as feed gas in both types of plasma.
Experimental Procedure
Effect of GDP type on pesticide degradation Standard stock solutions of 1000 ppm were made in both acetone and acetonitrile for each pesticide. Working standard solutions were made by diluting stock solution with respective solvent. Two replicate samples of each pesticide for each type of plasma were prepared. A 10 μL of 10 ppm standard in acetone was drop wised onto glass slide and left until complete solvent evaporation was achieved. The glass slides were then exposed to DBDP and LPDP. After 5 min of plasma treatment, samples were washed with 2 mL acetonitrile and filtered through 0.2 μm PTFE filter. Then, they were kept in the deep freezer at -20 ℃ until use for analysis in LC-MS/MS.
Control samples were prepared using the same method and washed after 5 min leaving at ambient condition. The amount of solvent acetonitrile needed for washing pesticides from glass slide was predetermined before actual experiment was started. It was found that all pesticides’ recovery were greater than 80% by washing with 2 mL of acetonitrile just after solvent evaporation on glass slide.
Effect of treatment time on degradation of selected pesticides
Pesticides, carbendazim, fludioxonil, imidacloprid, my- clobutanil, thiamethoxam, and tricyclazole, are selected to study the effect of plasma treatment time on their degradation rate and amount. A 10 μL of 10 ppm standards was drop wised onto glass slides. After complete evaporation of solvent, samples were exposed to both DBDP and LPDP for 30s, 1, 3, and 5 min. Determination of residual pesticide concentration was conducted in LC-MS/MS as described above. Concentration of residual pesticides was plot against treatment time. To calculate degradation kinetics and half-lifes, ln[C
t/C
0] vs time was plot for 1
storder kinetics and, 1/[C
t] -1/[C
0] vs time for 2
ndorder kinetics.
The slope of the linear regression line is the degradation rate constant (k) for respective pesticide. Half-life was calculated using T
1/2= ln2/k for 1
storder kinetics and T
1/2= 1/k[C
0] for 2
ndorder kinetics. C
0, C
t, k, and T
1/2stand
Table 3. List of pesticides which control recovery is lower than 70% so that the degradation induced by GDP can’t be proceeded
No Pesticides Name Recovery (%) Degradation (%)
LOD (ppm) R²
Control DBDP LPDP DBDP LPDP
1 Acetamiprid 69.86±3.65 ND 15.09±1.96 100 78.4 0.005 1
2 Aldicarb 6.42±0.16 ND ND ND ND 0.02 0.9999
3 Carbofuran 57.41±2.13 1.64±0.38 2.23±0.81 97.14 96.12 0.005 0.9999
4 Chlorothalonil ND ND ND ND ND 0.05 0.9775
5 Chlorpyrifos ND ND ND ND ND 0.0025 0.9999
6 Diazinon ND ND ND ND ND 0.01 1
7 Endosulfan-Alpha 17.74±0.57 13.43±0.24 11.97±0.04 25.26 32.51 0.005 0.9999 8 Endosulfan-Beta 42.88±3.14 35.84±1.51 26.23±0.03 16.43 38.85 0.005 0.9988 9 Endosulfan-sulphate 74.67±2.51 48.39±2.99 29.50±0.15 35.19 60.49 0.005 0.9952
10 Fenobucarb ND ND ND ND ND 0.001 0.9999
11 Fenthion ND ND ND ND ND 0.005 0.9996
12 Iprobenfos 67.09±11.15 0.03±0.004 0.46±0.52 99.95 99.32 0.005 0.9995
13 Iprodione 63.29±6.46 ND 24.46±9.67 100 61.36 0.01 0.9999
14 Methomyl 34.75±13.43 5.53±0.17 26.36±4.05 84.07 24.12 0.005 0.9992
15 Pendimethalin ND ND ND ND ND 0.01 0.9986
16 Phenthoate ND ND ND ND ND 0.0025 0.9998
17 Procymidone 15.64±9.89 ND ND - - 0.005 1
18 Prometryn 60.56±1.10 1.84±0.10 1.94±0.003 96.96 96.79 0.005 0.9999
19 Pyrimethanil ND ND ND ND ND 0.0025 0.9998
20 Tolclofos-methyl ND ND ND ND ND 0.005 0.9994
for initial concentration of pesticide, concentration at time (t), degradation rate constant, and half-life respectively.
Calculation of degraded pesticide
Pesticide concentration was calculated from detector response to treated samples using standard calibration curve in excel spread sheet. Lowest calibration point was set at limits of detection (LOD) of each pesticide. LOD was set at S/N of 5. Degradation of pesticide was calculated based-on recovery of control sample that was used as initial concentration of pesticide in the following equation:
Degradation (%) = (1 -C
t/C
0) × 100.
Where, C
t= concentration of pesticide at time (t) C
0= initial concentration of pesticide
Results and Discussion
Effect of plasma type on pesticide degradation Control sample of some of target pesticides listed in Table 1, including organophosphorous pesticides, did not
recover after 5 min leaving on glass slide at ambient condition. Therefore, their degradation by GDP couldn’t be observed as shown in Table 3.
However, majority of target pesticides (42) showed promising degradation efficiency of GDP giving satisfactory recovery of control sample (> 80%) as can be seen in Table 4. It was found that degradation of most pesticides ranged from 66.88 to 100%. However, degradation of pesticide clothianidin by LPDP was observed as 26.9%
of initial concentration. Pesticide degradation by DBDP is likely to be greater than that by LPDP in many cases.
Therefore, data were input into Sigma-Plot 10.0, Systat Software, Inc. (San Jose, CA) for statistical analysis.
Two-tailed student’s t-test was carried out to compare the
results. Calculated t-values of some pesticides such as
azoxystrobin, boscalid, carbendazim, fludioxonil, imidacloprid,
thiamethoxam, and tricyclazole are greater than tabulated
t-value 4.30 for 2 degree of freedom (p = 0.05).Therefore
the degradation of those pesticides by DBDP is significantly
greater than the degradation of those pesticides by LPDP
Table 4. List of pesticides which control recovery is greater than 80% and the calculated results of their degradation induced by GDP
No Pesticides Name Recovery (%) Degradation (%)
LOD (ppm) R
2Control DBDP LPDP DBDP LPDP
1 Azoxystrobin 80.53±4.42 11.57±2.17 26.61±2.17 85.63 66.96 0.001 0.9998
2 Boscalid 83.53±4.30 12.78±4.44 33.51±5.32 84.69 59.88 0.005 0.9997
3 Carbaryl 81.73±2.05 ND 5.21±0.56 100.00 93.60 0.005 1
4 Carbendazim 89.05±5.99 10.91±3.22 29.49±1.96 87.75 66.88 0.001 1
5 Chlorantraniliprole 112.05±2.68 ND ND 100.00 100.00 0.001 0.9913
6 Chlorfluazuron 113.45±3.35 ND 22.21±10.55 100.00 85.95 0.0025 0.9992
7 Clothianidin 82.52±2.81 13.01±8.9 60.32±6.33 84.24 26.91 0.005 0.9998
8 Diethofencarb 94.74±1.41 ND ND 100.00 100.00 0.001 0.9996
9 Difenoconazole 95.95±4.14 ND ND 100.00 100.00 0.0025 0.9996
10 Diflubenzuron 93.74±4.80 9.72±2.75 6.87±2.71 89.63 92.68 0.001 0.9988
11 Dimethomorph 95.45±3.09 6.50±3.01 13.88±2.28 93.19 85.46 0.001 0.9996
12 Dinotefuran 82.94±0.59 ND 20.99±3.52 100.00 74.69 0.005 0.9996
13 EPN 92.27±6.88 ND ND 100.00 100.00 0.005 0.9999
14 Fenbuconazole 94.86±1.28 13.40±4.88 16.78±3.65 85.90 82.30 0.001 0.9994
15 Fenothiocarb 92.64±2.71 ND ND 100.00 100.00 0.001 0.9996
16 Fenpropathrin 92.10±5.54 ND ND 100.00 100.00 0.0025 0.9960
17 Fludioxonil 96.21±2.93 ND 17.05±3.15 100.00 82.28 0.01 0.9965
18 Flufenoxuron 92.11±1.46 6.34±0.79 5.91±1.91 93.11 93.58 0.001 0.9962
19 Fluquinconazole 83.54±2.03 8.46±0.50 8.50±0.44 89.87 89.82 0.001 0.9980
20 Hexaconazole 89.16±1.61 6.49±4.61 ND 92.72 100.00 0.001 0.9998
21 Imibenconazole 98.57 ± 3.44 ND ND 100.00 100.00 0.005 0.9997
22 Imidacloprid 84.21±4.38 8.01±0.94 18.78±2.04 90.48 77.70 0.0025 1
23 Indoxacarb 79.39±2.48 7.99±3.06 13.41±0.20 89.94 83.11 0.0025 0.9988
24 Isoprothiolane 105.79±5.09 ND ND 100.00 100.00 0.005 0.9993
25 Kresoxim-methyl 97.47±0.82 ND ND 100.00 100.00 0.0025 0.9998
26 Lufenuron 133.79±13.38 6.48±1.49 ND 95.15 100.00 0.001 0.9998
27 Metconazole 101.16±2.02 ND 12.45±1.59 100.00 87.70 0.005 0.9999
28 Methidathion 81.56±1.86 ND ND 100.00 100.00 0.005 0.9996
29 Methoxyfenozide 96.69±2.54 9.99±4.28 4.81±0.64 89.67 95.02 0.001 0.9998
30 Myclobutanil 93.85±6.11 ND ND 100.00 100.00 0.005 0.9998
31 Prochloraz 107.18±0.02 ND ND 100.00 100.00 0.001 1
32 Pyraclostrobin 104.48±0.05 ND 6.05±1.88 100.00 94.20 0.001 0.9996
33 Pyridaben 111.95±0.08 ND 6.60±7.3 100.00 94.10 0.001 0.9999
34 Simazine 92.92±1.23 19.59±3.51 24.06±3.50 78.90 74.10 0.005 0.9999
35 Tebuconazole 96.38±1.57 ND ND 100.00 100.00 0.005 0.9982
36 Tebufenozide 119.36±0.63 ND 4.28±1.02 100.00 96.41 0.001 0.9996
37 Tebufenpyrad 115.08±0.96 ND ND 100.00 100.00 0.001 0.9999
38 Tetraconazole 95.56±7.85 8.24±0.58 12.19±3.11 91.40 87.20 0.001 1
39 Thiacloprid 105.85±0.27 8.64±5.54 16.09±2.30 91.84 84.80 0.001 0.9998
40 Thiamethoxam 90.74±0.42 5.19±2.20 29.54±2.30 94.28 67.44 0.001 1
41 Tricyclazole 83.87±0.99 ND 27.32±3.62 100.00 67.43 0.01 0.9998
42 Trifloxystrobin 98.18±1.57 5.47±0.66 3.63±0.26 94.43 96.30 0.001 0.9996
at 95% confident level. However, some pesticides’ degradation after 5 min of plasma treatment not differs in both types of plasma. This was observed in pesticides such as feno- thiocarb, imibenconazole, difenoconazole, and myclobutanil.
Such kind of degradation efficiency indicates that pesticide
degradation depends not only on type of plasma used but also on pesticide itself. Chemical structural differences of pesticide may play an important role in degradation process during plasma treatment.
Degradation of pesticides by GDP may be due to high
Fig. 1. Changes of pesticides’ concentration with increasing treatment time by DBDP and LPDP (A) carbendazim, imidacloprid, and myclobutanil (B) tricyclazole, thiamethoxam, and fludioxonil.
Error bars are standard deviation of mean.
Table 5. First order reaction kinetics and half-life
Pesticide LPDP
k (min
–1) t
1/2(min) R
2Carbendazim 0.21 3.36 0.9712
Imidacloprid 0.26 2.67 0.8967
Thiamethoxam 0.25 2.76 0.7805
electron energy (up to 965 kJ/mol) generated in plasma.
Comparing this electron energy with bond energy of some chemical bonding listed in elsewhere (Chang, 2002), it is obvious that plasma generated enough electron energy to dissociate most chemical bonds. On the other hand, it was reported that when potential difference was applied, electrons were accelerated and reach a sufficient energy to dissociate the molecules of feed gas leading production of active oxygen species such as O
2-•, O
•and
•OH where O
2was used as feed gas. These oxidants are reportedly observed as the sources for the degradation of organo- phosphorous pesticides by O
2plasma (Bai et al., 2009).
Although exact degradation mechanism of target pesticides by GDP was not yet observed in this study, it is believed that pesticides degradation was achieved by one of the above mentioned processes.
Effect of treatment time on degradation of selected pesticides
6 pesticides were selected to explore the degradation behavior of pesticides when treated with GDP. Pesticides were selected based on the chemical structures and prop- erties to represent modern pesticides as much as possible.
Moreover, the selection also base on the differences in degradation rate when subjected to GDP to better understand the degradation behavior. The changes in concentration of 6 selected pesticides with increasing treatment time were shown in Fig. 1, (A) and (B). The results indicate that degradation of all target pesticides significantly increased with treatment time (p = 0.01). DBDP showed excellent degradation efficiency in all cases. More than 80% degradation was achieved within 30s of treatment time while LPDP showed relatively slower degradation of pesticides. Trend of degradation of pesticides by DBDP are similar in all cases although it show different trend to LPDP and vise visa. This indicate that the degradation path way and mechanism could be different in two plasma types. Therefore, it is necessary to determine the degradation kinetics and parameters to clearly explain the degradation behavior of target pesticides by different plasma types.
The results of 1
stand 2
ndorder kinetics along with
regression coefficients and half-life values are reported in
Table 5 and 6 respectively. As can be seen in Table 5
and 6, pesticides degradation by DBDP best fitted with
2
ndorder kinetics giving correlation coefficients of > 0.78
in all cases. In the case of carbendazim, myclobutanil, and
tricyclazole, it was even greater than 0.95. This reveals
that degradation of pesticides by DBDP involved more
than one reactive species. Unlike DBDP, pesticides
degradation by LPDP seemed to follow both 1
stand 2
ndorder kinetics. Myclobutanil, tricyclazole, and fludioxonil
which degradation was best fitted with 2
ndorder kinetics
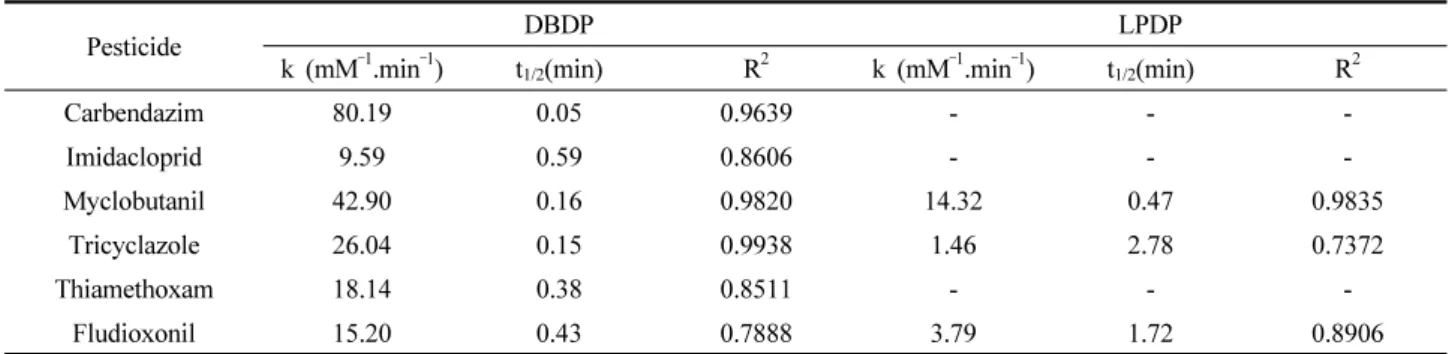
Table 6. Second order reaction kinetics and half-life
Pesticide DBDP LPDP
k (mM
–1.min
–1) t
1/2(min) R
2k (mM
–1.min
–1) t
1/2(min) R
2Carbendazim 80.19 0.05 0.9639 - - -
Imidacloprid 9.59 0.59 0.8606 - - -
Myclobutanil 42.90 0.16 0.9820 14.32 0.47 0.9835
Tricyclazole 26.04 0.15 0.9938 1.46 2.78 0.7372
Thiamethoxam 18.14 0.38 0.8511 - - -
Fludioxonil 15.20 0.43 0.7888 3.79 1.72 0.8906
whereas the rest of pesticides were best fitted with 1
storder kinetics. These results clearly indicated that degradation of pesticides by DBDP and LPDP are achieved by different reaction path way and mechanism. Moreover, the degradation path way and mechanism depends not only on type of GDP used but also on pesticide itself as can be observed in myclobutanil degradation kinetic. Comparing calculated half-life values, it is found that pesticides degradation by DBDP is faster than that by LPDP.
Conclusion
According to the results of this experiment, it can be concluded that both types of GDP can be used as promising tools for the degradation of target pesticides. Degradation by DBDP is relatively faster than that by LPDP. Degradation behavior of pesticides differs from type of GDP used. In addition, the mechanism and pathway of degradation could depend not only on the types of GDP also on pesticides itself. Further study is still needed to observe detail mec- hanism of pesticide degradation by GDP, and degradation of pesticides in real fruit and vegetable samples.
Acknowledgement
This study was carried out with the support of “Coop- erative Research Program for Agricultural Science &
Technology Development (Project No.907006)”, Rural Development Administration, Republic of Korea.
Literature Cited
Bai, Y., J. Chen, H. Mu, C. Zhang, and B. Li (2009) Reduction of dichlorvos and omethoate residues by oxygen plasma treatment. J Agri Food Chem 57:6238 ~6245.
Bai, Y., J. Chen, Y. Yang, L. Guo, and C. Zhang (2010) Degradation of organophosphorus pesticide induced by oxygen plasma: Effects of operating parameters and reaction mechanisms. Chemosphere 81:408 ~414.
Chang, R. (2002) Chemistry, 7
thed.: McGraw-Hill, Inc.: New York, p.356.
Gao, J.Z., Y.J. Liu, W. Yang, L.M. Pu, J. Yu, and Q.F. Lu (2003) Oxidative degradation of phenol in aqueous electrolyte induced by plasma from a direct glow discharge.
Plasma Sour Sci Technol 12:533 ~538.
Gao, J., X. Wang, Z. Hu, H. Deng, J. Hou, X. Lu, and J. Kang (2003) Plasma degradation of dyes in water with contact glow discharge electrolysis. Water Res 37:267.
Ghauch, A., and J. Suptil (2000) Remediation of s-triazines contaminated water in a laboratory scale apparatus using zerovalent iron powder. Chemosphere 41:1835 ~1843.
Glass, B.L. (1972) Relationship between the degradation of DDT and iron redox system in soils. J Agri Chem 20:324
~327.
Hickling, A. (1971). In: Bockris JO’M, Conway BE (eds) Modern aspects of electrochemistry, vol. 6, Butterworth, London, P.
329.
Hofstetter, T.B., R.P. Schwarzenbach, and S.B. Haderlein (2003) Reactivity of Fe (11) species associated with clay minerals.
Environ Sci Technol 37:519 ~528.
Hu, Z, X. Wang, J. Gao, H. Deng, J. Hou, X. Lu, and J. Kang (2001) A study on water treatment induced by plasma with contact glow discharge electrolysis. Plasma Sci Technol 3:
927.
Ikehata, K. and M.G. El-Din (2005). Aqueous pesticide degradation by ozonation and ozone-based advanced oxidation process-A review (Part 1). Ozone: Sci Eng 27(2):83 ~114.
Kim, S.H., J.H. Kim, and B.K. Kang (2007). Decomposition
기체플라즈마에 의한 농약분해특성 연구