http://dx.doi.org/10.23895/kdijep.2020.42.1.31
31
Financial Development and Economic Growth in Korea
†By S
UNJOOH
WANG*
Does financial development contribute to economic growth? The literature finds that an expansion in financial resources is useful for economic growth if the degree of financial development is under a certain threshold; otherwise, the expansion is detrimental to growth.
Almost every published study, however, considers country-panel data.
Accordingly, the results are not directly applicable to the Korean economy. By examining Korean time-series data, this paper finds that there is an inverse U-shaped relationship between the per capita real GDP growth rate and private credit (as a percentage of nominal GDP)―a well-known measure of quantitative financial development, where the threshold is 171.5%. This paper also finds that private credit is positively associated with economic growth if the share of household credit out of private credit is less than 46.9%; otherwise, private credit is negatively associated with economic growth. As of 2016, the ratio of private credit to GDP and the ratio of household credit to private credit are both higher than the corresponding thresholds, which implies that policymakers should place more emphasis on qualitative financial development than on a quantitative expansion of financial resources.
Key Word: Financial Development, Economic Growth, Private Credit, Household Credit
JEL Code: E51, E60, G00
I. Introduction
oes an expansion in financial resources always facilitate economic growth? At first glance, it seems that there is a positive relationship between financial development and economic growth, as additional financial resources can serve as
* Associate Fellow, Korea Development Institute (E-mail: [email protected])
* Received: 2020. 1. 28
* Referee Process Started: 2020. 1. 29
* Referee Reports Completed: 2020. 2. 21
† This paper is an extension of a working paper, “Economic Growth and the Quantitative Expansion of Financial Resources,” Policy Study 2019-02, Korea Development Institute, 2019 (in Korean). Special Thanks are due to Suyeon Kwon for her devoted research assistance. Valuable comments by two anonymous referees are appreciated.
D
a factor affecting production. However, recent financial crises have witnessed that too much finance can harm sustainable economic growth.
If the true relationship between finance and growth is revealed, one can draw on several important policy implications. If there is a positive relationship, more investment in the financial sector is always beneficial. If there is a negative relationship between finance and growth, existing public policies that aim to expand the financial sector must change.
There is a large body of work on the relationship between finance and growth but, interestingly, the literature draws on a general conclusion that there is an inverse U- shaped relationship between financial development and economic growth.
1That is, an expansion in financial resources is useful for accelerating economic growth if the degree of financial development is under a certain threshold; otherwise, this expansion is detrimental to growth.
There are a number of economic theories that explain why the nonlinear relationship between finance and growth arises. According to a first group of theories, as financial resources are being accumulated, these resources are distributed less likely to sectors with high growth potential, such as the corporate sector or the investment sector, instead being distributed more to sectors with low growth potential, such as the household sector or the consumption sector (Hung, 2009; Beck et al., 2012; Hoshi and Kashyap, 2004). According to a second group of theories, if the amount of debt in an economy is sufficiently large, the economy becomes vulnerable to outside shocks; therefore, it is highly likely to face a financial crisis that typically reduces growth rates for at least several years, if not a decade (Drechsler et al., 2016; Stiglitz, 2000; Levchenko et al., 2009). According to a third group of theories, as the financial sector expands, talented workers are more likely to work in the financial sector than in the real economy; accordingly, poor labor productivity in the real economy leads to a slowdown in growth (Tobin, 1984; Kneer, 2013).
However, there are several caveats to consider when interpreting the nonlinear relationship found in the literature. First, financing methods can be divided roughly into direct financing and indirect financing. Secondly, there are two different aspects of financial development: quantitative and qualitative. The extant literature finds that there is an inverse U-shaped relationship between growth and quantitative financial development with regard to indirect financing. Although this finding is general, more research should be conducted to examine the growth-finance relationship in the area of direct financing or to examine possible relationships between growth and qualitative financial development.
Nevertheless, the findings in the literature have several important policy implications, as follows. First, a majority of households and firms in most economies, including some advanced economies, rely on different types of indirect financing, such as loans, whereas they rarely use direct financing means such as bond or stock issuances when raising funds. Secondly, if there is an inverse U-shaped relationship between growth and finance, there is a certain threshold level of financial development. If the current status of financial development is below the threshold, financial policies that aim to expand available financial resources are
1See Heil (2017) for a survey of this literature.
justifiable. However, if the current status of financial development exceeds the threshold, policymakers should refrain from simply expanding the financial sector and instead should improve on its qualitative aspects.
However, the findings of recent studies cannot be applied directly to the Korean economy because almost every existing study uses country-panel data. Some papers consider the OECD or G20 countries together while others study groups of emerging markets. These papers find that there are inverse U-shaped relationships between economic growth and the ratio of private credit to GDP while also indicating that 100% is a plausible threshold. Nonetheless, because none of these papers focus on the Korean economy, despite the fact that there are a number of similarities between Korea and several other countries, one cannot be sure whether such a nonlinear relationship holds or whether the threshold level is 100% in the Korean economy as well.
This paper focuses on the Korean economy and, in this regard, examines Korean time-series data. Because non-stationary time-series variables typically lead to misleading regression results if they are not cointegrated, this paper examines whether there are cointegrating relationships between the variables of interest and, if they exist, estimates these cointegrating relationships.
The main result of this paper is as follows. First, there is an inverse U-shaped cointegrating relationship between the five-year average economic growth rate and the ratio of private credit to GDP. It is also demonstrated here that the threshold level of private credit to GDP is 171.5%. The ratio of private credit to GDP in Korea has increased steadily over time, becoming as high as 193% by the end of 2016.
II. Related Literature
A. Empirical Studies
The literature in the early stage finds a positive relationship between financial development and economic growth. King and Levin (1993) examine country-panel data from 77 advanced and developing countries, finding that the private credit and the GDP growth rate are positively associated for the period from 1960 to 1989.
However, King and Levin (1993) do not consider the possibility of reverse causality;
as the economy grows, more resources are accumulated and hence the financial sector of the economy can expand. To deal with this endogeneity problem, Rajan and Zingales (1998) use instrumental variables and focus on small and medium-sized industries, for which it seems that no strong relationship between industrial growth and nationwide financial development exists. Their findings reaffirm the main result of King and Levin (1993).
However, the literature in the second stage during the period from the mid-2000s
to the early 2010s finds that a financial expansion does not necessarily cause
economic growth. Manning (2003) adopts the same methodology used by Rajan and
Zingales (1998) but distinguishes OECD countries from non-OECD countries. He
finds that the usual positive relationship holds for non-OECD countries, but there is
no statistically significant relationship for OECD countries. Pagano and Pica (2012)
show a similar result. These findings suggest that financial development clearly
contributes to economic growth in underdeveloped countries, whereas the link is vague in advanced countries.
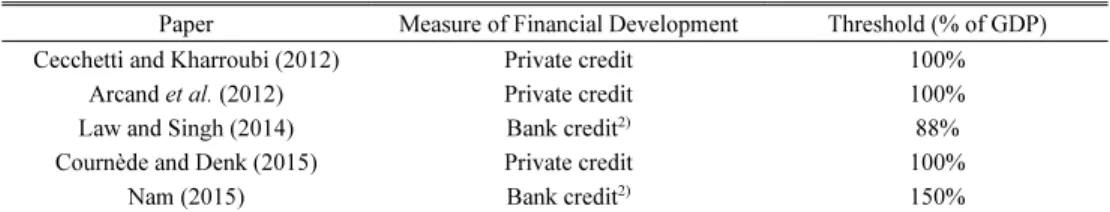
Interestingly, the literature in the third stage during the period from the early 2010s to date finds even more radical results (Table 1). Cecchetti and Kharroubi (2012) find an inverse U-shaped relationship between economic growth and the ratio of private credit to GDP by studying panel data from fifty countries for the sample period of 1980-2009. Arcand et al. (2012) enlarge the number of countries to 100 and broaden the period to 1960-2010. Even with this large sample, the result is qualitatively equivalent, and the threshold is found to be 100%. Cournède and Denk (2015) focus on advanced countries, in their case OECD countries and G20 countries, but the result is similar and the threshold in terms of private credit is again 100% of GDP.
Law and Singh (2014) conduct a non-parametric estimation to analyze asymmetries in the nonlinear relationship. The hypothesis is that the absolute impact of finance on growth when the size of the financial sector is under a threshold may differ from the absolute impact of finance on growth when the size exceeds the threshold. Their findings show that 88% is the threshold in terms of the ratio of bank credit to GDP, and the absolute impact if the size of the financial sector is under the threshold is greater than that when the size exceeds the threshold.
Nam (2015) conducts a quantile regression analysis and finds a relatively high threshold. Using OECD country panel data, he finds that the threshold level is 150%
in terms of the ratio of bank credit to GDP. Given that there is less bank credit than private credit, his result suggests that the threshold level in terms of the ratio of private credit to GDP must be higher than the typical level of 100%.
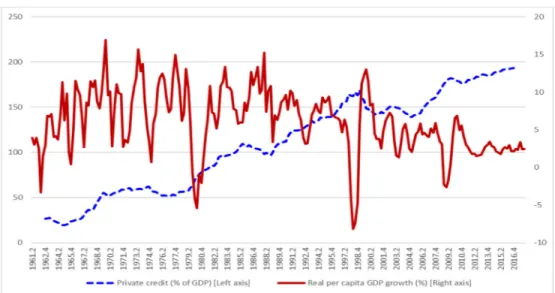
Figure 1 shows the movement of the ratio of private credit to GDP in Korea. It has increased steadily, reached 100%, which is suggested as the threshold by many existing studies, and it finally reached 193.2% at the end of 2016. The ratio of bank credit to GDP (not presented in Figure 1) also increased continuously during the same period, whereas its level as of 2016 is 131.9%, which is still lower than the 150%, the threshold suggested by Nam (2015).
Although the ratio of private credit to GDP is a very well-known measure of financial development in the literature, there are a number of other complementary measures, including household credit, total credit, liquid liabilities in the financial sector, market capitalization, financial sector employment, and the financial sector value-added factor. The literature examines the relationships between economic
TABLE 1—THRESHOLD LEVELS OF INVERSE U-SHAPED RELATIONSHIPS BETWEEN GROWTH AND FINANCE1) Paper Measure of Financial Development Threshold (% of GDP)
Cecchetti and Kharroubi (2012) Private credit 100%
Arcand et al. (2012) Private credit 100%
Law and Singh (2014) Bank credit2) 88%
Cournède and Denk (2015) Private credit 100%
Nam (2015) Bank credit2) 150%
Note: 1) The threshold level is linked to the peak of the inverse U-shape, 2) Private credit is the sum of credits that banks and non-bank institutions provide to the private sector, whereas bank credit is private credit generated only by banks.
Source: Hwang (2017), Table 3-6.
FIGURE 1.PRIVATE CREDIT (UNIT:% OF GDP) AND PER CAPITA REAL GDP GROWTH (UNIT:%) Note: The growth rate of the per capita real GDP is calculated annually.
Source: Table A1.
growth and these complementary measures and finds corresponding threshold levels.
Table 2 lists these thresholds and also shows whether the Korean ecuonomy reaches these threshold levels. As of 2016, household credit as a percentage of GDP was 93%, whereas Lombardi et al. (2017) find that the related threshold level is 80%.
Total credit as a percentage of GDP is also substantially higher than the threshold level of 99%, as suggested by Law and Singh (2014). Similarly, the liquid liabilities and value-added factors in the financial sector are both higher than the suggested thresholds. Although the market capitalization and financial sector employment are lower than the corresponding thresholds, the differences are marginal.
TABLE 2—COMPLEMENTARY MEASURES OF FINANCIAL DEVELOPMENT AND CORRESPONDING THRESHOLDS
Measure Unit Year Levels in Korea Threshold
Household credit % of GDP 2016 93 801)
Total credit % of GDP 2016 233 992)
Liquid liabilities in the financial sector % of GDP 2014 135 913)
Market capitalization % of GDP 2014 89 100
Financial sector employment % of total employment 2013 3.5 3.934)
Financial sector value-added % of GDP 2010 5.7 5.545)
Note: 1) Household credit is private credit provided to households and related nonprofit organizations. By examining the relationships between household credit and GDP growth, Lombardi et al. (2017) find that 80% is the threshold of household credit as a percentage of GDP, 2) Total credit is private credit provided to the private sector and governmental bodies. Law and Singh (2014) find that 99% is the threshold, though the inverse U-shaped relationship between total credit and GDP growth is not statistically significant, 3) Liquid liabilities in the financial sector are M3. Law and Singh (2014) find that 91% is the threshold, though the related inverse U-shared relationship is not statistically significant, 4) Financial sector employment is the ratio of the employment in the financial and insurance sector to the total employment. Cecchetti and Kharroubi (2012) find that the threshold is 3.9, 5) Financial sector valued-added refers to value-added in the financial and insurance sector, for which Cournède and Denk (2015) find that 5.54 is the threshold.
Source: Table 3-7 of Hwang (2017).
FIGURE 2.HOUSEHOLD CREDIT VS.CORPORATE CREDIT Source: BIS Credit to the Non-financial Sector Database 2018.
Does the composition of private credit matter for economic growth? To answer this question, Lombardi et al. (2017) examine whether there is any inverse U-shaped relationship between the ratio of household credit to GDP and the economic growth rate. Their results show that there is indeed such a nonlinear relationship, and the corresponding threshold level is 80%. Figure 2 shows the path of household credit in Korea. It is apparent that the ratio of household credit to GDP has increased steadily since 1962, reaching 90% after 2015.
B. Theoretic Background
According to classical economics theories such as the money-neutrality theory or the Modigliani-Miller’s theorem, money or the capital structure do not affect real economic output. This is particularly true when there is no economic friction.
However, many studies show that information asymmetry between investors and entrepreneurs results in financial constraints, which constrains production possibilities. If investors cannot observe whether entrepreneurs use their money in appropriate ways, they are reluctant to invest on these entrepreneurs. Therefore, even the entrepreneurs with highly profitable projects are unable to finance their projects if their own money (i.e. net worth) is not enough (Bernanke and Gertler, 1989; Tirole, 2003). However, if financial resources are abundant, financial constraints are weak and hence entrepreneurs with highly promising projects can finance and launch their projects. As a result, real economic output increases (Diamond and Rajan, 2006;
Zheng, 2013).
However, recent studies propose three theories based on which financial development beyond certain threshold levels can constrain economic growth.
According to the first theory, there is a tendency for financial resources distributed
to sectors with low growth potential rather than high growth potential to increase as
the financial sector expands. Hung (2009) shows theoretically that financial
resources are invested mostly in the investment sector rather than in the consumption sector in the early stage of financial development; thus, these resources enhance economic growth. However, as financial resources become abundant, the most likely recipient is not the investment sector but the consumption sector, with low growth potential. In a theoretic analysis, Beck et al. (2012) find that the corporate sector is in a better position with regard to financing than the household sector in the early stage of financial development, but as financial resources expand, financiers invest mostly in the household sector instead, which presumably has low growth potential.
Related to this, Hoshi and Kashyap (2004) find that Japanese expansionary monetary and financial policies since 1990 ultimately reduced investments in young and promising firms but increased investments in what were known as zombie firms, thereby exacerbating the longstanding recession in the Japanese economy.
The second theory explains that the nonlinear relationship between growth and finance arises because too much finance ultimately increases the likelihood of a financial crisis, which in turn slows down the speed of economic growth for several years, if not a decade. In this regard, Drechsler et al. (2016) find that quantitative easing in the Euro area after the 2008 global financial crisis and the subsequent European sovereign debt crisis did not significantly promote investments but only transferred risk from prudential banks to highly risky banks. Stiglitz (2000) finds that the risk and volatility of domestic financial markets and real economies increase as financial sectors are expanded such that entry barriers faced by foreign investors are reduced (see also Kose et al., 2006 and Levchenko et al., 2009). As these papers find, too much finance weakens the resilience of the financial system, thus increasing the probability of a new crisis. However, this leads one to question the nature of the relationship between crises and growth. Laeven and Valencia (2012) carefully study countries that underwent a financial crisis and find that a crisis deters economic growth not just for the first two or three years after the crisis but for many years thereafter. Each of the countries in their study deviated from the original growth path at the time of the financial crisis.
They then embarked on slow growth for many years and, only after several years or a decade, reached parity with their original growth path. For instance, in the United States, Germany, Ireland, Thailand, and Japan, it took more than eight years to resume the original growth path.
The third economic theory, holds that too much finance ends up decreasing growth
rates, focuses on the allocation problem of talented workers on industries. This
theory holds that talented workers tend to find jobs in the financial sector, which by
itself contributes little to economic growth compared to workers in the
manufacturing or other real economic sectors when the degree of financial
development exceeds a certain threshold. Tobin (1984) critically analyzes the
phenomenon by which talented workers move from real economic sectors to the
financial sector. Kneer (2013) finds through an empirical analysis that labor
productivity in the manufacturing sector for which high-skilled labor is important
decreases as interstate branching regulations are relaxed, allowing banks to establish
branches in not only in the states where their headquarters are located but also in
other states.
C. Korea-related Studies
Almost every study in the literature considers country-level panel data when analyzing the potential relationships between finance and growth. Moreover, to the best of the author’s knowledge, researchers have not focused on the Korean economy. Therefore, although Korea and other countries, especially those in the OECD group, are similar in several aspects, the existence of the aforementioned nonlinear relationship and the suggested threshold level cannot be directly applied per se to the Korean economy.
However, there are a few related studies, though they are not very closely related to the issue tackled in this paper. Kim and Park (2018) empirically analyze the effects of financial development on the growth of the corporate sector, though not the overall economy. For the period of 2000-2015, they find that the growth rate of bank loans has a positive effect on the value-added growth rate if the companies are small or medium-sized organizations, but these effects disappear for large companies. Their findings imply that the positive effect of finance on corporate growth is limited to companies that face strong financial constraints. Cournède and Denk (2015) conduct a simple linear regression analysis using Korean annual time-series data. Without controlling for changes in industrial structures or financial crises that occurred in Korea, such as the oil shocks in the 1970s or the 1997 Asian financial crisis, they find that growth rates are not statistically significantly associated with the ratio of private credit to GDP.
III. Finance and Growth in Korea
A. Data
I examine a Korean time-series dataset pertaining to the size of the financial sector
and the speed of economic growth. The sample period is from 1960 Q1 to 2018 Q1
for most of the time-series variables. Two of the key variables are the per capita real
GDP growth rate and the private credit as a percentage of the nominal GDP. These
two variables are quarterly time-series variables. However, among many control
variables, there are no quarterly data on population growth and average years in
education. Therefore, I transform annual data to quarterly data by means of linear
interpolation for these variables. See Table A1 in the appendix for more details about
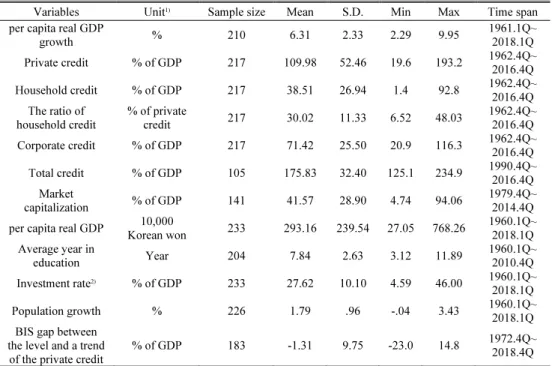
the variables. Also see Table 3 for descriptive statistics pertaining to these variables.
TABLE 3—DESCRIPTIVE STATISTICS
Variables Unit1) Sample size Mean S.D. Min Max Time span
per capita real GDP
growth % 210 6.31 2.33 2.29 9.95 1961.1Q~
2018.1Q
Private credit % of GDP 217 109.98 52.46 19.6 193.2 1962.4Q~
2016.4Q
Household credit % of GDP 217 38.51 26.94 1.4 92.8 1962.4Q~
2016.4Q The ratio of
household credit % of private
credit 217 30.02 11.33 6.52 48.03 1962.4Q~
2016.4Q
Corporate credit % of GDP 217 71.42 25.50 20.9 116.3 1962.4Q~
2016.4Q
Total credit % of GDP 105 175.83 32.40 125.1 234.9 1990.4Q~
2016.4Q Market
capitalization % of GDP 141 41.57 28.90 4.74 94.06 1979.4Q~
2014.4Q per capita real GDP 10,000
Korean won 233 293.16 239.54 27.05 768.26 1960.1Q~
2018.1Q Average year in
education Year 204 7.84 2.63 3.12 11.89 1960.1Q~
2010.4Q Investment rate2) % of GDP 233 27.62 10.10 4.59 46.00 1960.1Q~
2018.1Q
Population growth % 226 1.79 .96 -.04 3.43 1960.1Q~
2018.1Q BIS gap between
the level and a trend
of the private credit % of GDP 183 -1.31 9.75 -23.0 14.8 1972.4Q~
2018.4Q Note: 1) ‘% of GDP’ means % of nominal GDP, 2) The investment rate is the growth rate of gross fixed capital formation.
B. Inverse U-shaped Cointegrating Relationship
In the literature, the private credit as a percentage of the nominal GDP is used as one of the leading indicators of quantitative financial development (see Heil, 2017 for a survey of the literature). Private credit is credit created by bank and nonbank institutions and provided to private economic agents, such as households and firms.
Private agents can use two major options to raise funds―loans and bonds. However, bond issuance is an option applicable only for a few large-sized companies, as only highly creditworthy issuers can issue bonds, whereas bank or non-bank loans can be used by households or small- or medium-sized companies. Therefore, private credit, which is essentially the total amount of loans provided to private agents, is a good measure of the overall size of the financial sector.
Figure 1 compares the movements of private credit and economic growth over time in Korea. Since the 1960s, the ratio of private credit to GDP has increased continuously, while the per capita real GDP growth rate increased until the mid- 1980s but has since decreased steadily. From this comparison, per capita real GDP growth appears to be nonlinearly related to the ratio of private credit to GDP.
However, a careful econometric analysis should be conducted to draw a reliable
conclusion about this relationship, as both the ratio of private credit to GDP and the
per capita real GDP growth rate are time-series variables. Therefore, simple
comparisons of those two variables may provide misleading results. For this reason,
it is necessary to test whether they are really meaningfully related. In this study, a
cointegration analysis is conducted.
The dependent variable is the five-year (i.e., 20-quarter) moving average of the per capita real GDP growth rate.
2To increase the available sample size, I use quarterly data, and to control for seasonal effects, I use season-adjusted quarterly data. In addition, to consider the mid-term or long-term growth effects of financial development, I consider the five-year average growth rate. Most published empirical papers also use similarly defined five-year average growth rates (Heil, 2017).
I control a number of relevant variables when estimating the cointegrating relationship between the ratio of private credit to GDP and the five-year average GDP growth rate. According to classical economic growth theory, major factors that affect economic growth include the degree of economic development, human capital, physical capital, and the population. To control for each of these relevant factors, I use the logarithm of the per capita real GDP, the average number of years in education of those who are at least 25 years old, the growth rate of gross fixed capital formation, and the growth rate of the population of those 16-64 years old, respectively. These variables are commonly used as control variables in the literature (see Table 10 of Cournède and Denk, 2015, for instance).
Notably, a majority of these variables considered in this analysis are time-series variables; hence, they may be non-stationary variables with unit roots. As is well known in the econometrics literature, a simple linear regression analysis using such non-stationary variables can produce misleading results.
In this reason, I conduct a unit root test of the aforementioned time-series variables (see Table 4). The test results suggest that the five-year average growth rate, the level of the ratio of private credit to GDP, the square of the ratio of private credit to GDP, the log of the per capita real GDP, and the investment rate are I(1) variables (i.e., non-stationary), as in this case the null hypothesis that the level of each of these variables has a unit root cannot be rejected, whereas the null hypothesis that the first
TABLE 4—UNIT ROOT TEST RESULTS Variable P-value for the level of the
variable1) P-value for the first difference
of the variable1) Judgment Per capita real GDP growth
(five-year average) 0.3666 0.0025***2) I(1)
The level of the ratio of
private credit to GDP 0.1169 0.0000*** I(1)
The square of the ratio of
private credit to GDP 0.1324 0.0000*** I(1)
Log (per capita real GDP) 0.9995 0.0001*** I(1)
Investment rate 0.6942 0.0000*** I(1)
Population growth 0.0597* . I(0)
Average years in education 0.0000*** . I(0)
Note: 1) The null hypothesis is that the time-series variable of interest follows a random walk (i.e., contains a unit root) with a constant and a deterministic trend. The length of lagged differences in the fitting model is selected according to the Akaike information criterion. The test statistic is Z(t) and the p-value is a MacKinnon approximate p-value, 2) *, ** and *** indicates 10%, 5% and 1% significance levels, respectively.
2If two variables are cointegrated, it is difficult to determine which variable is the dependent variable and which is the independent variable simply based on an econometric result. That is, some economic reasoning is required to define the dependent variable. In this paper, I briefly discuss how reverse causality is less likely and how therefore it is more reasonable to regard the growth rate as opposed to private credit as the dependent variable.
difference of each of these variables has a unit root can be rejected. Similarly, the test results also suggest that the population growth and the average years in education are I(0) variables (i.e., stationary).
In this test, I consider a fitting model with a constant and a deterministic trend.
The length of lagged differences in this fitting model is selected with the Akaike information criterion assuming that the maximum possible length is 19.
3(The selected lag length for each variable is reported in Table A2 in the appendix.) As a robustness check, given that this paper considers quarterly variables and that the dependent variable is a 19-quarter moving-average variable, I also consider lag lengths of 3, 7, 11, and 15. (Because these lag lengths are based on the difference rather than on the level of a given time-series variable, I consider 3, 7, 11, and 15 rather than 4, 8, 12, and 16.) However, the test results do not critically depend on these lag selections.
4See Table A3-A6 in the appendix for the test results with these different lags. In addition, I consider an alternative fitting model with a constant but without a deterministic trend. The related test results still suggest that the key variables, in this case the five-year average growth rate and the level and the square of the ratio of private credit to GDP, are I(1) variables.
In an estimation of a cointegrating relationship between growth and finance, I do not need to add the I(0) variables, because if there exists a cointegrating relationship among the variables of interest, the estimation result is then invariant to the addition or omission of I(0) stationary variables (see Engle and Granger, 1987). That is, I shall consider only the five I(1) variables in the following cointegration analysis.
As the unit root test results suggest that the dependent variable, the independent variables, and the two control variables are I(1) variables, I test whether there is a cointegrating relationship among those five variables. If a linear combination of two or more I(1) variables turns out to be an I(0) variable, this linear combination is referred to as a cointegrating relationship, which represents a long-term stable relationship among those I(1) variables. Because I consider five I(1) variables, there are at most four cointegrating relationships in principle. If more than two I(1) variables are of interest, the Johansen test is useful to determine how many cointegrating relationships exist. In general, the test result could depend on the length of the lagged differences in the related fitting model, which is a vector error correction model (i.e., VECM). I select a lag length of 1 using the Akaike information criterion. Moreover, the test result could depend on whether the VECM contains trends in its long-term and/or short-term relationships. For the subsequent tests, I consider a VECM with trends in both long-term and short-term relationships because the dependent variable is a moving-average variable and hence presumably contains a deterministic trend in its data-generation process.
Table 5 shows the Johansen test result. First, the test result allows the rejection of the null hypothesis that there are at most zero cointegrating relationships (i.e., maximum rank = 0), as the corresponding trace statistic exceeds the 5% significance
3In the following analysis, I use the Akaike information criterion to select the length of the lagged difference in the unit root tests, the Johansen cointegration tests, and the cointegration estimation based on vector error correction models. In all of these analyses, I assume that the maximum possible length is 19. Therefore, if the Akaike information criterion results in a choice of 2, it means that 2 is the optimal lag length from the group of 0, 1, 2, ..., 19.
4 The judgment of whether the population growth is an I(1) or I(0) variable depends on the lag selection.
However, I shall briefly show that the estimation result of the cointegrating relationship is robust to the inclusion or exclusion of this variable. See Table A9 in the appendix.
TABLE 5—JOHANSEN COINTEGRATION TEST RESULTS
Maximum rank Log likelihood Eigenvalue Trace statistic 5% significance level
0 -1462.8559 . 85.7611 77.74
1 -1444.2471 0.16903 48.5435 54.64
2 -1430.9690 0.12377 21.9872 34.55
3 -1422.9657 0.07655 5.9808 18.17
4 -1420.0484 0.02861 0.1461 3.74
5 -1419.9754 0.00073
Note: The underlying fitting model (i.e., a vector error correction model) contains one lagged difference and trends in the long-term and short-term relationships. The maximum rank indicates the maximum number of cointegrating relationships. For the column where the maximum rank is 1, the corresponding null hypothesis is that there is at most one cointegrating relationship. If the trace statistic exceeds the significance level, the corresponding null hypothesis is rejected.
level. Secondly, the test result does allow us to reject the null hypothesis that there is at most one cointegrating relationship because the trace statistic does not reach the 5% significance level. In sum, the test result suggests that there exists one cointegrating relationship among the five I(1) variables. For robustness checks, I consider a number of alternative fitting models with different lag lengths (from 0 to 19) with or without trends. However, the Johansen test result always suggests that there exists at least one cointegrating relationship.
In addition, I test whether there is a structural break in the cointegrating relationship between finance and growth. In relation to this, it has been argued that the Korean economy experienced several structural changes during the sample period of 1960-2018. For instance, agriculture was the major industry in the Korean economy early during this range, but as time passed, manufacturing or services became more important. In order to test whether there are any structural breaks in the cointegrating relationship, I use the Gregory-Hansen method (see Table 6). This method is useful to test whether there are breaks in levels, breaks in trends, breaks in slopes, or breaks in both trends and slopes. The null hypothesis is that there is no cointegrating relationship with a single break at an unknown date. The test result is such that the absolute level of the test statistic is smaller than the absolute level of the corresponding significance level. Accordingly, the null hypothesis is not rejected.
This result is robust to the type of break considered in the null hypothesis, including a break in the level, a break in the trend, a break in the slope, or a break in both the trend and slope. This test result can be interpreted in one of the following ways.
First, there exists a cointegrating relationship but without a break. Second, neither a
TABLE 6—GREGORY-HANSEN TEST RESULTS FOR A STRUCTURAL BREAK Type of break Level of test statistic Significance level
1% 5% 10%
Break in level -38.89 -70.18 -59.40 -54.38
Break in trend -39.31 -76.95 -65.44 -60.12
Break in slope -48.20 -90.35 -78.52 -75.56
Break in trend and slope -49.70 -100.69 -88.47 -82.30
Note: The null hypothesis is that there is no cointegrating relationship with a single break (in level, in trend, in slope, or in neither the trend nor the slope) at an unknown date. If the absolute level of the test statistic exceeds the absolute level of the significance level, the null hypothesis is rejected. The test statistic is Z(a).
cointegrating relationship nor a break exists. Third, there is a break but no cointegrating relationship. Recall that the Johansen test suggests that there is a cointegrating relationship. Therefore, one can conclude that the first interpretation is acceptable. Hence, in the following analysis, I estimate the cointegrating relationship assuming the absence of a structural break.
In order to estimate the cointegrating relationship, I analyze the following vector error correction model (hereafter, VECM), which is useful to analyze both long-term relationships and short-term adjustments among non-stationary time-series variables.
(1)
y
t [ y
t1 x
t1] (
0 y
t1 x
t1)
t.where g
tis the per capita real GDP growth rate at a quarter ,t
1
1920
t,
t s
s t
y
g
c
tis the private credit to GDP ratio at a quarter ,t x
1tis log of the per capita real GDP,
x
2tis the investment rate,
2 1 2
( , , , )
t t t t t
x c c x x
Explanations of the notation and the model are as follows. Let g
tdenote the per capita real GDP (year-on-year) growth rate evaluated at a quarter .t 1
1920
t
t s
s t
y
g
is the five-year (i.e., 20-quarter) average of the growth rate. Let c
tdenote private credit as a percentage of the GDP at a quarter .t x
t ( , , , ) c c x x
t t2 1t 2t is the vector of explanatory variables, including the level and the square of the ratio of private credit to GDP and two other I(1) variables. represents the first difference of an underlying time-series variable. The linear combination of [ y
t1 x
t1] represents a cointegrating relationship. is a constant and ( , , , )
1 2 1 2 are the vector of the coefficients of the level and the square of the ratio of private credit to GDP, the log of the per capita real GDP, and the investment rate, respectively. The coefficients of interest are
1and
2, which jointly represent a long-term stable relationship between growth and finance.
0and
1 2 1 2
( , , , )
are the coefficients of the dependent variable and the four explanatory variables that represent short-term relationships among those variables.
is the coefficient of adjustment. Suppose that some of these five variables deviate
temporarily from the long-term stable relationship. If is negative, the five
variables adjust to each other in the short-run in order to recover the long-term
relationship. For instance, if there is a positive shock of the average growth rate (i.e.,
1 1
t t
y
x
), the growth rate decreases in the short run in order to recover the long-term relationship (i.e., y
t1 x
t1) if the coefficient of adjustment
is negative. Finally, and
tare the constant and error term, respectively.
In the following analysis, I select a lag length of 1 based on the Akaike information criterion. In addition, I consider a VECM with trends in the long-term and short-term relationships because the dependent variable is a moving-average variable and is hence believed to contain a deterministic trend in its data-generation process.
However, I shall momentarily show that the following estimation result is robust to both the lag selection and the inclusion or exclusion of trends.
Table 7 summarizes the estimation result of the cointegrating relationship between growth and finance. The result suggests that there is a long-term stable quadratic relationship between the five-year average growth rate and the private credit to GDP ratio. Note that the estimated coefficients of the level and the square of the ratio of private credit to GDP are positive and negative, respectively, which means that the quadratic relationship actually has the form of an inverse U-shape. That being said, there is a threshold level of private credit as a percentage of GDP such that an expansion of private credit is positively associated with economic growth if the current level of the ratio of private credit to GDP is under the threshold. Otherwise, the expansion of private credit is negatively associated with economic growth. The analysis shows that the estimate of the threshold level is 171.5%. (According to the formula of the quadratic equation, 171.5% is equal to ˆ
1/ 2 ˆ
2, where ˆ
1and ˆ
2are 0.17937 and –0.00052, respectively.) This estimated threshold level exceeds 100%, the level suggested in the literature based on country-panel data. As noted above, the ratio of private credit to GDP was recorded at 193% at the end of 2016; hence, it is substantially higher than the threshold level found in this paper.
Additionally, the estimate of the coefficient of adjustment is negative.
Accordingly, the VECM model is consistent with the hypothesis that there is a stable long-term relationship with a short-term adjustment process.
The estimation result in Table 7 is robust to a number of assumptions with regard to model specifications. First, in the baseline model, I utilized only one lagged difference, as one was what the Akaike information criterion recommended.
However, an inverse U-shaped relationship between growth and finance can still be
found even when 3, 5, 11, or 15 lagged differences were inserted into the model (see
Table A7 in the appendix). Also, in these cases, the threshold level estimates are
approximately 165%, is similar to the rate of 171.5% obtained from the baseline
estimation. Secondly, I include trends in both long-term and short-term relationships
in the baseline model. However, even if I impose restrictions that those trends do
not exist in the two relationships, the estimation result is still close to that in Table 7
(see Table A8 in the appendix). Last but not least, note that the judgment of whether
the population growth is an I(1) or I(0) variable depends on the number of lagged
differences in the fitting model. In the baseline estimations, I consider this as an I(0)
variable. However, the estimation result does not change much even if I regard it as
an I(1) variable, instead, and put this one in the VECM (see Table A9 in the
appendix). It is also important to note that the Johanse test shows that there is a
TABLE 7—ESTIMATION OF A COINTEGRATING RELATIONSHIP:FOCUSED ON THE SIZE OF PRIVATE CREDIT Estimated coefficients Standard error P-value The level of the ratio of private
credit to GDP ˆ1 0.17937*** 0.03388 0.000
The square of the ratio of
private credit to GDP ˆ2 - 0.00052*** 0.00012 0.000
Log of the per capita real GDP 8.51632** 3.83951 0.027
Investment rate -0.31572*** 0.06826 0.000
Coefficient of adjustment -0.02661*** 0.01003 0.008
Sample size 201
The threshold of growth-
finance relationship 171.5%
Note: 1) I consider a VECM with one lagged difference (according to the Akaike information criterion) and trends in both the long-term and short-term relationships, 2) *, **, *** represent the 10%, 5%, 1% level of significance, respectively.
cointegrating relationship among the I(1) variables in most specifications regardless of the lag selection, the inclusion or exclusion of trends, and/or the inclusion or exclusion of the population growth.
Readers may be concerned about the reverse causality problem. That is, it can be argued that financial development does not affect economic growth but, instead, economic growth facilitates the accumulation of financial resources.
If this criticism were valid, a technical problem and a conceptual problem could arise. The technical problem is related to the consistency of the estimator. In a cross- sectional analysis, if the dependent variable causes the independent variable, the independent variable and the error term are correlated and, therefore, the OLS estimator becomes inconsistent regardless of how large the sample size is. However, this inconsistency problem is not an issue in a time-series analysis if there is a cointegrating relationship between the variables of interest. If a cointegration exists, the error term
t(i.e., the level and the square of the private credit to GDP ratio) are non-stationary I(1) variables. Thus, even if the independent variables and the error terms are correlated, this correlation disappears quickly as the sample size increases.
5This econometric property is related to the “super-consistency,” as the rate at which the estimators converge to ‘true’ parameters is much faster compared to that with conventional asymptotics (see Engle and Granger, 1987).
Although the first problem is not an issue in this paper, one may still be concerned about the conceptual problem by which the estimation result could be interpreted such that the cause is economic growth but not financial development. However, such an interpretation does not make sense for the following reasons. First, if the estimation result suggested a positive relationship between growth and finance, this interpretation could make sense to some extent. However, the result suggests an
5If one variable continuously increases (i.e., an I(1) variable), while another variable does not move much but remains mostly at its initial level (i.e., an I(0) variable), the difference between the two variables then becomes infinity as times passes. Even if the two variables are correlated at some initial stage, this correlation will disappear quickly.
inverse U-shaped relationship and, hence, if one puts growth on the horizontal axis and finance on the vertical axis, the relationship is not even a function but a correspondence, which means there is no single theory that explains both the upper side (where growth and finance are negatively associated) and the lower side (where the growth and finance are positively associated) of the correspondence.
Furthermore, it is important to note that the ratio of private credit to GDP is a stock at a quarter ,t whiile the growth rate is a time-average value between the quarter
t and the quarter t 19 and hence, the growth rate contains future information.
Therefore, if the growth rate is a cause, then a future variable affects a past variable.
Readers may also be concerned with the reliability of the methodology used in this paper to examine possible nonlinear relationships between growth and finance.
In this paper, I simply examine a cointegrating relationship among the level and the square of a measure of financial development and the average growth rate. However, a recent development in time-series analysis proposes other methodologies that handle nonlinearities in cointegrating regressions more broadly. See Balke and Fomby (1997), Lütkepohl et al. (1999), and Choi and Saikkonen (2004) for these more advanced methodologies.
C. Why Does the Nonlinear Relationship between Finance and Growth Arise?
The literature suggests a number of theories that explains the nonlinearity between growth and finance. According to the first theory, as financial resources are being accumulated, these resources are less likely to be distributed to sectors with high growth potential, such as the corporate sector, but are more likely to be distributed to sectors with low growth potential, such as the household sector (Hung, 2009; Beck et al., 2012; Hoshi and Kashyap, 2004). According to the second theory, if the financial debt in an economy is sufficiently high, the economy becomes vulnerable to outside shocks. Therefore, it is highly likely to face financial crises, which typically reduce growth rates at least for several years or even a decade (Drechsler et al., 2016; Stiglitz, 2000; Levchenko et al., 2009).
Here, an empirical study focused on the first theory is conducted. Note that cointegration is a long-term “stable” relationship among non-stationary time-series variables. This analytic framework is not suitable for testing the second theory, as the impacts of financial crises on economic growth cannot be stable. Financial crises may have long-term negative effects on growth, as Laeven and Valencia (2012) find.
However, crises are rare events and, hence, the relationship between financial development and economic growth, via the likelihood of a financial crisis, can never be stable.
In the following analysis, I study how the ratio of household credit to private credit affects the cointegrating relationship between the five-year average growth rate and the ratio of private credit to GDP. That is, this study examines whether the composition of the ratio of private credit to GDP matters with regard to the nonlinear relationship between growth and finance.
First, the unit root test suggests that both the ratio of household credit (to private
credit) and the interaction term of this household credit ratio and the ratio of private
credit to GDP are I(1) non-stationary variables (see Table A10 in the appendix for
the details of the test results). In this test, I assume that there is no deterministic trend as, by definition, the household credit ratio cannot exceed 100%.
Secondly, the Johansen test suggests that there exists at least one cointegrating relationship among the average growth rate, the ratio of private credit to GDP, the household credit ratio, the interaction term, the log of the per capita real GDP, and the investment rate. This test result holds in all cases where the selected length of the lagged differences is 1, 3, 7, or 11.
Given these test results, I estimate the VECM model (1), which replaces the square of the ratio of private credit to GDP with the interaction term and adds the household credit ratio as an explanatory variable. The selected lag length is one according to the Akaike information criterion. Other items remain unchanged.
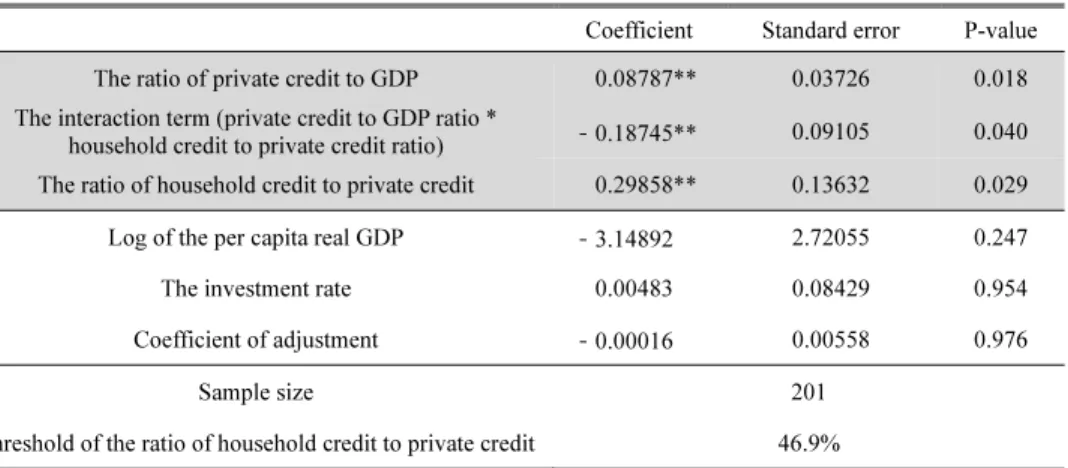
Table 8 shows the estimation result. The coefficients of the ratio of private credit to GDP and the interaction term of the household credit ratio and the ratio of private credit to GDP are positive and negative, respectively. Note also that both coefficients are statistically significant. That is, the amount of the private credit is positively associated with the growth rate, but this effect diminishes as the concentration of private credit in household credit increases. The estimate of the threshold is 46.9%, which indicates that an increase in private credit facilitates economic growth if the share of household credit out of private credit is less than 46.9%; otherwise, an increase in the private credit deters economic growth.
6This result is consistent with the aforementioned first theory and implies that the provision of financial resources is useful for accelerating economic growth only when the resources are provided mostly to the corporate sector rather than to the household sector, all other aspects being equal.
TABLE 8—ESTIMATION OF A COINTEGRATING RELATIONSHIP: FOCUSED ON THE COMPOSITION OF PRIVATE CREDIT
Coefficient Standard error P-value
The ratio of private credit to GDP 0.08787** 0.03726 0.018
The interaction term (private credit to GDP ratio *
household credit to private credit ratio) -0.18745** 0.09105 0.040 The ratio of household credit to private credit 0.29858** 0.13632 0.029
Log of the per capita real GDP -3.14892 2.72055 0.247
The investment rate 0.00483 0.08429 0.954
Coefficient of adjustment -0.00016 0.00558 0.976
Sample size 201
Threshold of the ratio of household credit to private credit 46.9%
Note: 1) I consider a VECM with one lagged difference (according to the Akaike information criterion) without trends in either long-term or short-term relationships., 2) *, **, *** represent the 10%, 5%, 1% level of significance, respectively.
6According to the formula of quadratic equation, 46.9% is equal to the coefficient of the private credit to GDP ratio, divided by the negative of the coefficient of the interaction term, and multiplied by 100.
D. Alternative Models
Hitherto I use the ratio of private credit to GDP to measure the degree of financial development. However, there are several criticisms of this approach. The first is that private credit does not take into account the credit provided to governmental bodies and hence is not a good measure of financial development in countries with large governments. Second, private credit is essentially the total size of loans, which is an example of indirect financing, while economic agents in some advanced economies rely heavily on direct financing tools such as initial public offerings of stocks, bond issuances, crowd-funding, venture capital funding, and so on. Third, it can be argued that a single country’s time-series variables can provide only limited information about the long-run aspects of the finance-growth nexus because the absence of cross- country variation makes it difficult to control for the short-run business cycle. Fourth, one may wonder whether a simple linear relationship between growth and finance exists in the Korean economy.
7Below, I address the concerns raised above. With regard to the first concern, I may consider the total amount of credit, which is the sum of credit given to private agents and governmental bodies. However, the Johansen test does not provide robust evidence of the existence of a cointegrating relationship. This presumably arises because the relevant sample size is only 78. Accordingly, it is not easy to capture statistically any stable relationship between the two variables, particularly with numerous lags and explanatory variables.
Regarding the second concern, I consider the ratio of market capitalization to GDP in order to measure the degree of direct financing. The unit root test results suggest that the level of the ratio of market capitalization to GDP is an I(1) variable, whereas the square of the ratio of market capitalization to GDP is an I(2) variable (see Table A10 in the appendix). Therefore, I consider only this level in the following analysis on cointegration. The Johansen test result suggests that there exists one cointegrating relationship among the growth rate, the ratio of market capitalization to GDP, and other I(1) explanatory variables of interest. See Table 9 for the estimation result. The result suggests that the average growth rate is positively associated with the market capitalization level. Thus, this result implies that an expansion in direct financing could contribute to economic growth. Recall that the inverse U-shaped relationship between growth and the ratio of private credit to GDP implies that an expansion in indirect financing can deter economic growth if the amount of indirect financing exceeds a certain threshold. This divergence in the growth effects of direct financing and indirect financing presumably occurs because the loan market is already well developed quantitatively, while the capital market is comparably less developed.
Related to this, Cournède and Denk (2015) also find that many G20 countries, including Korea, are similar in that their capital markets are not greatly developed quantitatively in comparison to their loan markets.
In response to the third concern, I consider the BIS gap (a percentage of GDP) between the actual level and a trend of private credit, which is a de-trended private-
7Additional criticisms are as follows. First, the private credit measures only the quantitative aspect but not the qualitative aspect of financial development. Second, the private credit is not directly linked to the degree of financial constraints, financial accessibility, or financial inclusion.
TABLE 9—ESTIMATION OF A COINTEGRATING RELATIONSHIPS BASED ON ALTERNATIVE MODELS Model 1
(Market capitalization is considered)
Model 2 (Private credit gap is
considered)
Model 3 (Linear relationship is
considered) The level of market
capitalization to GDP ratio 0.04572***
(0.01485) The level of the BIS credit
to GDP gap -0.98991***
(0.27268) The square of the BIS
credit to GDP gap 0.02059***
(0.00520) The private credit to GDP
ratio 0.06568
(0.04093) Log of the per capita real
GDP 8.4001**
(3.7526) -2.76845***
(0.78431)
35.47317***
(8.62278) The investment rate -0.23884***
(0.0783)
0.15198*
(0.09199) -0.78175***
(0.16422) Coefficient of adjustment 0.03815***
(0.01169) -0.01138**
(0.00493)
0.00277 (0.00463)
Sample size 133 161 201
Note: 1) I assume that Models 1 to 3 equally contain one lagged difference because the Akaike information criterion proposes that one is an optimal lag length in all these models. I also assume that Models 1 and 3 contain trends in the long-term and short-term relationships, whereas Model 2 does not have a trend because the BIS gap is a de- trended variable, 2) *, **, *** represent the 10%, 5%, 1% level of significance, respectively. The levels in parentheses are standard errors.
credit-to-GDP ratio calculated by the Bank of International Settlement in order to examine the possible relationship between growth and finance along the short-run business cycle (or the financial cycle). If there is an inverse U-shaped relationship between growth and this BIS gap, the empirical result implies that the ratio of private credit to GDP when exceeding the estimated threshold level is an early warning signal for an upcoming downturn or a financial crisis. However, the unit root test results suggest that both the level and the square of this BIS credit to GDP gap is an I(0) variable (see Table A10 in the appendix).
8Therefore, it is difficult to believe that there is any cointegrating relationships between the average growth rate, the level and the square of this gap, and other explanatory variables. The Johansen test result also suggests that there is no cointegration among these variables. Perhaps there may be some important relationships between growth and this BIS credit to GDP gap. However, these relationships are not easily studied in a cointegration framework. Nevertheless, I estimate a cointegrating relationship in Table 9. The estimation result suggests that there is a (not inverse) U-shaped relationship between this gap and the average economic growth, as the coefficients of the level and the square of this gap are negative and positive, respectively. This result implies that economic growth accelerates if the de-trended ratio of private credit to GDP exceeds
8The BIS gap between the private credit level and a trend has negative levels at some points during the sample period. Therefore, if I take the square of this gap, then the square may provide misleading information about the relationship between this gap and economic growth. Thus, I generate a new time-series variable, referred to as gap30, by adding a constant of 30 uniformly to each level of the gap. Therefore, this new variable has a positive level for the entire sample period. Then, I take the square of gap30. The unit root test, the Johansen test, and the estimation of the cointegrating relationships are all based on the square of gap30.