Ⅰ. INTRODUCTION
agnetic resonance electrical impedance tomography (MREIT) is a new bio-imaging method providing a high-resolution conductivity image of an electrically conducting object [1-5]. We probe the imaging object by injecting a low-frequency electrical current through a pair of electrodes.
It induces internal distributions of current density J and magnetic flux density B = ( , , ), which are determined by the unknown conductivity distribution of the object. We can measure inside the imaging object by using an MRI scanner with its main magnetic field where is the unit vector along the z-direction [4]. Measured data subject to multiple injection currents are obtained from MR phase images and utilized in an image reconstruction algorithm to produce a cross-sectional conductivity image.
The procedure to extract images from measured k-space data implicitly assumes that spin isochromats precess at the
Larmor frequency of water. It does not hold in a fatty region, where the precession frequency differs by 3.5 ppm (440 Hz at 3T MRI scanner) [6]. Around a fatty region, a certain number of pixels are shifted depending on the bandwidth per pixel and
. This results in MR signal void in one region and improper signal overlap in the other region. Signal void and overlap produce spurious noise and artifact, respectively, in MR phase images and these are transferred to the reconstructed conduct- ivity image through images.
When MR magnitude images are of primary concern, three different techniques are commonly used to deal with the chemical shift problem. The first is to confine the shift within one pixel by increasing the bandwidth per pixel. It is not desirable in MREIT due to a reduced signal-to-noise ratio (SNR). The second is to suppress the fat signal. We should avoid using it in MREIT due to a reduced overall SNR and loss of phase information in the fatty region. The third is to separate fat signals from water signals. Since the water-fat separation offers a better option in terms of SNR, we chose it to deal with the chemical shift problem in MREIT.
The fat separation can be performed by using the Dixon method [7,8]. In a typical Dixon technique, multiple data are acquired with an extra delay in echo time (TE). It introduces a phase shift between water and fat signals, which enables us to
Chemical Shift Artifact Correction in MREIT
Atul S. Minhas, Young Tae Kim, Woo Chul Jeong, Hyung Joong Kim, Soo Yeol Lee and Eung Je Woo College of Electronics and Information, Kyung Hee University, Korea
(Received October 21, 2009. Accepted December 10, 2009)
Magnetic resonance electrical impedance tomography (MREIT) enables us to perform high-resolution conductivity imaging of an electrically conducting object. Injecting low-frequency current through a pair of surface electrodes, we measure an induced magnetic flux density using an MRI scanner and this requires a sophisticated MR phase imaging method. Applying a conductivity image reconstruction algorithm to measured magnetic flux density data subject to multiple injection currents, we can produce multi-slice cross-sectional conductivity images. When there exists a local region of fat, the well-known chemical shift phenomenon produces misalignments of pixels in MR images. This may result in artifacts in magnetic flux density image and consequently in conductivity image. In this paper, we investigate chemical shift artifact correction in MREIT based on the well-known three-point Dixon technique. The major difference is in the fact that we must focus on the phase image in MREIT. Using three Dixon data sets, we explain how to calculate a magnetic flux density image without chemical shift artifact. We test the correction method through imaging experiments of a cheese phantom and postmortem canine head. Experimental results clearly show that the method effectively eliminates artifacts related with the chemical shift phenomenon in a reconstructed conductivity image.
magnetic resonance electrical impedance tomography, magnetic flux density, chemical shift artifact, Dixon technique, conductivity image
M
Corresponding Author : Eung Je Woo
Department of Biomedical Engineering, College of Electronics and Information, Kyung Hee Univ.
1 Seochun, Giheung, Yongin, Gyeonggi, 446-701, Korea Tel : +82-31-201-2538 / Fax : +82-31-201-2378 E-mail : [email protected]
This work was supported by the Korea Science and Engineering Foundation (KOSEF) grant funded by the Korea government (MEST) (R11-2002-103).
separate water and fat images. The original method proposed by Dixon used two such data acquisitions with water-fat phase shifts of and [7,9]. In the presence of a field inhomogeneity, the three-point Dixon method should be used to compensate for the phase error due to the field inhomogeneity [10,11].
Three data sets are acquired in a form of either (0,, ) and (0,,). We can implement it in the conventional spin echo or gradient echo pulse sequence. Variations of the Dixon method have been proposed for fast imaging sequences [12-15]. A novel postprocessing technique based on the iterative least-square method was also proposed to enhance SNR [16].
For the present MREIT technique where spin-echo type pulse sequences are predominant [5,17], the three-point Dixon method with phase shifts of (0,, ) appears to be sufficient.
For a given total number of signal averages, we can split them into three scans with three different phase shifts. In MREIT, for a given pair of electrodes, we inject currents twice with the same amplitude but opposite polarities to cancel out any systematic phase error in a image. This requires additional steps in the chemical shift artifact correction. In this paper, we briefly describe a mathematical derivation of the data extraction from the three Dixon data sets, in the context of spin-echo pulse sequence used in MREIT. For the validation of the proposed method, we will discuss imaging experiments of a cheese phantom and postmortem canine head.
Ⅱ. METHODS
A. Magnetic flux density imaging in the presence of fat We assume an imaging object containing a fatty region.
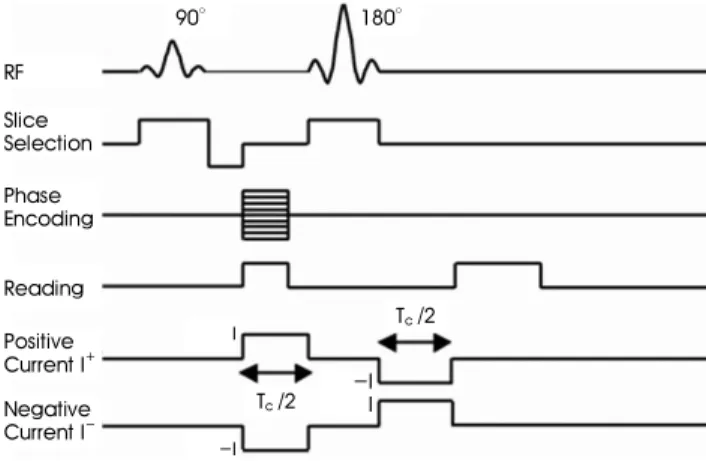
Placing the object inside the MRI scanner with its main magnetic field , we inject current I as shown in
figure 1. We try to measure the z-component of the induced magnetic flux density, , inside a chosen imaging slice. The injection current generates extra inhomogeneity of the main magnetic field and this alters the MR phase image in such a way that the phase change is proportional to .
Given a read gradient in the x-direction, water and fat frequencies, and , respectively, are expressed as
(1)
(2)
where is the gyromagnetic ratio of the hydrogen and
is 3.5 ppm of . The phase accumulated by water protons at time t is given by
(3)
where
is a spatial frequency. The phase accumulated by fat protons at time t is given by
′(4)
where ′
is a given constant indicating the pixel shift.
Let and be the proton densities of the water and fat, respectively. The k-space signal is assumed to be a linear combination of water and fat signals. Using the positive and negative injection currents ±shown in figure 1, we can obtain the following k-space signals ±, respectively:
±
±
± ′ (5)
where is any systematic phase error and is the current injection pulse width. Through the change of variable
′ in the second term, we get,
±
±
′ ′ ± ′ (6)
RF Slice Selection
Phase Encoding
Positive Current I+ Negative Current I- Reading
90° 180°
Tc/2
Tc/2 -I I I
-I
Fig. 1. Typical spin echo pulse sequence for MREIT.
Taking inverse Fourier transform, we obtain two complex MR images of,
±
±
′ ′ ± ′
(7)
The magnetic flux density is embedded in phase parts of
± . If there is no chemical shift, that is, ′ , we may extract from
(8)
When ′ ≠ , (8) fails to provide the phase information accurately due to shifting of pixels. In such a case, separation of water and fat signals is necessary to estimate the phase accurately.
B. Separation of water and fat signals
We collect k-space data three times with three different delays of the 180° RF pulse by ms, producing phase shifts of respectively. Assuming that ′ is moderate (i.e. the readout gradient is not too slow) and the field is smoothly varying, there may occur additional phase shifts common to both water and fat signals.
We denote them as for ms, respectively [7]. We may express k-space signals ± and ± for and , respectively, as
±
±
′ ′ ± ′ (9) and±
±
′ ′ ± ′ (10)Taking inverse Fourier transforms of (9) and (10), we get
±
±
′ ′ ± ′
(11)
and
±
±
′ ′ ± ′
(12)
Using (11) and (12), we get
(13)We now estimate from by carefully choosing a proper sign of . Improper sign selection will interchange water and fat signals in separated images. One solution is to unwrap the wrapped phase in (13), divide the unwrapped phase by 2, and then wrap it again by calculating [9]. Using the estimated , we eliminate it from (11) and (12) to get
±
±
′ ′ ± ′
(14)
and
±
±
′ ′ ± ′
(15)
From (7), (14) and (15), we can separate water and fat signals as,
±
± ± ± (16)
and
′ ′ ± ′
± ± ± (17)
C. Correction of pixel shift Since ′
is a known value, and can also be found experimentally, we correct the pixel shift in (17) to finally get
± ± (18)
This allows us to compute the image using (8) with in place of . We can also easily obtain magnitude images of
and with all pixels correctly placed.
D. Imaging experiment and conductivity image reconstruction
We conducted MREIT experiments of a gelatin-TX151 -cheese phantom and postmortem canine head. Four surface electrodes were attached around the imaging object. For the postmortem animal experiment, we followed the experimental protocol approved by the Institutional Animal Care and Use Committee (IACUC) [18]. Using our 3T MRI scanner (Medinus, Korea), we collected k-space data three times with three different delays of the refocussing RF pulse. Table 1 summarizes several imaging parameters. Water and fat images were obtained using the method described in section B. images for the horizontal and vertical current injections were
computed after correcting the pixel shift as described in section C. Conductivity images were reconstructed using the single-step harmonic algorithm [19-21], which is implemented in the recently developed conductivity image reconstruction software for MREIT [22]. Reconstructed conductivity images presented in this paper provide contrast information only.
Ⅲ. RESULTS
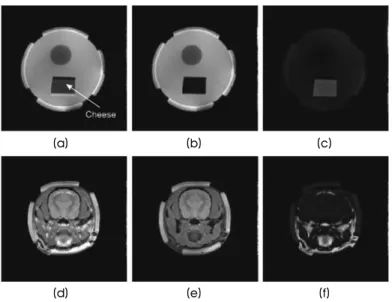
Figure 2(a) is the MR magnitude image of the phantom before correction, where we can observe shifting of pixels in the vertical direction around the fatty region. Separated water and fat images are shown in (b) and (c), respectively. Figure 2(d), (e) and (f) are the images from the postmortem canine head.
In figure 3(a), we marked MR signal void and overlap due to the chemical shift using arrows. Uncorrected images subject to the horizontal and vertical current injections are shown in (b) and (c), respectively. We can observe that both
Parameters Gelatin-TX151-cheese phantom Postmortem canine head
Sampling time (㎲) 24 36
Current amplitude (mA) 30 26
Current injection time (ms) 23 21.5
TR/TE (ms) 1000 / 30 1200 / 30
FOV (mm) 200×200 180×180
Pixel size (mm) 1.56 1.41
Table 1. Imaging parameters for the gelatin-TX151-cheese phantom and postmortem canine head experiments.
(a) (b) (c)
(d) (e) (f)
Fig. 2. (a), (b) and (c) are the uncorrected MR magnitude, separated water and fat images, respectively, from the gelatin-TX151-cheese phantom. (d), (e) and (f) are images from the postmortem canine head.
images contain spurious noise in the region of signal void.
Though the effect is not visible, we should presume that both
images contain artifact in the region of signal overlap.
Applying the correction method and shifting fat images by 2
pixels, we could obtain the images in (d), (e) and (f) where the problem is clearly resolved. Figure 4 shows the similar results from the postmortem canine head. For the canine head case, we shifted fat images by 3 pixels.
(a) (b) (c)
(d) (e) (f)
Fig. 3. (a) is the uncorrected MR magnitude image of the phantom. (b) and (c) are uncorrected images subject to the horizontal and vertical current injections, respectively. In (a), (b) and (c), images inside the rectangles are magnified by three times and shown in the second row. (d), (e) and (f) are images after the correction.
(a) (b) (c)
(d) (e) (f)
Fig. 4. (a) is the uncorrected MR magnitude image of the postmortem canine head. (b) and (c) are uncorrected images subject to the horizontal and vertical current injections, respectively. (d), (e) and (f) are images after the correction.
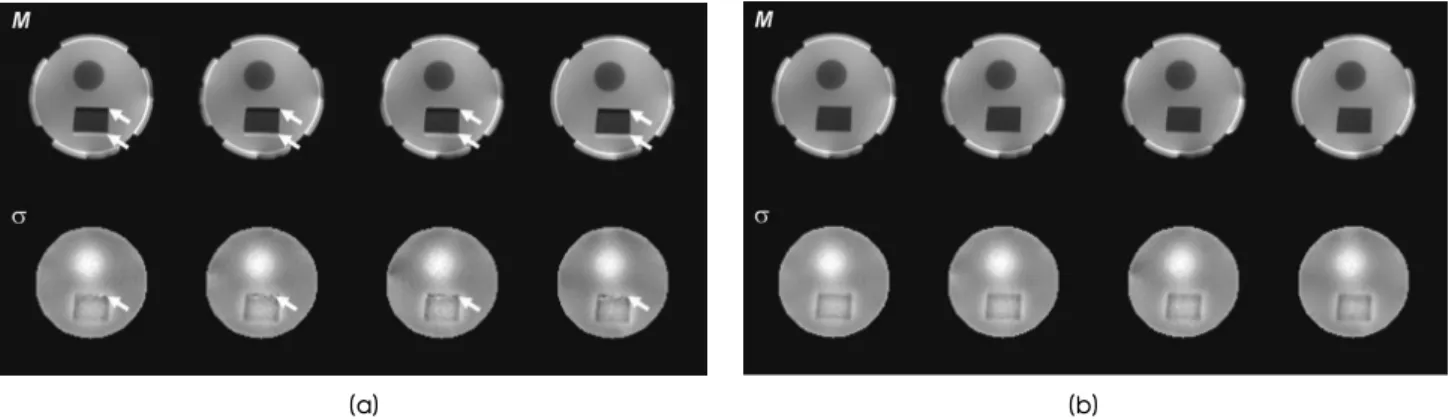
Figure 5(a) and (b) show the multi-slice MR magnitude ( ) and conductivity images () from the gelatin-TX151- cheese phantom before and after applying the correction method, respectively. They illustrate that the chemical shift phenomenon results in spurious noise in conductivity images inside the region of signal void since random phase noise comes out in the absence of the signal. The correction method significantly improves the image quality in the region of signal void. In the region of signal overlap, we must have phase errors since overlapped water and fat signals make wrong phase changes depending on relative signal strengths.
Nevertheless, the phase errors in the overlapping region are less prominent. We could get similar results from the canine head case shown in figure 6.
Ⅳ. DISCUSSION AND CONCLUSION
When there exists a fatty region in a chosen imaging slice, its conductivity image suffers from MR signal void and overlap due to the chemical shift phenomenon. We could
successfully implement a chemical shift artifact correction together with the magnetic flux density imaging method in MREIT. Experimental results show that it improves the quality of a reconstructed conductivity image.
Though we implicitly assumed that the chemical shift occurs only in the frequency-encoding direction, it may also occur in the slice selection direction (z-direction in our case).
During conductivity image reconstructions, we need to compute the three-dimensional Laplacian of the measured data [22]. However, we expect that the chemical shift in the z-direction has a negligible effect since the slice thickness is at least 3 mm in most MREIT studies. For the cases where the slice thickness is comparable to the pixel size, we should investigate ways to correct any pixel shift along the z-direction.
The amount of phase change due to the main magnetic field inhomogeneity affects how well water and fat images are separated. Without a proper shimming, some water signals may remain in a fat image inseparable and vice-versa.
Switching of water and fat images may also happen in a few slices. We recommend a careful shimming prior to any scan.
(a) (b)
Fig. 6. (a) Multi-slice MR magnitude and conductivity images of the canine head in the top and bottom rows, respectively, before applying the chemical shift artifact correction. (b) are images after the correction.
(a) (b)
Fig. 5. (a) Multi-slice MR magnitude and conductivity images of the phantom in the top and bottom rows, respectively, before applying the chemical shift artifact correction. (b) are images after the correction. Reconstructed conductivity values are not constant across anomalies due to the diffusion of ions between anomalies and the background medium over time.
Glover and Schneider (1991) suggested a method to automatically determine the sign in (16) and (17) to prevent fat and water images from being switched. Instead of using phase shifts of (0,, ), one may also use (,, ) with to prevent pixel-switching by avoiding the phase unwrapping step[12-15].
In our correction method, we kept the total scan time same as that of a conventional MREIT scan. We equally divided the total number of scans used for signal averaging among three Dixon scans. We found that the SNR of the corrected MR magnitude image was reduced to 80 to 95% of the uncorrected image as analyzed by Glover and Schneider (1991). Since the noise level in a image is inversely proportional to the SNR of the MR magnitude image [23,24], we plan to investigate a newer Dixon data acquisition method using phase shifts of (
) with [12-15], which requires a different data processing scheme such as an iterative least square method [16]. In our future work, we plan to undertake a detailed quantitative analysis of the proposed chemical shift artifact correction method in terms of the noise level in image. A comparison of various modifications of the Dixon technique in the context of MREIT is necessary to choose a proper data sampling technique and data processing algorithm.
Lately, Hamamura et al. [25] and Minhas et al. [26]
proposed similar methods to deal with chemical shift artifacts in MREIT. Hamamura et al. [25] used three Dixon data sets with positive current injections only. As the fourth data set, they acquired data in the conventional way without any shifting of 1800 RF pulse. The extraction procedure from these four data sets is thus different from the one explained in this paper. Our approach in this paper demonstrated that just three Dixon data acquisitions are sufficient to extract the corrected data. Details of the correction method presented in this paper will fill any gap in the short papers by Hamamura et al. [25] and Minhas et al. [26] that may hinder complete understanding of the method.
The proposed correction method will be beneficial to animal and human imaging experiments. We plan to incorporate the developed chemical shift artifact correction method in the recently developed MREIT software package [22]. We plan to conduct in vivo imaging experiments using animals of different disease models.
REFERENCES
[1] N. Zhang, Electrical Impedance Tomography based on Current Density Imaging, Toronto, Canada: MS Thesis, Dept. of Elec.
Eng, 1992.
[2] E.J. Woo, S.Y. Lee, and C.W. Mun, “Impedance tomography
using internal current density distribution measured by nuclear magnetic resonance”, SPIE, vol. 2299, pp. 377-385, 1994.
[3] O. Birgul and Y. Z. Ider, “Use of the magnetic field generated by the internal distribution of injected currents for electrical impedance tomography”, Proc. IXth Int. Conf. Elec. Bio-Impedance Heidelberg Germany, pp. 418-419, 1995.
[4] E.J. Woo and J.K. Seo, “Magnetic resonance electrical impedance tomography (MREIT) for high-resolution conductivity imaging”, Physiol. Meas., vol. 29, pp. R1-R26, 2008.
[5] G.C. Scott, M.L.G. Joy, R.L. Armstrong, and R.M. Henkelman,
“Measurement of nonuniform current density by magnetic resonance”, IEEE Trans. Med. Imag., vol. 10, pp. 362-374, 1991.
[6] E.M. Haacke, R.W. Brown, M.R. Thompson, and R. Venkatesan, Magnetic Resonance Imaging: Physical Principles and Sequence Design, John Wiley and Sons Inc., 1999.
[7] W. H. Dixon, “Simple proton spectroscopic imaging”, Radiology, vol. 153, pp. 189-194, 1984.
[8] J. Ma, “Dixon techniques for water and fat imaging”, Mag. Res.
Med., vol. 28, pp. 543-558, 2008.
[9] B.D. Coombs, J. Szumowski, and W. Coshow, “Two-point Dixon technique for water-fat signal decomposition with inhomogeneity correction”, Mag. Res. Med., vol. 38, pp. 884-889, 1997.
[10] C.C. Lodes, J.P. Felmlee, R.L. Ehman, C.M. Sehgal, J.F.
Greenleaf, G.H. Glover, and J.E. Gray, “Proton MR chemical shift imaging using double and triple phase contrast acquisition methods”, J. Comp. Ass. Tomo., vol. 13, no. 5, pp. 855-861, 1989.
[11] G. H. Glover and E. Schneider, “Three-point Dixon technique for true water/fat decomposition with inhomogeneity correction”, Mag. Res. Med., vol. 18, pp. 371-383, 1991.
[12] P.A. Hardy, R. S. Hinks, and J. A. Tkach, “Separation of fat and water in fast spin-echo MR imaging with the three-point Dixon technique”, J. Mag. Reson. Imaging, vol. 5, pp. 181-185, 1995.
[13] Q.S. Xiang and L. An, “Water-fat imaging with direct phase encoding”, J. Mag. Reson. Imaging, vol. 7, pp. 1002-1015, 1997.
[14] J. Ma, S.K. Singh, A.J. Kumar, N.E. Leeds, and L.D. Broemeling,
“Method of efficient fast spin-echo Dixon imaging”, Mag. Res.
Med., vol. 48, pp. 1021-1027, 2002.
[15] A.R. Pineda, S.B. Reeder, Z. Wen, and N.J. Pelc, “Cramaer-Rao bounds for three-point decomposition of water and fat”, Mag.
Res. Med., vol. 54, pp. 625-635, 2005.
[16] S.B. Reeder, Z. Wen, H. Yu, A.R. Pineda, G.E. Gold, M. Markl, and N.J. Pelc, “Multi-coil Dixon chemical species separation with an iterative least-squares estimation method”, Mag. Res. Med., vol. 51, pp. 35-45, 2004.
[17] C. Park, B.I. Lee, O. Kwon, and E.J. Woo, “Measurement of induced magnetic flux density using injection current nonlinear encoding (ICNE) in MREIT”, Physiol. Meas., vol. 28, pp.
117-127, 2007.
[18] H.J. Kim, B.I. Lee, Y. Cho, Y.T. Kim, B.T. Kang, H.M. Park, S.Y.
Lee, J.K. Seo, and E.J. Woo, “Conductivity imaging of canine brain using a 3 T MREIT system: postmortem experiments”, Physiol. Meas., vol. 28, pp. 1341-1353, 2007.
[19] J.K. Seo, J.R. Yoon, E.J. Woo, and O. Kwon, “Reconstruction of conductivity and current density images using only one component of magnetic field measurements”, IEEE Trans.
Biomed. Eng., vol. 50, pp. 1121-1124, 2003.
[20] S.H. Oh, B.I. Lee, E.J. Woo, S.Y. Lee, M.H. Cho, O. Kwon, and J.K. Seo, “Conductivity and current density image reconstruction using harmonic Bz algorithm in magnetic resonance electrical impedance tomography”, Phys. Med. Biol., vol. 48, pp. 3101- 3116, 2003.
[21] J.K. Seo, S.W. Kim, S. Kim, J. J. Liu, E.J. Woo, K. Jeon, and C-O Lee, “Local harmonic Bz algorithm with domain decomposition in MREIT: computer simulation study”, IEEE Trans. Med. Imag., vol. 27 (12), pp. 1754-1761, 2008.
[22] K. Jeon, H.J. Kim, C-O Lee, E.J. Woo, and J.K. Seo, “CoReHA:
conductivity reconstructor using harmonic algorithms for magnetic resonance electrical impedance tomography (MREIT)”, J. Biomed. Eng. Res., 2009.
[23] G.C. Scott, M.L.G. Joy, R.L. Armstrong, and R.M. Henkelman,
“Sensitivity of magnetic-resonance current density imaging”, J.
Mag. Res., vol. 97, pp. 235-254, 1992.
[24] R. Sadleir, S. Grant, S.U. Zhang, B.I. Lee, H.C. Pyo, S.H. Oh, C.
Park, E.J. Woo, S.Y. Lee, O. Kwon, and J. K. Seo, “Noise analysis in magnetic resonance electrical impedance tomography at 3 and 11 T field strengths”, Physiol. Meas., vol. 26, pp. 875-884, 2005.
[25] M.J. Hamamura, O. Nalcioglu, and L.T. Muftuler, “Correction of chemical shift artifact in magnetic resonance electrical impedance tomography”, Proc. Intl. Soc. Mag. Reson. Med.
Conf., Honolulu, Hawai, USA, 17, pp. 4658, April 18-24, 2009.
[26] A.S. Minhas, H.J. Kim, Y.T. Kim, W.C. Jeong, T.H. Lee, E.J.
Woo, and S.Y. Lee, “Chemical shift artifact correction in MREIT using 3-point Dixon technique”, Proc. 10th Conf. EIT (Manchester, UK), June 16-19, 2009.