Progress in Superconductivity and Cryogenics
Vol.15, No.2, (2013), pp.48~51 http://dx.doi.org/10.9714/psac.2013.15.2.048
```
1. INTRODUCTION
The occurrence of thermal contact resistance (TCR) has a great influence on the cryogenic systems. The TCR occurs at the interface between metals and it can be affected by various factors, such as roughness of surface, contact area, contact pressure and temperature. The cryogenic measurement devices using a cryocooler are affected by TCR because the device is consisted of several metal components in contact with each other for heat transferring to the test specimen without cryogen.
Therefore, accurate measurement and estimation of TCR of various metallic materials is necessary for the design and thermal optimization of cryogenic measurement devices using cryocoolers.
In general, the measurement methods of TCR can be divided into steady state method [1] and transient state method [2]. In the study of Bi et al. [3], the stainless steel, copper, and AIN (Aluminum Nitride) are used as specimen and LPM (laser photothermal method) which is one of the transient methods was employed to measure the TCR. The TCR of glassy carbon was measured by laser flash method in the study of Baba et al. [4]. If the TCR was measured by the transient method, the experiment can complete in a shorter time than steady state method but controlling heat load is difficult and measurement is less accurate than steady state method.
In case of Yu's study [5], the TCR of Cu/Cu and Cu/Si were measured in the temperature range of 85 - 300 K, using liquid nitrogen as cryogen. Also, the TCR of aluminum and stainless steel was measured in the temperature range of 155 - 210 K and liquid nitrogen was
used in the Xu’s experiment [6]. Many TCR studies have been carried out at liquid nitrogen or near room temperature [4-7].
In this study, we have designed the TCR measurement system using steady state method for more accurate measurement at temperature below 100 K. A cryocooler used as a heat sink instead of cryogen, so we can obtain wider temperature range. Also, the contact pressure was controlled to investigate the effect of the pressure on the mating surface and similar measurement is capable of conducting by switching test specimen. The design and structure of the TCR measurement system is presented. In addition, the influences of temperature, contact pressure and interfacial material on the TCR are presented.
2. EXPERIMENTS
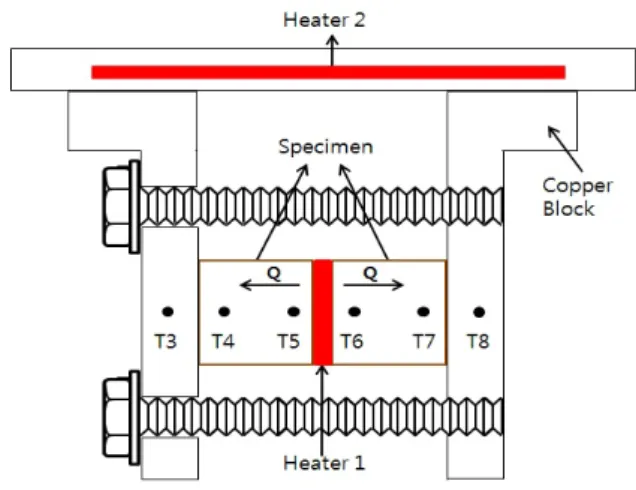
The schematic diagram of thermal contact resistance measurement system is shown in Fig. 1. A cryocooler is mounted directly at the top plate of a vacuum vessel and used as a heat sink. The first stage cold head, copper block and specimen are thermally connected each other through the metal thermal link. In order to eliminate unwanted heat load from the outer vacuum vessel to the specimens, two radiation shields with MLI (Multiple layer insulation) and thermal anchor of instrumental wires are employed in this system. A vacuum NW flange is located on the side of a vacuum vessel for pump connection. In addition, a number of vacuum connectors are installed on the top plate of a vacuum vessel for temperature measurement, heater control and data acquisition. Eight temperature sensors are installed in the system as indicated in Fig. 1 and Fig. 2. T1
Measurement of thermal contact resistance at Cu-Cu interface
Myung Su Kim and Yeon Suk Choi
*Korea Basic Science Institute, Daejeon, Korea
(Received 20 May 2013; revised or reviewed 25 June 2013; accepted 26 June 2013)
Abstract
The thermal contact resistance (TCR) is one of the important components in the cryogenic systems. Especially, cryogenic measurement devices using a cryocooler can be affected by TCR because the systems have to consist of several metal components in contact with each other for heat transferring to the specimen without cryogen. Therefore, accurate measurement and understanding of TCR is necessary for the design of cryogenic measurement device using a cryocooler. The TCR occurs at the interface between metals and it can be affected by variable factors, such as roughness of metal surface, contact area and contact pressure. In this study, we designed TCR measurement system at various temperatures using a cryocooler as a heat sink and used steady state method to measure the TCR between metals. The copper is selected as a specimen in the experiment because it is widely used as a heat transfer medium in the cryogenic measurement devices. The TCR between Cu and Cu is measured for various temperatures and contact pressures. The effect of the interfacial materials on the TCR is also investigated.
Keywords : Thermal contact resistance, contact pressure, interface material
* Corresponding author: [email protected]
Myung Su Kim and Yeon Suk Choi
Fig. 1. Schematic of thermal contact resistance measurem ent system.
Fig. 2. Drawing of copper block and specimen.
and T2 sensors are located at the first stage cold head of cryocooler and the bottom plate of second thermal shield, respectively. The T3 - T8 sensors are installed at the copper block and specimens for measuring temperature distribution, as shown in Fig. 2.
The copper block is located at the both side of the test specimen and the contact pressure was controlled by two screw bolts and toque wrench. The contact pressure calculated using Ref. [8]. The test specimen was processed by lathe machine. The surface of test specimen was polished and its surface roughness was in the order of about 1.65 μm. The test specimen and copper block have six holes of 1.8 mm diameter and 6 mm deep for temperature sensor installation. The temperature sensors are embedded in a hole using varnish (GE-7031) for accurate temperature measurement. The test specimen was thoroughly cleared with ethanol to remove impurities before assembling. While the heater 1 was installed between test specimens for supplying heat, the heater 2 was installed at the thermal adapter for controlling of system temperature. The specifications of test specimen, heater 1 and temperature sensor are summarized in Table 1.
The nichrome wire which has a high resistance value was used as a heater. The heater 1 generating temperature
TABLE I
S
PECIFICATION OF TEST SAMPLE,
HEATER AND TEMPERATURE SENSOR.
Part Parameter Unit Value
Test specimen material - copper
diameter mm 10
length mm 10
contact area m
27.85ⅹ10
-5Heater 1 material - nichrome
length mm 70
resistance Ω 2.4
Temperature
Sensor model - PT100
current A 0.001
resistance Ω 3.65 @ 30 K
Fig. 3. Photo of specimen and copper block.
gradient across the interface was controlled by a DC power supply (EXTECH instruments 382202) and the heat load was controlled from 0 to 1 W at intervals of 0.2 W. The heater 2 was controlled using a DC power supply (Agilent Technologies N5772A) to raise the system temperature up to 100 K. Variables in the present experiment are the temperature, contact pressure and type of interfacial materials.
Fig. 3 shows the photo of assembled test specimen, copper block, heater and temperature sensors. The manganin wire which has a low thermal conductivity was used as a instrumental wire. Although manganin wire has a low thermal conductivity, there are many wires for temperature sensors and data acquisition. So, in order to reduce the heat invasion into the test specimen, wires of temperature sensor are thermally anchored at the top plate of copper block as shown in Fig. 3.
Fig. 4 shows the whole experimental set-up of TCR measurement system. The temperature of the first stage cold head of a cryocooler, radiation shield, specimen and copper block are measured and monitored continuously.
The experimental results were saved automatically every 30 sec through the GPIB communication module of Labview
TMsoftware.
49
Measurement of thermal contact resistance at Cu-Cu interface
Fig. 4. Photo of experimental set-up and data acquisition system.
Fig. 5. Initial cool-down curve of thermal contact resistance measurement system (contact pressure : 7 MPa).
3. RESULTS AND DISCUSSION
In order to prevent heat leak by residual gas during the experiment, the vessel was evacuated to a pressure of ~10
-6Torr. The temperature history of T1 – T4 during initial cool-down is shown in Fig. 5. It took approximately 6 hours for the test specimen to reach lowest temperature.
Fig. 6 shows the temperature profile of specimen and copper block depending on the heat load of heater 1 and heater 2. Firstly, when the system cooled to lowest temperature, the heat load of heater 1 (Q1) was controlled from 0 to 1.0 W at intervals of 0.2 W. Secondly, heater 1 was turned off and then the temperature of test system was controlled by heater 2 to raise the temperature to reach for next test. Thirdly, the process was repeated again after the temperature of system reaches steady state. We assumed that the steady state was obtained when the time rate of change was less than 5 mK/min. As shown in Fig. 6, the temperature difference between copper block and specimen was within 10 mK at the lowest temperature. But as Q1 increases, temperature difference increases. The temperatures of left side specimen are symmetric with those of right side for the whole experiment.
The thermal contact resistance is calculated by the corrected temperatures and the power delivered to the heater and is defined by the following equation [9].
Fig. 6. Temperature profile of specimen and copper block.
Fig. 7. Thermal contact resistance with respect to temperature as a function of contact pressure.
( )
Heating L H
Q
T T TCR D ⋅ −
=
2