DOI: 10.5532/KJAFM.2010.12.4.289
ⓒ Author(s) 2010. CC Attribution 3.0 License.
설마천유역 혼효림에서 실측된 증발산과 토양수분을 이용한 SWAT모형의 적용성 평가
조형경·이지완·신형진·박근애·김성준 건국대학교사회환경시스템공학과
/
지구정보공학연구실(2010
년8
월30
일접수; 2010
년9
월27
일수정; 2010
년10
월20
일수락)
Evaluation of Evapotranspiration and Soil Moisture of SWAT Simulation for Mixed Forest in the Seolmacheon Catchment
Hyung Kyung Joh, Ji wan Lee, Hyung Jin Shin, Geun Ae Park and Seong Joon Kim
Department of Civil and Environmental System Engineering/Earth Information Engineering Laboratory, Konkuk University, Hwayang dong, Gwangjin-gu, Seoul 143-701, Korea
(Received August 30, 2010, Revised September 27, 2010; Accepted October 20, 2010) ABSTRACT
Common practice of Soil Water Assessment Tool (SWAT) model validation is to use a single variable (i.e., streamlfow) to calibrate SWAT model due to the paucity of actual hydrological measurement data in Korea. This approach, however, often causes errors in the simulated results because of numerous sources of uncertainty and complexity of SWAT model. We employed multi-variables (i.e., streamflow, evapotranspiration, and soil moisture), which were measured at mixed forest in Seolmacheon catchment (8.54 km
2), in order to assess the performance and reduce the uncertainties of SWAT model output. Meteorological and surface topographical data of the catchment were obtained as basic input variables and SWAT model was calibrated using daily data of streamflow (Jan. – Dec.), evapotranspiration (Sep. – Dec.), and soil moisture (Jun. – Dec.) collected in 2007. The model performance was assessed by comparing its results with the observation (i.e., streamflow of 2003 to 2008 and evapotranspiration and soil moisture of 2008). When the multi-variable measurements were used to calibrate the SWAT model, the model results showed better agreement with the measurements compared to those using a single variable measurement by showing increases in coefficient of determination (
R2) from 0.72 to 0.76 for streamflow, from 0.49 to 0.59 for soil moisture, and from 0.52 to 0.59 for evapotranspiration. The findings highlight the importance of reliable and accurate collective observation data for improving performance of SWAT model and promote its facilitation for estimating more realistic hydrological cycles at catchment scale.
Key words
: Evapotranspiration, SWAT, Uncertainty, Evaluation
I. 서 론
수문성분의 물리적인 움직임을 모의하는데 있어 수 문모형은 주어진 입력자료에 영향을 받은 출력자료를
생성하게 된다. 이때 모의된 결과를 실측자료와 비교 하여 수문모형의 정확도를 검증하는 과정이 반드시 필 요하게 되는데, 모형의 입력자료, 결과 비교를 위한 실측자료의 오차 및 최적화 되지 않은 모수 또는 수문
* Corresponding Author : Seong Joon Kim
([email protected])
모형자체의왜곡등으로인하여불확실성은필연적으로 발생하게 된다
.
일반적인 수문모형의보정과정 중에는최적화되지않은모수에의한오차만을최소화시킬수 있으며
(Refsgaard and Storm, 1996),
이러한모수를실측자료에근거하여보정함으로써수문모형의적정성을 검토하고신뢰성있는수문분석결과를얻으려고한다
(Jang, 2003). SWAT(Soil and Water Assessment Tool)
모형을이용한선행연구에서도실측자료와의비교를통 한 보정과정은 필수적으로 포함 되었으나
,
대부분의 경우실측된유출량만을이용해모수를조율하여불확 실성 및오차를 다루어 왔다(Arnold and Allen, 1996;
Manguerra and Engel, 1998; Peterson and Hamleet, 1998; Sophocleous
et al., 1999).
그러나불확실성의무수하고복잡한원인을고려해 본다면이러한유출량만을이용한보정은한계가있을 것이며
(Bastidas
et al., 2003; Seibert and McDonnell,
2003),
모형의불확실성을효과적으로줄이기위해서는추가적인실측자료와의비교를통한보정과정이필요 하다
(Ambroise
et al., 1995; Refsgaard, 1997; Kuczera and Mroczkowski, 1998; Bastidas
et al., 2003; Seibert
and McDonnell, 2003).
이러한 이유로 근래에 와서는
,
유출량만을이용한보정과함께다른 추가자료를이용한보정에대한 연구가이루어졌다
.
국내에서는Hong
et al.(2009)
은 충주댐유역을 대상으로 하여NDVI
와토양수분의상관성분석을통하여SWAT
모형 의모의시빈약한토양수분의실측자료를보완하고자 하였다. Jung
et al.(2009)
은외남천유역을 대상으로실측된유출량및영양물질자료를이용하여
SWAT
모형의 영향물질 부하 추정능력을 평가하였으며
, Kim
et al
.(2006)
은실측된유출량과지하수위자료를이용하여
SWAT-MODFLOW
모형을경안천유역에적용함으로써 평가하였다
.
또한Kim
et al.(2007)
은 임하호 유역을대상으로실측된유출량및부유사량을이용해SWAT
모형의모수의적정범위추정방법을개발하고자 하였으며, Kim
et al.(2008)
은 설마천유역을 대상으로 실측된 유출량및
FAO Penman-Monteith
방정식을이용하여산정한잠재증발산을이용해
SWAT
모형 의 보정을실시하였다.
또한Lee
et al.(2007)
은광릉시험림유역을대상으로실측된유출량및토양수분자
료를 이용하여
RHESSys
모형을평가하였으며, Park
et al
.(2008)
은경안천유역을대상으로실측된유출량및영양물질 자료를이용하여
SWAT
모형을평가하고미래토지이용변화에따른영향을분석하였다
.
국외에 서는Bastidas
et al.(2003)
과Koren
et al.(2008)
은소규모 평지에서의 실측된 토양수분자료를 이용하여 모형의검·보정을실시하였다
.
국내에서는증발산량 및 토양수분 측정의비용 및 장비의 한계로인하여 유출량외의 수문성분에대한 실측자료가풍부하지않았기때문에
,
유출량을제외한 다른수문성분의실측자료를이용한검·보정에관련된 연구 역시 제한적일 수밖에없었다
.
그러나2007
년부터한국건설기술연구원유량조사사업단에의해설 마천 유역의 증발산량 및 토양수분의측정이 동시에 이루어짐에따라 비교가능한양질의실측자료가축적 되었고
,
따라서본 연구는이렇게축적된실측자료를이용하여
SWAT
모형의최적화되지않은모수의공간적인보정을실시하여모형의불확실성감소및적용 성을 평가해보고자하였다
.
이러한실측자료의활용 은보다신뢰도높은 모형의모의결과를도출할것으 로기대된다.
II. 재료 및 방법
2.1. 유역모형및대상유역의선정 2.1.1. SWAT 모형
수문모형의주된분류기준으로전원유출모형과도시 유출모형
,
집중형 모형과 분포형 모형,
사상 모형과 연속형 모형으로 구분할 수 있다.
유역 특성에 따라 전원유출모형과도시유출모형으로나눌수있으며,
도 시유출모형의 특징으로 도시유역 하수관거의 모의가 가능하다는 점을 꼽을 수 있다.
모수의 공간적 변화유무에 따라 분포형모형과 집중형 모형으로 구분할 수 있는데집중형 모형은 모든 유역을하나의 특별한 점이라고가정하여입력자료
,
경계조건,
유역의지형적 특성등의공간적변화를고려하지않는방법으로결 과를계산하여입력값인강우를출력값인유출로변 환시키는반면,
분포형모형은공간적변화를고려하 여공간에서발생하는물리적인과정을고려한계산을 통해자연계의현상을규명함으로써집중형모형보다 더욱자세한이론을바탕으로물리적현상에접근한다 는장점이있다.
사상모형은토양에대한 침투능력이 나그외의수문학적차단 능력이건조기간동안달 라지는 현상을모의하지 못하는 반면 연속형 모형은 장기간에 걸친 호우와 건조기간에대한 유출을 모의할수있다는장점이있다
(Han, 2009).
따라서본연 구에서는장기간에걸친 증발산량,
토양수분및유출량을모의하고각 수문성분에관련된 모수의조절을 통해 모형의 모의 결과를 향상시키기 위하여 미국 농무성 농업연구소
(USDA Agricultural Research
Service, ARS)
에서 개발한SWAT
모형을 적용하였다
.
이모형은물리적기반의 준분포형장기강우-
유 출 모형으로서,
대규모의 복잡한 유역에서 장기간에 걸친 다양한 종류의 토양과 토지이용 및 토지관리 상태에 따른유출의영향을 예측하기위해개발되었 으며물수지방정식에근거를 두고 강수,
증발산,
지표유출
,
기저유출,
지하수,
토양수분등에 대한 모의 를 각 수문반응단위(HRUs, Hydrologic Response Units)
별로 계산 할 수 있다(Arnold
et al., 1998).
SWAT
모형에서 사용되는 물수지 방정식은 다음과같다
(Neitsch
et al., 2001).
(1)
여기서 SWt는최종토양수분량
(mm H
2O),
SW0는 i일 의 초기 토양수분량(mm H
2O),
t는시간(
일),
Rday는 i일의 강수량(mm),
Qsurf는 i일의 지표유출량(mm),
Ea는 i일의 증발산량
(mm),
wseep는 i일의 토양면으로 부터 투수층으로의 투수되는 총량(mm H
2O),
마지막 으로 Qgw는i일의회귀수량(mm H
2O)
이다.
2.2.연구대상지역
본 연구의 대상 유역은 설마천 유역으로
,
동경126
o52'~126
o58',
북위37
o55'~37
o58'
사이에 위 치한다.
면적은대략8.54km
2이며,
유로연장은5.8km,
유로경사
2%,
유역의연평균강우량은1210mm
이다.
지질구조특성상초기강우시소량의우량에는하천의 수위에 큰 변화가 없고
,
파쇄대를 채우고 난 이후에 하천의수위가급격히증가하는 현상을보인다.
유역의
90%
이상은주로20~30
년수령의침엽수와활엽수SWt SW0 (Rday–Qsurf–Wseep–Ea–Qgw)
i 1=
∑
t+
=
Fig. 1.
Flowchart of SWAT model simulation.
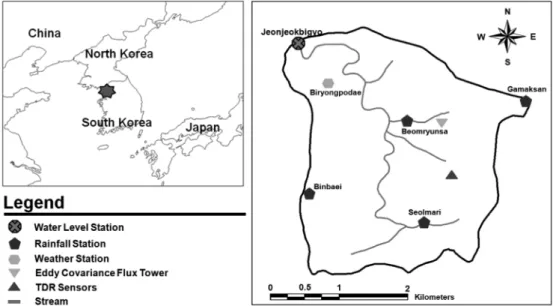
Fig. 2.
Map of the Seolmacheon catchment and the list of hydrological observation.
로구성되어있고
,
표토는얕은편으로함양능력이대단 히낮으며,
산지사면에산재한다량의돌과자갈은집중호우시토석류를유발한다
(http://kict.datapcs. co.kr).
2.2. 유역의기초자료수집및모형의입력자료구축
SWAT
모형의적용을위해서는일강우(mm),
일사량
(MJ/m
2),
평균풍속(m/sec),
평균상대습도(%),
기온(
oC)
등의수문기상자료와수치지형도,
토지이용도,
토 양도등의공간자료가필요하다.
현재한국건설기술연구원의시험유역으로운영
(1995~
현재)
되고 있는설마천유역에는우량관측소
,
수위관측소및기상관측소가 설치되어
(Fig. 2)
양질의수문자료를얻고 있으며,
이 중 모형의 신뢰성을 높이기 위하여 최근 자료인
2002
년부터2008
년까지의기상자료를 이용하여입력자료를구축하였으며
,
대상유역에서측정되지않는기상자료는인접한동두천기상대의자료를이용하였으며
,
일사량은기상청에서자료를제공하지않으므로동일 한 기간의일조시간과 위도 등을 이용하여 일사량을
계산
(Yoon, 2009)
한값을 이용하였다.
공간자료는국토지리정보원에서제공하는격자크기
30m
의수치표고모델
(Digital Elevation Model, DEM)
을 이용하였으며
,
토지이용 자료는 가장 최근에 제공한Landsat
TM
위성영상(2004
년)
을수집및분석하여주거지,
교 통지,
밭,
활엽수림,
침엽수림,
혼효림,
나지 및 기타 초지의8
개항목으로분류하였으며,
농촌진흥청에서제 공한1:25,000
정밀토양도등을이용하였다(Fig. 3).
III. 결과 및 고찰
본연구에서는각수문성분에관련된모수를이용하 여 보정을 실시하였다
.
선정된 모수 및 보정값은Table 1
과 같으며,
모수의 선정은SWAT Theoretical
Fig. 3.
GIS data of the Seolmacheon catchment: (a) DEM, (b) landuse, and (c) soil properties.
Documentation(Neitsch
et al., 2002)
을 참고하였다.
증발산량및토양수분은신뢰할만한실측자료가각각
2007
년9
월 및2007
년6
월부터2008
년12
월까지수 집되었으므로그기간동안의실측값과모의값을비교 및 분석하였다. 2002
년을 초기구동기간(warm-up period)
으로설정하였으며,
증발산량,
토양수분및유출량이 동시에 측정된
2007
년을 보정하였고, 2003
년부터
2006
년및2008
년을검정하였다. SWAT
모형의보 정 및검정 결과에대한 적용성평가를 위하여유출 량에 대해 결정계수(coefficient of determination;
R2)
및
Nash and Sutcliffe(1970)
가제안한 모형효율(model efficiency;
E)
을,
증발산량 및 토양수분에대해 결정Fig. 4.
Comparison of SWAT model estimations against the measurement data: (a) SWAT calibration using a single variable
(streamflow) and (b) SWAT calibration using multi-variable (streamflow, evapotranspiration, and soil moisture).
계수를산정하여검토하였다
.
증발산량에대한검·보정은유역의혼효림에서플 럭스타워의에디공분산시스템을이용하여측정된자 료를이용하였고
,
토양수분에대한검·보정설마천유 역사양토(
덕산토양통)
지점에서TDR(Time Domain Reflectormetry)
센서를이용하여측정된자료를,
유출 량은유역출구지점의자료를이용하여실시되었다.
이러한수문성분은모두한국건설기술연구원유량조사사 업단에의해 실측되고있으며
,
특히 증발산량은연세 대학교 대기과학과에서 후처리 및 보정된 자료(Kwon
et al., 2009)
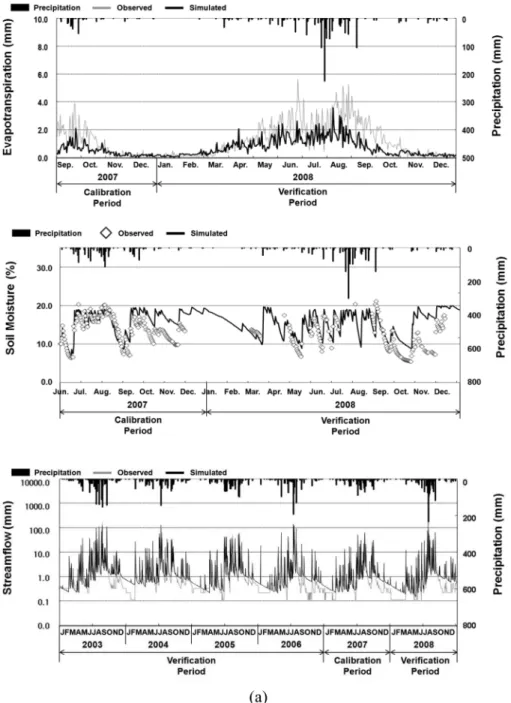
를 이용하였다. Fig. 4
는 각각 증발산량,
토양수분및유출량에 대한 실측치와모의 치의수문곡선의비교를나타낸것이다.
유출량만을이용한검·보정결과와증발산량및토 Fig. 4. Continued
양수분을 함께 검·보정 결과를비교해보기 위하여 먼저유출에관련된모수만을조절한뒤각수문성분 에 대한 결과를 도출하였다
(Table 2 and Fig. 4(a)).
이어서증발산량및토양수분에관련된모수를조절하 였으며
,
이렇게 도출된 결과(Table 2 and Fig. 4(b))
와유출량만을이용한검·보정결과를비교분석하 였다
.
그결과,
증발산량의 R2는0.52
에서0.59
로상향 되었으며
,
증발산의 총량은332.5mm
에서450.0
mm
로약1.5
배가까이상향되었다.
특히여름철증발 산량이 매우 크게 증가함을 확인 할 수 있었는데 Table 1.The calibrated SWAT model parameters
Parameter Definition LB UB Sensitivity Adjusted Value
Q
CN2 SCS curve No. for moisture condition 35 98 High 70
Surlag Surface runoff lag coefficient 1 24 Medium 24
GWQMN Threshold depth of water in the shallow aquifer
required for return flow to occur -1000 1000 High 0
GW_DELAY Groundwater delay 0 500 High 100
GW_REVAP Groundwater “revap” coefficient 0.02 0.2 Medium 0.2
SM
SOL_AWC Available water capacity of the soil layer 0 1 High 0.15
SOL_BD Moist bulk density 0.9 2.5 High 1.6
CANMX Maximum canopy storage 0 100 High 5
ESCO Soil evaporation compensation factor 0 1 High 0.01
ET CANMX Maximum canopy storage 0 100 High 5
ESCO Soil evaporation compensation factor 0 1 High 0.01
Q: Streamflow, SM: Soil moisture, ET: Evapotranspiration, LB: Lower bound, UB: Upper bound
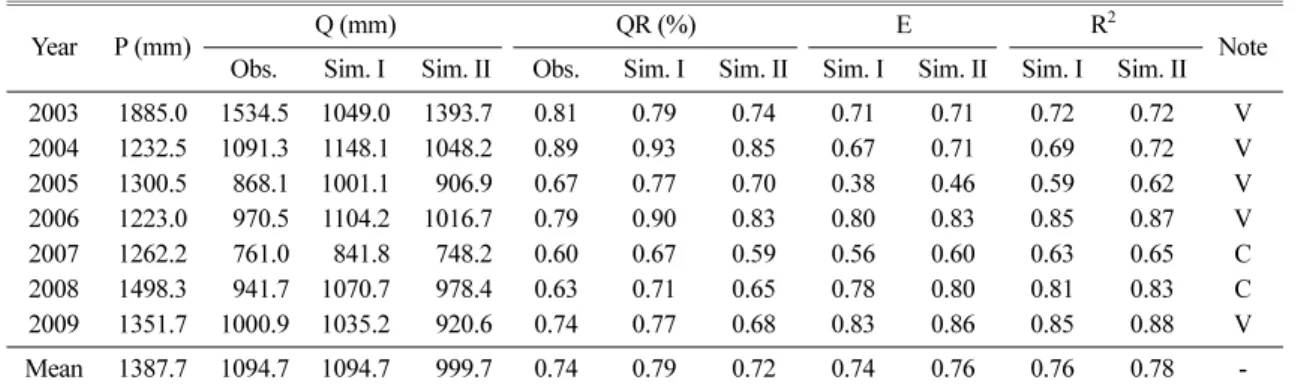
Table 2.
Information on calibration and verification periods for streamflow
Year P (mm) Obs. Q (mm) Sim. I Sim. II Obs. Sim. I Sim. II Sim. I Sim. II Sim. I Sim. II QR (%) E R
2Note
2003 1885.0 1534.5 1049.0 1393.7 0.81 0.79 0.74 0.71 0.71 0.72 0.72 V
2004 1232.5 1091.3 1148.1 1048.2 0.89 0.93 0.85 0.67 0.71 0.69 0.72 V
2005 1300.5 868.1 1001.1 906.9 0.67 0.77 0.70 0.38 0.46 0.59 0.62 V
2006 1223.0 970.5 1104.2 1016.7 0.79 0.90 0.83 0.80 0.83 0.85 0.87 V
2007 1262.2 761.0 841.8 748.2 0.60 0.67 0.59 0.56 0.60 0.63 0.65 C
2008 1498.3 941.7 1070.7 978.4 0.63 0.71 0.65 0.78 0.80 0.81 0.83 C
2009 1351.7 1000.9 1035.2 920.6 0.74 0.77 0.68 0.83 0.86 0.85 0.88 V
Mean 1387.7 1094.7 1094.7 999.7 0.74 0.79 0.72 0.74 0.76 0.76 0.78 -
P: Precipitation, Q: Streamflow, QR: Streamflow Ratio, E: Nash-Sutcliffe Model Efficiency, R
2: Coefficient of Determination, Sim. I: Simulation Results with Single Variable, Sim. II: Simulation Results with Multi-Variables, C: Calibration, and V: Verification
Table 3.
Information on calibration and verification periods for soil moisture and evapotranspiration
Year Period Obs. Sim. I (R SM (%)
2) Sim. II (R
2) Period Obs. Sim. I (R ET (mm)
2) Sim. II (R
2) Note 2007 Jun.-Dec. 13.7 15.6 (0.54) 13.8 (0.71) Sep.-Dec. 109.5 56.4 (0.52) 73.1 (0.60) C 2008 Jan.-Dec. 11.8 14.2 (0.33) 11.3 (0.45) Jan.-Dec. 471.8 276.1 (0.51) 376.9 (0.56) C 2009 Jan.-Dec. 12.1 15.3 (0.49) 13.6 (0.55) Jan.-Dec. 408.6 275.8 (0.56) 395.3 (0.66) V
Mean - 12.5 15.1 (0.46) 13.0 (0.55) 330.0 202.8 (0.53) 281.8 (0.59) -
P: Precipitation, SM: Soil Moisture, ET: Evapotranspiration, Sim. I: Simulation Results with Single Variable, Sim.
II: Simulation Results with Multi-Variables, R
2: Coefficient of Determination, C: Calibration, and V: Verification
(Fig. 4)
이는 증발산량이계절에 따른 온도 변화 및 일사량변화에영향을받기 때문이며,
이러한결과의비교를 통해 유출에 관련된모수의 조절이증발산량 및 토양수분에크게 영향을미치지못함을 알수 있 었다
.
또한 증발산량과토양수분에관련된모수가서 로같고,
이들을조절 했을때증발산량및토양수분 의수문곡선변화뿐만아니라유출수문곡선의기저 부분도실측과가깝게변화함을 보였다.
이는 토양수 분으로부터증발산이발생하고이로인해유출에까지 영향을 미치는‘
물수지’
의 현상을 재현했음을 알 수 있었다.
그 결과 토양수분의 R2는0.49
에서0.59
로상향되었으며
,
함유율은평균15.7%
에서13.2%
로감 소하였다.
유출량에서 R2는0.72
에서0.76
으로,
E는0.65
에서0.70
으로 상향되었으며,
유출률은79.6 %
에서
73.7%
로감소하였다.
이로써기존연구와같은유출량만을이용한검·보정결과는다른수문성분에대 한불확실성을내포함을알수있었으며
,
실측된다른 수문자료를함께이용하여검·보정을실시하였을때 물수지를구성하는수문성분에대한불확실성이감소 함을알수있었다.
적 요
국내 수문관측자료의 부족으로
SWAT(Soil Water
Assessment Tool)
모형의적용성평가는대부분유출자료만을 사용하여이루어진다
.
본 연구는실측된여 러수문자료가SWAT
수문모형의불확실성및오차의 감소를 위해 어떻게이용될수 있는 지에대하여 알 아보고자하였다.
이를위해전형적인산지유역인설마천 유역을 대상으로 준분포형 장기강우유출모형인
SWAT
모형을적용하여수문성분의특성을살펴보았다.
먼저모형의입력자료인기상자료및지형자료를획득 하여구축하였고
,
모형의검·보정위하여유출,
증발산
,
토양수분 실측자료를 획득하였다. SWAT
모형은유츨량
,
증발산,
토양수분자료가동시에측정된2007
년자료를사용하여보정된후
, SWAT
모형의모의값은 유출량은
2003~2008
년,
증발산과 토양수분은2008
년의 관측값과비교,
분석한뒤전체적인검증을통해모형의적용성평가를실시하였다
.
유출량의검·보정이용한모의결과보다다른실측자료를이용한모 의결과가 신뢰성이높게나타났다
(
결정계수(
R2)
상향:
유출량은
0.72
에서0.76,
토양수분은0.49
에서0.59,
증발산은
0.52
에서0.59).
유역의실제적인상황을근접하게모의하기위해서는다른수문성분의정확하고 신뢰성 있는 자료의구축과 적용이 매우 중요하다고 판단된다
.
감사의 글
본연구는