• 검색 결과가 없습니다.

Impact Assessment on the Forest Systems of the Korean Peninsula due to the Global Warming

N/A
N/A
Protected

Academic year: 2021

Share "Impact Assessment on the Forest Systems of the Korean Peninsula due to the Global Warming"

Copied!
10
0
0

로드 중.... (전체 텍스트 보기)

전체 글

(1)

- 1 -

Impact Assessment on the Forest Systems of the Korean Peninsula due to the Global Warming

Jung, Hui-cheul

1)

․Jeon, Seong-woo

1)

and Lee, Dong-kun

2)

1)

Korea Environment Institute,

2)

Sangmyung University

지구온난화로 인한 한반도 삼림의 영향 평가

정휘철

1)

․전성우

1)

․이동근

2)

1)

Korea Environment Institute․

2)

상명대학교 환경조경전공

ABSTRACT

우리나라의 기후변화연구에서 삼림생태계의 영향과 적응은 가장 중요한 관심사중 하나이 다. 지리적 위치와 통일문제 등을 고려할 때, 한반도는 역동적인 개발이 이루어질 지역이며 인구와 경제적 상황의 변화로 삼림 생태계에 급격한 변화가 예상된다. 기후변화의 영향은 이 러한 상황을 더욱 복잡하게 만들게 될 것이다. 본 연구에서는 이런 영향을 평가하기 위해, IS92a 시나리오의 GCMs(General Circulation Models)결과들을 이용하여 가능한 기온 증가 범위 내에서 삼림생태계의 변화를 예측하였다. 변화를 추정하기 위해 AIM/Impact[Korea](the Asian-Pacific Integrated Model) 모형을 이용하여 시기별 Holdridge 생물기후대를 예측하고 목 본식물의 이동속도를 고려한 지역삼림의 영향 및 적응 패턴을 분석하여 생태계 변화로 인한 경제적 가치 손실액을 추정하였다. 분석 결과는 다음과 같이 요약된다.

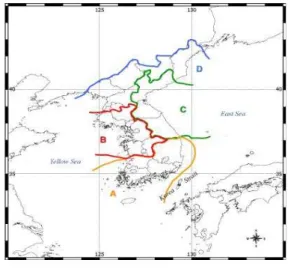
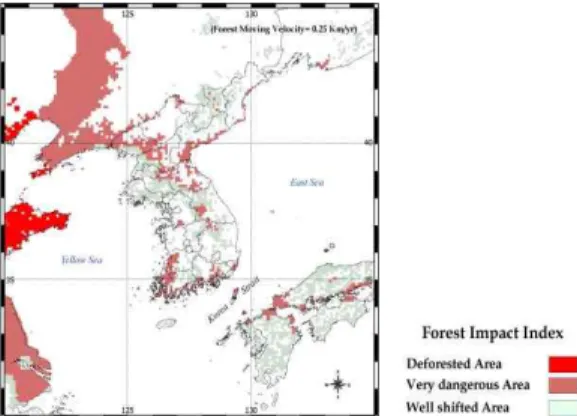
1) 목본식물의 추정 평균이동속도 0.25km/년의 경우, 한반도에서 삼림소실지역은 발생하지 않는 것으로 예측되었다. 그러나 인위적 개입이 없는 경우 고사의 위험이 높은 지역은 남한 의 경우 남한 총면적의 14%를 차지하였고, 북한은 18%정도의 면적이 고사 위험이 있는 것으 로 나타났다. 남한 고사위험지역의 80%는 난온대림 지역으로 주로 남해일원과 전라도 서해 안에서 발생하며, 북한은 고사위험지역의 대부분이 냉온대림지역으로 주로 평안도 내륙지역 과 중국 접경지경, 함경남도의 영흥만 북부에서 나타났다.

2) 목본식물의 이동속도 변화에 따라 남한은 매년 0~976백만불, 북한은 0~2,492백만불 범위

의 경제적 가치손실이 발생하는 것으로 예측되었다. 또한 목본식물의 추정 평균이동속도가

0.25km/년일 경우, 한반도 전체의 가치손실액은 매년 3,471백만불에 달했으며, 남한의 경우

목본식물의 이동속도가 0.5km/년 이상인 경우 삼림의 경제적 가치 손실은 발생하지 않았다

Key Words:AIM-model, global warming, GCM, forest vegetation impact, economic value

(2)

Ⅰ. INTRODUCTION

1. Background and Objectives

The natural forest system is a treasure house of global genes and bio-diversity. The impact study on forest carries a crucial importance due to the fact that forest provides diverse resources as well as plays an important role in climate stabilization (Costanza et al ., 1997). For South Korea where about 70% of the land area is covered by forest, the impact on forest sector carries a special significance on climate change impact assessment. In order to conserve forest ecosystems and to reduce the adverse social and economic influences from forest change triggered by climate change, the impact of climate change on forest ecosystems needs to be analyzed accurately using a number of highly credi

ble scenarios (IPCC, 1996, 1998).

Recently, there have been many direct impact studies on forest ecosystem in continental and global scale(AIM, 1997; Harasawa, 2000). These large-scale studies revealed a wide range of uncertainties in the impact assessment even if the analysis is restricted to the direct impacts. Most national scale impact studies conducted in Korea have overlooked such uncertainties of prediction;

moreover, failed to incorporate physical input pa

rameters, such as General Circulation Model (GCM) results (Kim, 1993).

This study attempted to predict the future change of forest distribution on the Korean Peninsula due to climate change by employing AIM (Asian- Pacific Integrated Model) Impact Model with 5 GCM results under IPCC's (United Nations Intergovernmental Panel on Climate Change) IS92s scernario (doubled CO

2

levels). The impact on the forest ecosystem was evaluated by tree moving velocity using a correlative climate-vegetation model (Holdridge Life Zone model). The estimation of the economic impact on forest sector due to climate change was also attempted.

The study was conducted in following steps:

1. Using five different GCMs (General Circula

tion Models) of IS92a scenario of IPCC (United Nations Intergovernmental Panel on Climate Change), the climate change pattern around the Korean Peninsula was predicted.

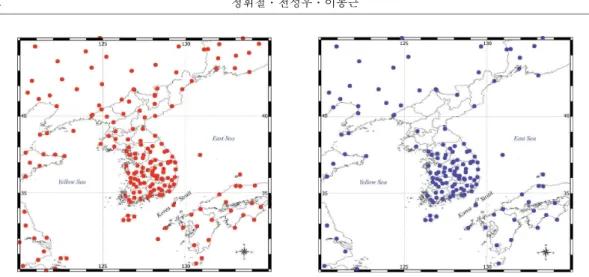
2. Forest ecosystems were classified by the climatic biological characteristics using the Holdridge model. The possible impact on the forest on the Korean Peninsula by climate change at year 2100 was predicted. Also, the developed model was compared and verified using classification results by the Warmth Index and the representative tree species of Current Vegetation Map by the Ministry of Environment.

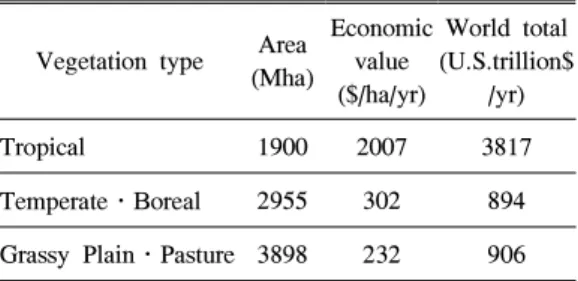
3. The economic value of forest ecosystem under changed climate was calculated with NCEAS (National Center for Ecological Analysis and Synthesis) method.

2. Impact Analysis Method

An impact assessment method taking forest movement into account is shown in Figure 1.

Bio-climate classification in 2100 was projected using GCM and AIM (Asian-Pacific Integrated Model) models. The size of affected area was calculated using GIS (Geographic Information System) (AIM, 1996, 1997). The adaptability of forest ecosystem was assessed based on the invasion possibility of an exotic plant and forest movement possibility (Munesue and Takahashi, 2000). Davis(2000) suggested that forest moving velocity is about 0~2 kilometers per year regardless of tree species along a movement route.

In this study, the average forest moving velocity was assumed to be 0.25km/year. Four different moving velocities of 0.25, 0.5, 1.0, and 2.0 km/

year were considered for the impact assessment in

this study. Finally, the economic value of forest

change was calculated using NCEAS (National

(3)

Center for Ecological Analysis and Synthesis) method.

Climate Change Scenario

Holdridge classification

Estimate econmic value change

Forest moving Velocity Forest impact assessment

GIS system 1. visualization 2. Estimation of area

GCM-runs

AIM-model

Davis(1989)

Assessment model development

NCEAS model

Figure 1. Forest impact assessment flow

Ⅱ. FOREST IMPACT ASSESSMENT AND ADAPTATION RESULTS 1. Study Area

Considering the linkage of forests on the Korean Peninsula, the study area was defined as Northeast Asia including North Korea and Manchuria (latitude:30~45°, longitude:120~

135°). Also, in order to understand the regional features of impact and the degree of impact, the study area was divided into four regions consider

ing the distribution of forest ecosystem and climate patterns. Region "A" covers the southern part of the Korean Peninsula including South and North Kyongsang provinces and South and North Jeonla provinces. Region "B" is the western part of South and North Choongchong provinces, Kyonggi province, and Hwanghae province. Region "C" is the central eastern coastal area of Kangwon province and South Hamkyong province. Finally, Region "D" is defined as the northern part of South Pyongan province, North Pyongan provinces, and North Hamkyong province.

2. Observed Climate and GCM-runs

Climate information required in the model was

produced using the present temperature and prec

ipitation figures and the temperature and precipita

tion change rate from GCM results.

The current climate data were produced using average temperature and precipitation of 1961~

1999 at observation stations in Northeast Asia of the Global Historical Climatology Network Data (GHCN) provided by UNEP's Grid Data Center and at 80 full-time climate stations of the Korea Meteorological Administration. Location of climate stations is shown in Figure 3.

Figure 2. Study area

To generate future climate data, 5 GCM-runs of CSIROMK2, CCCma, ECHAM4, HADCM2, CCSR/NIES, which are medium GHGs emission scenario(IS92a) by IPCC were used. Since spatial resolution of GCM is not dense enough to be used in impact studies, the data were spatially interpolated using methods suitable for each climate parameter (Takahashi et al ., 1998; Nalder and Wein, 1998).

3. Future climate impact of Korean Peninsula

Following global average temperature increase

(Δ T

asm

) of 2℃, the estimated national average

temperature increase ranged from 2.3℃ to 4.1℃.

(4)

Figure 3. Climate station (Left:temperature 227 stations , Right:precipitation 119stations)

Holdridge classification Warmth Index classification Quercus mongolica and Camellia japonica Figure 4. Comparison of Quercus mongolica and Camellia japonica distribution and each forest climate In particular, winter temperature of North Korea

increased significantly. Precipitation change showed

Table 1. Future Climate impact relation with Δ T

asm

Δ T

asm

Area

Temperature Precipitation 1.0 1.5 2.0 2.5 1.0 1.5 2.0 2.5

A 0 0 ++ +++ 0 0 0 0

B 0 ++ +++ +++ 0 0 0 0

C 0 +++ +++ +++ 0 0 0 0

D 0 +++ +++ +++ 0 0 0 +

Code --- -- - 0 + ++ +++ Unit Temperature <2.252.25- 2.5 2.5-

2.75 >2.75 increase,

℃ Precipitation <-45 -45~-30 -30~- 15 -15~

15 15~

30 30~45 >45 % change

a range of -1.6~+14.3% indicating a slight increase. In the southern area, the amount of precipitation turned out to be somewhat decreased.

It showed that impact of climate change would be greater in North Korea. The degree of impact by climate parameter is shown in Table 1.

4. Current Forest Distribution and Verifica

tion

The Holdridge model was used to predict and to

assess the change in forest distribution caused by

climate change. For verification of the predicted

results, distribution scope using the Warmth Index

of the Korean Peninsula (Yim, 1977) and the

(5)

current vegetation map by the Ministry of Envi

ronment were used. In Figure 4, the distribution of Quercus mongolica colony and Camellia japonica colony, which are representative tree species of each climate zone, and the distribution trend of the Warmth Index showed similar features to the result of Holdridge model. In Figure 5, Holdridge classification under the current climate showed that the central area is covered by warm temperate forest and North Korea is mostly covered by cool temperate wet forest. Highland area is divided into boreal wet forest and boreal rain forest. Figure 6 shows the Holdridge forest climate zonation by GCM based on the global average temperature increase of 2100.

Figure 5. Holdridge Classification of 1990 (Scenario=

IS92a, GCM= HadCM2)

Figure 7. Forest Extinction Hazardous Area of 2100 (Forest Moving Velocity=0.25Km/yr)

Table 2. Temperate and Boreal Forest Average Change Relation with Δ T

asm

Δ T

asm

(℃) 0.5 1.0 1.5 2.0 2.5 3.0 3.5 4.0 Region

A(%) 2.2 4.4 14.8 28.5 44.1 57.7 69 77.9 Region

B(%) 0 0 0.3 4.1 13.3 30.7 46.3 61.8 Region

C(%) 3 4 5.4 7 9.6 14.5 21.2 29.4 Region

D(%) 0 0 0 0 0 2 6.7 11.9

Table 2 shows that average forest change is predicted as much as 28.5% if global average temperature is raised by 2℃. When global average temperature is increased by 2.5℃, 44% of temperate forest in the southern coastal areas is likely to be changed to subtropical moist forest. In the southern and eastern coastal areas, climate change can be even triggered by a slight temperature change of 0.5℃. If temperature change is over 2.

5℃ in the west coastal area, the change of forest was more serious than that in the east coastal area.

In North Korea, the forest change was mostly concentrated in Hwanghae province and the western coast of Pyongan province. In highland area like the Kaema Heights, change was limited.

5. Forest Impact Assessment

In order to assess forest impact of climate

change, HadCM2 GCM, which is similar to the

sensitivity of IPCC IS92a scenario, was used. The

average temperature increase of 2×CO2 was set at

2.08℃. In case the average moving velocity of

forest is 0.25km/yr, it was projected that there will

be no forest extinction area on the Korean

Peninsula. However, high-risk area of forest decline

with no artificial involvement represented 14% of

South Korean land area (99,800㎢) and 17.9% of

North Korean area (122,762㎢). Figure 7 shows the

forest adaptability in 2100 from climate change.

(6)

(A)

(B)

(C)

(D)

(E)

(Δ T

asm

=0.5℃) (Δ T

asm

=1.0℃) (Δ T

asm

=1.5℃) (Δ T

asm

=2.0℃)

Figure 6. Holdridge classification result by 5-GCMs of 2100

(A:CSIROMK2, B:CCCma, C:ECHAM4, D:HadCM2, E:CCSR/NIES)

(7)

(A)

(B)

(C)

(D)

(E)

(Δ T

asm

=2.5℃) (Δ T

asm

=3.0℃) (Δ T

asm

=3.5℃) (Δ T

asm

=4.0℃)

Figure 6. Holdridge classification result by 5-GCMs of 2100

(A:CSIROMK2, B:CCCma, C:ECHAM4, D:HadCM2, E:CCSR/NIES)

(8)

Forest decline risk areas in South Korea were mostly the south coastal area and the southern part of the west coastal area. About 80% of the forest decline area is warm temperate and remaining area is cool temperate forest. In case of North Korea, the forest in Pyongan province inland area, the Aplok River downstream, and the northern area of Youngheung Gulf is predicted to be on the decline.

The majority(97.8%) of the area is currently cool temperate forest.

6. Economic Value Change of Forest System In Table 3, the 'willingness to pay' for environ

mental improvement was calculated to estimate the economic value of the natural forest. The economic value of the world's forest was estimated to be $4.7 trillion per year (as of 1994) (Costanza et al. , 1997). The economic value of the forest in Table 3 was used in estimating the economic value of forest extinction in 2100 by combining with the results of impact assessment on forest adaptability.

Table 3. Economic Value of Nature Forest (NCEAS Model)

Vegetation type Area (Mha)

Economic value ($/ha/yr)

World total (U.S.trillion$

/yr)

Tropical 1900 2007 3817

Temperate․Boreal 2955 302 894 Grassy Plain․Pasture 3898 232 906 Costanza et al., 1997, The Value of the world's ecosystem services and natural capital. NATURE, 387

:253-260

The net economic loss in forest sector due to climate change was estimated based on the forest average moving velocity. The loss is estimated to be US$0~976 million per year in South Korea and will range US$0~2,492 million per year. If average forest moving velocity reaches 0.25km/yr, the economic loss in entire forest ecosystems on

the Korean Peninsula is estimated to be US$3,471 million per year. In South Korea, no loss of economic value of forest is predicted if average moving velocity exceeds 0.5km/yr.

Ⅲ. DISCUSSION AND CONCLUSION

Most scientists believe that impact of climatic change is underway and they predict that its pace will accelerate if there are no actions or counter

measures to reduce the impact at a global level. The trend of recent climate change impact studies is focused on adaptation measures than on reduction measures (IPCC, 1998). This implies that climate change impact is coming despite of painstaking human endeavors to alleviate the climate change;

thus, some practical and smart impact adaptation measures are required. It is significant to have a clear understanding on where the impact will emerge and on what the impact will be like.

In order to carry out a credible and valid assessment on climate change impact, a massive amount of refined multi-temporal base data is required. However, the required data is unrefined or limited. There is no doubt that the first step to climate change impact modeling ought to be the refinement of base data. Such an activity is not possible with sufficient preparatory work by individ

ual researchers. It requires systematic preparation at a national level. Suggestions for further studies are as follows:

First, there should be great support on producing

basic data at a national level to improve the

utilization of data. In order to produce basic data

that improve the credibility of impact studies,

national-level support is required. Also, there

should be great efforts and support on producing

the regional climate model outputs reflecting

regional micro-climate. Moreover, in order to

stimulate impact studies at a regional level and to

generate credible results continuously, it is necessary

(9)

to formulate mid/long-term study plans and to initiate them steadily.

Second, the utilization of an integrated impact assessment model should be reviewed. The change of natural environment from climate change is very complicated. Since its impact factors are inter- related, their impact relations need to be well reflected to perform future impact projections accurately.

Based on the above policy suggestions to build an integrated impact assessment model and to formulate the national plan, followings need to be initiated:

In Phase 1, international trend should be surveyed and basic data need to be refined. It should focus on understanding the strength and weakness of each model built and used interna

tionally and building basic data required to run these models.

In Phase 2, sectoral impact assessment models need to be built and verified. Based on integrated impact assessment models suggested in the previous impact assessment study trend, assessment models suitable for Korea should be selected and built for each sector. Then, their credibility should be verified by using various existing data.

In Phase 3, the national action plans should be developed by utilizing an integrated impact assess

ment model. This is a phase of building an integrated model of the sectoral models built in Phase 2. By using the model, action plans against the degree of impact of each sector should be generated.

Given that such a national level support and model build-up are provided, it will be useful as basic data and policy-support data in developing plans against international agreements such as the Convention on the Biological Diversity and the Convention on Climatic Change. Through such efforts, development and execution of efficient national policy may be promoted.

REFERENCE

AIM Project Team, 1996. Technical structure of AIM/Impact model, AIM Interim Paper, IP-95-06, Tsukuba, Japan.

AIM Project Team, 1997. Asian-Pacific integrated model, National Institute for Environmental Studies, Japan, p.69.

Costanza, R., R. d'Arge, R. de Groot, S. Farber, M.

Grasso, B. Hannon, S. Naeem, K. Limburg, J. Paruelo, R.V. Neill, Raskin, R., Sutton, P., van den Belt, M., 1997. The value of the world's ecosystem services and natural capital. Nature, 387:253-260.

Davis, M. B., 1989. Lags in vegetation response to greenhouse warming. Climate Change, 15:

75-82.

Harasawa, H., 2000. “Recent development of impacts study in Japan and IPCC. Sympo

sium of Korea Environment Institute, climate change and ecosystem conservation, Seoul.

IPCC, 1996. Climate Change 1995, Impacts, adapta

tions and mitigation of climate change, Cambridge University Press, p.111.

IPCC, 1998. The regional impacts of climate change, an assessment of vulnerability, A special report of IPCC WG-II.

Kim, T. H., 1993. Impact assessment and adaptation on the forest ecosystem, Symposium of Korea Institute of Science and Technology, Climate change impact on the Korean penin

sula, pp. 31-59.(in Korean)

Munesue, Y. and Takahashi. K., 2000. Evaluation of climate change impact on vegetation and its economic value, Japanese Environmental Science, 13(3):329-337.(in Japanese, with English abstract)

Nalder, I. A. and R. W. Wein., 1998. Spatial

interpolation of climatic normals:Test of a

new method in the Canadian Boreal Forest,

Agricultural and Forest Meteorology 92:

(10)

211-225.

Takahashi, K., Y. Matsuoka and H. Harasawa.

1998. Impacts of climate change on water resources, crop production and natural eco

system in the Asia and Pacific region, J. of

Global Environment Engineering, 1:91-103

Yim, Y. J., 1977. Distribution of forest vegetation

and climate in the Korean Peninsula Ⅲ,

Distribution of tree species along the thermal

gradient, Japan J. Ecology, 27:177-189 (A)

接受 2002年 9月 18日

수치

Figure 2. Study area
Figure 3. Climate station (Left:temperature 227 stations , Right:precipitation 119stations)
Table 2. Temperate and Boreal Forest Average Change Relation with Δ T asm
Table 3. Economic Value of Nature Forest (NCEAS Model)

참조

관련 문서