A New Study on Vibration Data Acquisition and Intelligent Fault Diagnostic System for Aero-engine
Yongshan Ding, Dongxiang Jiang Master Student, Professor in Tsinghua University
Department of Thermal Engineering, Tsinghua University, Beijing 100084, China [email protected] [email protected]
Keywords: Aero-engine, Data Acquisition, Fault Diagnosis, Artificial Intelligent Abstract
Aero-engine, as one kind of rotating machinery with complex structure and high rotating speed, has complicated vibration faults. Therefore, condition monitoring and fault diagnosis system is very important for airplane security. In this paper, a vibration data acquisition and intelligent fault diagnosis system is introduced. First, the vibration data acquisition part is described in detail. This part consists of hardware acquisition modules and software analysis modules which can realize real-time data acquisition and analysis, off-line data analysis, trend analysis, fault simulation and graphical result display. The acquisition vibration data are prepared for the following intelligent fault diagnosis. Secondly, two advanced artificial intelligent (AI) methods, mapping-based and rule-based, are discussed. One is artificial neural network (ANN) which is an ideal tool for aero-engine fault diagnosis and has strong ability to learn complex nonlinear functions. The other is data mining, another AI method, has advantages of discovering knowledge from massive data and automatically extracting diagnostic rules. Thirdly, lots of historical data are used for training the ANN and extracting rules by data mining. Then, real-time data are input into the trained ANN for mapping-based fault diagnosis. At the same time, extracted rules are revised by expert experience and used for rule-based fault diagnosis. From the results of the experiments, the conclusion is obvious that both the two AI methods are effective on aero-engine vibration fault diagnosis, while each of them has its individual quality. The whole system can be developed in local vibration monitoring and real-time fault diagnosis for aero-engine.
Introduction
Rotating machinery represents a large class of mechanic systems and is widely used in industry. The two-shaft aero-engine is one kind of rotating machinery which has many components and is highly complex. Compared with the traditional rotating machinery such as generators and pumps, the aero- engine has a higher rotating speed. Owning to working in the high rotating speed, large load and severe conditions, it is necessary to be identified for possible causes and adopt remedial measures immediately when a fault occurs1). Therefore,
condition monitoring and fault diagnostic system is very important for airplane security.
In this paper, a vibration data acquisition and intelligent fault diagnosis system is introduced. For conventional measure instruments, many hardware components are needed with high cost. Especially, these equipments are difficult to be centralized. VI (Virtual Instrument) can solve this problem because fewer instruments are needed and connected with computer to develop the test system. The integrated performance of test system is improved and the development cycle is shortened. First, this paper introduces a vibration data acquisition system based on LabVIEW (a VI program language) including the structure of the hardware system and the function of software system. Then, the intelligent fault diagnostic system is applied for fault diagnosis including Self- Organizing Feature Map (SOFM) neural networks (one type of ANN) and the decision tree. Both of them have powerful advantages compared with other diagnostic methods. The whole system is tested based on some experiments and simulations finally.
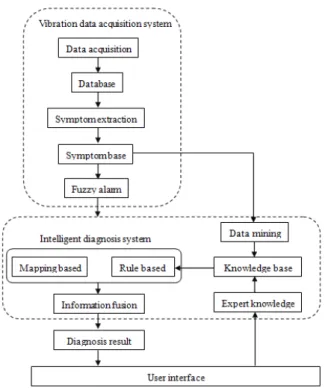
Fig. 1 Vibration data acquisition and intelligent diagnosis system for aero-engine
Vibration Data Acquisition System
Hardware Structure
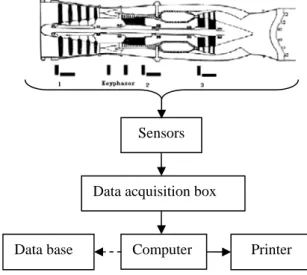
There are eight testing points on the aero-engine including axial and radial direction as show in Fig.2.
Six acceleration sensors are installed on aero-engine casing and two keyphasors to test rotating speed. The data acquisition box is DaqBook/112 produced by IOtech Corporation including 16 channels2). All signals are inputted into the computer for data analysis. A printer is connected with computer to print various reports.
Fig. 2 Hardware structure of aero-engine vibration data acquisition
Software platform
NI LabVIEW is graphical programming for measurement and automation which targetes at scientific researchers and engineers that need to collect, process, and store their experimental data. The characteristics of LabVIEW are dataflow, modularity, multithreading & parallelism and Interactive execution & debugging. Data acquisition and analysis modules are based on LabVIEW3). The functions of software platform are shown in Fig. 4.
Some functions are listed as follows.
1) Signal acquisition and storage: Vibration data are acquired from hardware system and real-time stored into data base through I/O.
2) Signal processing and analysis: Time and spectrum scale analysis will be taken out including real-time analysis module, off-line analysis module and trend analysis module. Real- time analysis module includes danger alarm, VPP histogram, parameters list, time-wave, spectrum and axial track as shown in Fig.3 and Fig.5. Instantaneous analysis (waterfall and bode figures) and parameter trend are analyzed in off- line and trend analysis modules.
3) Fault diagnosis: When a fault happens, real-time monitoring module will alarm and shifts to intelligent fault diagnosis system to evaluate fault types and fault reasons.
Fig. 3 Time-wave and Axial Track
4) Data file management: Software system can store data along with time and manage the analysis results conveniently.
5) Fault simulation: Familiar vibration faults can be simulated including misalignment of rotor, rubbing of rotor and unbalance of rotor mass and so on.
Fig.4 Software System Function Flowchart Sensors
Data acquisition box
Printer Data base Computer
Data acquisition Faults simulation
Waterfall figure, bode figure
Off-line analysis Trend analysis
Real-time monitoring Fault
diagnosis
Set limit values, VPP histogram, parameters list,
time-wave, spectrum, axial track
Parameters trend analysis
Fig.5 VPP histogram and rotating speed Intelligent fault diagnostic system
Fault classifications of two-shaft aero-engine A two-shaft aero-engine has two compressors (high and low pressure compressors) and two turbines (high and low pressure turbines). The high pressure rotor drives high-pressure compressor and turbine, while the low pressure rotor drives the low-pressure ones.
We described high-pressure rotor as HPR, low- pressure rotor as LPR, high-pressure compressor as HPC, and low-pressure compressor as LPC.
According to field expert’s experience and theoretical research outcomes, Table 1 shows the vibration faults classification of two-shaft aero-engines. The table includes typical nineteen faults numbered F0 to F18.
Unbalance is the most common cause of aero-engines vibration as the result of non-uniform mass distribution.
Table 1. Faults classification of two-shaft aero- engines
Faults No. Faults Name F0 normal
F1 LPC unbalance
F2 HPC unbalance
F3 LPR misalignment
F4 HPR misalignment
F5 LPR bent shaft
F6 HPR bent shaft
F7 LPR shaft-seal rubbing F8 HPR shaft-seal rubbing
F9 LPR axial rubbing
F10 HPR axial rubbing
F11 LPR clearance vibration F12 HPR clearance vibration
F13 LPR bearing rigidities (vertical and horizontal) differ greatly
F14 HPR bearing rigidities (vertical and horizontal) differ greatly
F15 LPR crack
F16 HPR crack
F17 LPC surging
F18 HPC surging
In any faults diagnosis, we need some information to help us to detect the faults, so feature extraction from the symptoms is a necessary step for aero- engines faults diagnosis. Vibration spectrum analysis is a useful and powerful tool for aero-engines faults diagnosis, because it roots in a great deal of engineering experience. Even then, the relationship between the faults and spectrum data can not be established easily because state of rotating machinery is complex, and influenced by numerous of process parameters. So we usually use the feature-fault relationship matrices in well-established machining reference databases, expert intelligence for reasoning and decision-making and experimental results of signal characteristics for various working conditions.
In order to improve the veracity of diagnosis, we also need some other parameters to assist the detecting.
According to the engineering experience, we choose three process parameters as additional parameters which are unsteady vibration (US), vertical vibration (VER), level vibration (LEV). Table 2 shows the spectrum symptoms and process parameters description. In this table, we describe LPR’s running frequency as X1, twice running frequency of LPR as 2X1, HPR’s running frequency as X2, twice running frequency of HPR as 2X2 and so on.
Table 2. Spectrum and processes description Spectrum Description Spectrum Description
s1 0~0.5X1 s10 2X1
s2 0.5X1 s11 2X1~2X
2
s3 0.5X1~0.5X2 s12 2X2
s4 0.5X2 s13 2X2~3X
1
s5 0.5X2~X1 s14 3X1
s6 X1 s15 3X1~3X
2
s7 X1~X2 s16 3X2
s8 X2 s17 >3X2
s9 X2~2X1
Application of SOFM neural network
Compared with the most popularly used models such as BPNN, SOFM has a structure which is more similar to humanity biology. The most distinct feature is that the training is an unsupervised process5). The structure of the model is shown in Fig.6.
Such model is made up of two layers-input and output: Every input neuron connects with the output ones by connection weighting vectors. The number of the input nodes is determined according to the dimensions of the input vectors and the input nodes receive input values. The output layer is a plane, which is made up of neurons arrayed in a certain way (square or hexagon, etc) 5).
Firstly, we should train the nineteen standard samples and construct the neural network structure.
Considering the accuracy of diagnosis and the speed of calculating constringency, we choose the number of output nodes as 289 (17×17). Then the nineteen
standard samples are trained according to the arithmetic mentioned in section 2.2.
Fig.6 SOFM Neural Network
After that, we will obtain the positions of these samples in the neural network structure map which is showed in Fig.7, these faults samples are distributed in the map and marked respectively from F0 to F18.
Secondly, we train seven testing samples showed by table 4 and they will also find their positions in the map which are showed in Fig.8, and respectively marked from T0 to T6. Finally, we compare the two maps and we will find that the position of T0 is the same as that of F1, so we can deduce that T0 is working on the condition of F1 (normal), it can be diagnosed as normal.
Fig.7 Training result by SOFM
Fig.8 Diagnostic result by SOFM
The rest may be deduced by analogy, the testing samples T1, T2, T3, T4, T5, T6 correspond
respectively to F1, F6, F11, F16, F18, F9, so we can conclude that the faults of T1 to T6 are respectively LPC unbalance, HPR bent shaft, LPR clearance vibration, LPR crack, HPC surging and LPR axial rubbing.
Application of Decision Tree Classifier Method
Table 3. Final classification rules
ID IF Then Supp. Conf. Cap.
1 s10>=.8001 F13 5.7% 100% 100%
2 s1<.0018262, s10<.8001, s6<.40002, s8<.0019927
F17 5.1% 100% 100%
3 s10<.50001, s6<.40197, s6>=.40002
F15 5.5% 100% 100%
4 s10<.80001, s10>=.50001, s6<.40197, s6>=.40002
F3 5.1% 100% 100%
5 s10<.80001, s6>=.40197, US<.10198
F1 4.9% 100% 100%
6 s10<.80001, s6>=.40197, US>=.10198
F5 4.9% 100% 100%
7 s1>=.018262, s10<.80001, s6<.40002, s8<.0019927, VER>=.50196
F7 4.6% 100% 100%
8 s3>=0.019744, s12<.01986 F12 4.9% 94.8% 100%
9 s12>=.001986, s8<.3 F14 6.6% 92.2% 100%
10 s1<.10197, s1>=.0019262, s10<.80001, s6<.40002, s8<.0019927, VER<.50196
F9 4.4% 100% 100%
11 s1>=.10197, s10<.80001, s6<.40002, s8<.0019927, VER<.50196
F11 5.6% 100% 100%
12 s3<.0019744, s4<.0019695, s12<.001986, s8>=.0019927
F0 5.8% 97.7% 100%
13 s4>=.019695, s8>=.0019927 F18 5.9% 91.3% 100%
14 s3<.0019476, s10<.80001, s12>=.001986, s6<.40002, s8>=.3, LEV>=.402
F4 5.8% 100% 100%
15 s3>=.0019476,
s12>=.001986, LEV>=.402
F10 5.7% 98.5% 100%
16 s3 <.0019813, s10<.80001, s12>=.001986, s6<.40002, s8<.90001, s8>=.3, LEV<.402
F16 5.5% 100% 100%
17 s3>=.0019813, s10<.80001, s12>=.001986, s6<.40002, s8<.90001, s8>=.3, LEV<.402
F8 4.8% 100% 100%
18 s10<.80001, s12>=.001986, s6<.40002, s8>=.90001, LEV<.402, US<.10199
F2 5.3% 100% 100%
19 s10<.80001, s12>=.001986, s6<.40002, s8>=.90001, LEV<.402, US>=.10199
F6 5.2% 100% 100%
Decision tree is a kind of data mining method based on the following Nomenclature:
1) A decision tree is a flow chart or diagram representing a classification system or a predictive model.
2) The hierarchy is called a tree, and each segment is called a “node”. The root node refers to the original segment containing the entire data set.
The final nodes are called leaves. A decision made at each leaf is applied to all observations in the leaf.
3) The end product is a collection of hierarchical rules that segment the data into groups, where a decision (classification or prediction) is made for each group.
4) Each piece of rule’s quality is measured by three criterions: “support, confidence and capture”.
“Support” measures how widely applicable is the rule, “confidence” measures the accuracy of the rule and “capture” measures how many records (showed by percentages) is correctly captured by the rule.
We utilize the Ctree algorithm to extract the rules from nineteen standard samples. After the five steps mentioned in section 2, we get nineteen rules and qualities which correspond to the nineteen types of faults. Table 3 shows the rules and qualities. These
rules are concise and their qualities such as support, confidence and capture are sufficiently high. Majority of the confidences are 100%, with only five confidence a little less than 100% due to misclassification of the test data sets. Each rule’s capture is 100%, which means in the predictor space, all observations with this fault class sit closely to each other and the rule has been able to capture that part of the predictor space very well6). From the rules, we find thirteen out of all rules contain the S1 (running frequency) and eleven rules involve S10 (twice running frequency), so S1and S10 are important features for detecting the faults. And we also notice that each fault has their own characteristics which are different from others, which maybe provide us some other new methods of diagnosis.
Fig.9 Fault tree of aero-engine intelligent consequence
Fig.10 Intelligent diagnosis result of T1
Fig.11 Intelligent diagnosis result of T2
Fig.12 Intelligent diagnosis result of T3
Fig.13 Intelligent diagnosis result of T4
After getting the diagnosis rules, we will build a fault tree as shown in Fig. 9. Then the testing samples are used to testify the validity of these rules. T1, T2, T3 and T4 are inputted into the fault tree for intelligent consequence. Finally, the testing samples T1 to T4 are diagnosed respectively as: normal, LPC unbalance, HPR misalignment, LPR radial rubbing and LPR clearance vibration as shown in Fig.10~13.
Conclusion
This paper presented a vibration data acquisition and intelligent fault diagnosis system on aero-engine.
The structure of the hardware system is simple and reliable through the testing. The software system applies LabVIEW module design which is convenient to be modified and the development cycle is shortened.
The vibration data acquisition system can acquire aero-engine vibration data and take out real-time monitoring, off-line data analysis, trend analysis and fault simulation. When there is a fault alarm, intelligent diagnosis system can confirm the fault type.
The diagnosis system is based on SOFM neural network and decision tree. Finally, the consequence results can be concluded depended on information fusion of SOFM map and diagnosis tree. The system can be also applied for steam turbine, gas turbine, aero engine and other rotating machines.
References
1) B.S. Yang, D.S. Lim, and A.C.C. Tan, “VIBEX:
an Expert System for Vibration Fault Diagnosis of Rotating Machinery Using Decision Tree and Decision Table”, Expert Systems with Applications, vol.28, 2005, pp.735-742
2) IOtech,Inc. (1997). DaqBook/Daqboard/Daq PC-Card User’s Manual.
3) http://zone.ni.com/devzone/cda/tut/p/id/4292.
4) Hou, G. P. (2005). LabVIEW7.1 programming and VI design. Beijing: Tsinghua University.
5) D.X. Jiang, K. Li, G. Zhao, and J.H. Diao,
“Application of Fuzzy SOFM Neural Network and Rough Set Theory on Fault Diagnosis for Rotating Machinery”, Lecture Notes in
Computer Science,vol.3498, 2005, pp. 561–566 6) http://www.geocities.com/adotsaha/ctree