월악산 신갈나무림의 유기탄소 분포와 순환을 통한 생태계서비스 가치평가
Valuation of Ecosystem Services through Organic Carbon Distribution and Cycling in the Quercus mongolica Forest at Mt. Worak National Park
Ho-Yeon Won ・ Chang-Hwan Shin* ・ Hyeong-Tae Mun+
Ecosystem Services Research Team, National Institute of Ecology, Seocheon City, Korea Department of Biology, Kongju national University, Gongju City, Korea
요 약
월악산국립공원에 발달되어 있는 신갈나무림에서 2012년 월부터5 2013년 월까지 유기탄소 분포와 순환4
을 통한 생태계 서비스 가치를 파악하였다 지상부와 지하부 생물량에 분포되어 있는 유기탄소량은 각각.
및 이었으며 낙엽층과 토양의 유기탄소량은 각각
81.94 20.53 ton C/ , 6.49 ton C -1, 141.23 ton C -1
50 -depth-1 로 조사되였다 조사지 신갈나무림의 전체 유기탄소량은. 250.19 ton C -1 이었으며 이중,
가 식물체에 분포하였다 신갈나무림의 전체 유기탄소량을 원화로 환산하면 약 만원
41.0% . 527 -1의 가
치를 갖는 것으로 추정되었다 조사기간 동안 토양호흡을 통하여 방출되는 탄소량은. 7.31 ton C -1 yr-1 으로 이중 미생물호흡과 뿌리호흡을 통해 방출되는 탄소량은 각각 3.58, 3.73 ton C -1 yr-1이었다 유기. 탄소 순 생산량과 미생물호흡량의 차이로 추정했을 때 본 신갈나무림에서 연간 대기로부터 흡수하는 순 유기탄소는 1.61 ton C -1 yr-1로서 이를 원화로 환산하면 약, 33,000원 -1의 가치를 갖는 것으로 추정 되었다.
핵심용어: 탄소흡수 탄소저장 생태계서비스 가치평가 신갈나무, , , ,
Abstract
Valuation of ecosystem services through organic carbon distribution and cycling in the Quercus mongolica forest at Mt. Worak national park were investigated from May 2012 through April 2013. The amount of carbon allocated to above and below ground biomass was 81.94 and 20.53 ton C/ . Amount of organic carbon in litter layer was 6.49 ton C/ . Amount of organic carbon within 50 soil depth was 141.23 ton C
-1 50 -depth-1. Total amount of organic carbon in this Quercus mongolica forest was estimated to 250.19 ton C -1. The estimated amount of won in this Quercus mongolica forest in terms of total organic carbon was about 5.27 million won -1. The amount of carbon evolved through soil respiration was 7.31 ton C
-1 yr-1. The amount of carbon evolved through microbial respiration and root respiration was 3.58 and 3.73 ton C -1 yr-1, respectively. The amount of organic carbon absorbed from the atmosphere of this Quercus mongolica forest was 1.61 ton C -1 yr-1 when estimated from the difference between net primary production and microbial respiration. This amount will come to about 33,000 won -1 yr-1 in Korean currency.
Key words : Carbon absorption, Carbon storage, Ecosystem services, Valuation, Quercus mongolica
+ Corresponding autor : [email protected]
서 론 1.
생태계서비스는 인간의 관점에서 자연자원의 이익 을 평가하고 생태계의 가치를 기록하는 수단으로 갈 수록 중요성이 더해지고 있는 개념이고(Costanza et al., 1997; de Groot et al., 2002; MA, 2005), 자연생태
계의 보전과 현명한 이용에 대한 가치판단이 요구되 고 있는 현 상황에서 특히 관심을 가져야 할 부분이 다 특히 자연생태계가 제공하는 가치는 시장거래나. 정량화가 어렵기 때문에 저평가되고 있는 생태계의 가치를 재해석할 필요성이 있다(Koo et at., 2012).
최근 온실효과에 따른 기후변화에 전 세계적인 관 심이 집중되고 있으며 온실효과에 대한 기여도는, CO2가 가장 높은 것으로 알려져 있다. CO2는 자연적, 인위적인 활동을 통해 대기 중으로 방출되는 온실가 스 중의 하나이며 대기 중, CO2 농도는 산업화 이전 의 280 ppm에서 2005년에는 379 ppm으로 증가하였 고 연간, CO2 증가율이 최근 10년 동안 가장 높아 평 균 1.9 ppm yr-1의 증가를 보이고 있다(IPCC, 2007).
이에 따라 전 세계적으로 기후변화협약을 통해 탄소 배출권 저탄소녹색성장 녹색기술 에너지 절감 등의, , , 방법을 동원하여 온실가스를 줄이는 실질적인 방안을 논의하고 있으며, 2012년 제 18차 유엔기후변화협약
에서는 년까지 선진국의 온실가
(UNFCCC) 2013 2020
스 의무 감축을 규정하는 교토의정서 개정안이 채택 되었다.
육상생태계 중에서 산림생태계는 지상부 탄소축적 량의 약 90%와 지하부 탄소축적량의 40%를 차지하 고 있으며(Waring and Schlesinger, 1985), 지구에서 육 지와 대기 사이의 탄소순환이 해양과 대기 간 탄소순 환보다 크므로(Winjum et al., 1992) 산림생태계는 대 기 중 CO2의 농도 증가 억제를 위한 유용한 매개체 로서 큰 역할을 할 것으로 기대되고 있다 또한 산림. 청의 2010년 기준 산림의 공익기능 평가에 의하면 국 내 산림생태계 서비스를 경제적 가치로 환산했을 때, 산림생태계 서비스가 약 109조 원에 해당하는 가치를 가지는 것으로 추정 하였으며 이중 이산화탄소 흡수, , 산소생산 및 대기정화 기능을 가장 높은 구성비인
에 해당하는 조 천억 원으로 평가하였다
20.2% 22 6
(Korea Forest Service, 2012).
최근에는 토양으로부터 발생되는 CO2를 정량화하 여 산림생태계의 탄소 순환을 정확히 예측하려는 연 구가 진행되고 있으나(Nakane, 1995; Raich and
Tufekciolu, 2000; Lee and Mun, 2001; Lee et al., 우리나라의 산림식생 유형에 따른 각 구성원 2012),
별 탄소 저장량 및 이들 사이의 유동량과 탄소순환에 관한 연구는 많지 않은 실정이다(Han, 2002; Pyo et al., 2003; Lee and Mun, 2005; Namgung et al., 2008).
또한 생태계서비스의 평가는 매우 복잡하며 과학적으 로 초기 단계에 머물러 있고(Gitay et al., 2001;
이와 더불어 일부 개별연구자들에 의 Kremen, 2005),
해 기후 변화로 야기될 환경생태 및 자연자원의 경제 적 가치변화를 추산하거나 기후변화로 인해 발생하, 는 사회적 비용을 추산하는 환경 경제학적 연구가 수 행되고 있으나 생태계서비스의 수준에서 이를 파악, 한 연구는 전무한 실정이며(Brandera et al., 2012;
국내에서는 습지생태계 Wattage, 2011; Wunder 2005),
의 공익적 서비스에 관한 연구(Jeong et al, 2013)가 이루어진 바 있다.
본 연구는 국가장기생태연구사업의 일환으로 월악 산 국립공원에 형성되어 있는 신갈나무림의 탄소 저 장량 및 이산화탄소 흡수량을 정량적으로 파악하여 기후변화로 야기될 자연자원의 사회적 비용을 생태계 서비스의 수준에서 파악하는데 그 목적이 있다.
재료 및 방법 2.
조사지 개황 2.1.
월악산국립공원은 백두대간이 소백산을 지나 속리 산으로 연결되는 중간에 위치하며 행정구역상 충청, 북도 제천시 충주시 단양군과 경상북도 문경시에 걸, , 쳐 있는 산으로 주봉 영봉 의 높이는 해발( ) 1,097 m이 다 월악산 국립공원의 주요 식생은 낙엽활엽수림.
소나무 참나무림 신갈나무림 등
32.4%, - 16.7%, 12.4%
으로 이루어져 있다(Oh et al., 2005). 본 연구지소인 신갈나무림(Quercus mongolica Forest)은 충청북도 제‘ 천시 덕산면 선고리 일원의 남서사면으로써 경사는’ ,
이며 문수봉과 매두막 사이의 해발
26.7° , 900 m(N
에 위치하고 있 36° 51 34 , E 128° 12 53 )
다 한반도의 중남부 내륙에 위치하여 대륙성 기후의. 특색을 띠며 조사지소로부터, 20 km 떨어진 곳에 위 치한 제천기상대의 기상자료에 따르면 조사지역의 30 년간(1980년 2010 )년 평균기온은 10.2 , 연평균 강 수량은 1,387.8 mm 이었으며 조사기간 동안, (2012년
월 년 월 동안 연평균 기온은 연 강수
5 2013 4 ) 9.5 ,
량은1,377.4 mm 이었다.
현존량과 순생산량 2.2.
이차림의 경우 환경조건에 따른 종간 및 종내 경 쟁에 의하여 임목밀도가 자연적으로 조절되기 때문에 동일수종의 경우 지리적 차이에 따른 현존량 회귀식 을 다른 산림식생에 적용하더라도 적합도가 비교적 높은 것으로 보고된 바 있다(Schmit and Grifall, 1981;
Tritton and Hornbeck, 1982). 아울러 Kwon and 가 조사한 자료에 의하면 수고와 흉고직경 lee(2006c)
에 대한 지상부 흉고직경과 가지 줄기 및 잎의 무게( , ) 생물량 사이에는 높은 정의 상관관계가 있다고 보고 한 바 있다 산림군락의 현존량을 측정하는 방법으로. 는 흉고직경이 최소부터 최대의 수목이 포함되도록 직경별로 고르게 선정하여 벌목한 후 기관별 건중량 을 측정하는 수확법이 가장 좋은 방법으로 알려져 있 으나(Kang and Kwak, 1998), 본 조사지소는 국립공원 지역인 관계로 수확법을 적용하기가 불가능하여 기, 존에 보고된 상대생장식을 사용하였다.
신갈나무림의 상대생장식(Kang and Kwak, 1998) log Ws = 0.5526 log(D2H) - 0.1228 log Wb= 0.5188 log(D2H) - 0.9787
년 월에 장기생태연구지소의 영구방형구 내 2012 4
에서 직경이 2.5 cm 이상이 되는 수목의 흉고직경(D) 과 수고(H)를 측정하고, 2013년 4월에 1년간 생장한 흉고직경과 수고를 다시 측정하였다 매년 측정한 흉. 고직경과 수고를 상대생장식에 대입하여 현존량을 계 산하고 다음해의 현존량, (W2)에서 당년 현존량(W1)을 뺀 값을 각각 가지와 줄기의 연간 순생산량( W = W2 - W1)으로 추정하였다.
낙엽수의 잎과 생식기관은 당년에 생산되어 그 해 전부 고사하므로 연간 순 생산량은 조사지소에 설치, ( ) 되어 있는 낙엽주머니에서 수거된 연간 낙엽생산량을 이용하여 단위면적당(ha)으로 계산하였다.
현존량과 연순생산량에 대한 식물체 유기탄소량은 전체 건중량의 45%를 유기탄소량으로 추정하고 연간 유기탄소 순생산량은 다 (Houghton et al., 1983),
음해의 유기탄소량(C2)에서 당년 유기탄소량(C1)을 뺀 값을 각 기관별 연간 유기탄소 순생산량( C = C2 - C1)으로 계산하였다.
낙엽생산량 2.3.
낙엽생산을 통해 임상으로 유입되는 유기탄소량을
정량하기 위해 국가장기생태 조사지소 내에 설치된 입구의 넓이가0.5 인 원형 낙엽수거기(littertrap) 5개 에서 2012년 월부터5 2013년 월까지 매월 낙엽수거4 기에 들어있는 낙엽을 수거하였으며 수거한 낙엽은, 잎 목질부 가지와 수피 생식기관 기타 등으로 분류, ( ), , 한 다음60 건조기에서 48시간 이상 항량이 될 때 까지 건조시킨 후 칭량하였다 연간 낙엽수거기에서. 회수된 낙엽의 건량을 기초로 하여 단위면적( ) 당 낙엽생산량을 계산하고 연간 생산된 낙엽량의, 45%를 유기탄소량으로 계산하였다(Houghton et al., 1983).
임상 낙엽층 2.4.
임상 낙엽층의 낙엽량 및 유기탄소량을 정량하기 위하여 2012년 월부터6 2013년 월까지 매 분기마다3
개의 소형방형구를 영구방형구 외부에
5 25 x 25
임의로 설치 후 방형구 내에 있는 임상 낙엽을 L층
과 층 으로 구분하여
(litter layer) F (fermentation layer)
수거하였다 수거한 낙엽은 낙엽 목질부 생식기관. , , , 기타로 분류하였으며, 60 건조기에 항량이 될 때까 지 건조시킨 후 칭량하여 단위면적( )당 임상 낙엽 량을 계산하였으며 샘플은 마쇄하여 유기탄소량의, 측정에 사용하였다.
임상 낙엽층 유기탄소 분석 2.5.
마쇄한 샘플은 밀폐시켜 보관한 후 Elemental Analtzer(EA1112, Thermo Fisher Scientific Inc.)를 사 용하여 유기탄소를 분석하였다.
토양채취 및 유기탄소 분석 2.6.
년 월부터 년 월까지 매 분기별로 영구
2012 6 2013 3
방형구 밖의 임의로 선정한 세 지점에서 지표로부터
깊이까지 간격으로 토양을 채취하여 밀
50 10
봉한 후 실험실로 운반하였다 채취한 토양은 음건시. 켜 2 체로 친 후 석력함량을 계산한 후에 유기탄 소 분석에 사용하였다 음건 시킨 토양샘플. 5g을 도 가니에 넣고 105 건조기에서 48시간 이상 건조시 킨 후 칭량한 다음600 전기로에서 시간 정도 작4 열시켜 건중량에서 회분량을 빼어 토양의 유기물함량 을 계산하였다 유기물함량을. 1.724로 나누어 유기탄 소 함량을 계산하였으며(Black, 1965), 단위면적 당 50
깊이까지 분포하는 유기탄소량(ton C -1 50 -depth-1)은 토양의 유기탄소 함량에 가비중과 석력함 량을 곱하여 추정하였다.
2.7. 토양호흡
토양호흡을 통해 대기 중으로 방출되는 CO2 발생 량은 2012년 5월부터 2013년 4월까지 12개월 동안 정기적으로 매달 1회씩 11:00 13:00 사이에 10개 지점에서 각각 회씩 토양호흡을 측정하여 최대값과3 최소값을 제외한 값들의 평균값을 사용하였다 측정. 방법은 휴대용 적외선 가스 분석기(IGRA; EGM-4 PP
를 사용하여
system, UK) dynamic closed chamber 를 이용하였다 측정지점 간의 오차를 줄이기
method .
위해서 수관의 폭을 고려하여 수관이 서로 겹치는 임 의의 지점에서 토양호흡을 측정하였고 측정된 토양, 호흡량에서 51%를 뿌리호흡량으로 추정하였다 (Nakane, 1996).
유기탄소 저장량을 통한 생태계 서비스 가 2.8.
치평가
탄소 ton당 가치가 우리나라에서는 연구된 바 없으 므로 해외 연구사례에서 원단위를 도출하였다 자연. 적으로 저장된 탄소가 지속적으로 보존될 경우, ton당
약 원 년 기준 약 원 의 가치
20, 21,100 (2013 1,055 / ) 를 가지는 것으로 추정하고 있다(Douglas et al.,
원단위 도출에 앞서 세 가지 사항에 대해 가 2001).
정하였다 첫째 초기 투자비용은 없는 것으로 가정하. , 고 둘째 탄소를 보존함으로써 얻는 화폐가치는 매년, , 에서 변함이 없는 것으로 가정하였다 마지막으
20 .
로 산림을 보호하기 위해 추가적으로 발생하는 금액 은 무시하였다(Jung et al., 2011).
결과 및 고찰 3.
식물체의 유기탄소 분포량 및 순생산량 3.1.
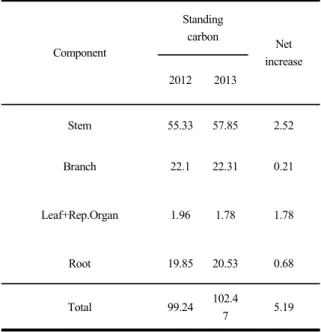
본 신갈나무림의 유기탄소 분포량은 2012년과 년에 각각
2013 99.24 ton C -1, 102.47 ton C -1 로 조사기간 중 평균, 99.69 ton C -1 이었다(Table 각 기관별 유기탄소 분포량은 줄기 가지 뿌
1). > >
리 > 잎과 생식기관의 순이었다 본 신갈나무림의 지. 상부 유기탄소량은 Kwon and Lee(2006a,b)가 조사한
전국의 신갈나무 유기탄소 분포량에서 한라산의
170.8 185.4 ton C -1 보다 낮게 나타났다.
은 유사한 산림군집의 경우 유령림에서 Kimmins(1987)
수령이 증가함에 따라 현존량과 순생산량이 모두 증
가한다고 보고한 바 있어 조사지소별 유기탄소 분포, 량의 차이는 임목밀도 수령 등의 차이에 따른 것으, 로 판단된다.
Component
Standing
carbon Net
increase 2012 2013
Stem 55.33 57.85 2.52
Branch 22.1 22.31 0.21
Leaf+Rep.Organ 1.96 1.78 1.78
Root 19.85 20.53 0.68
Total 99.24 102.4
7 5.19
Table 1. Standing carbon (ton C ㏊-1) in 2012 and 2013, and net increase of carbon (ton C ㏊-1 yr-1) of the Quercus mongolica forest in the study area
조사기간 동안 신갈나무림의 유기탄소 순생산량은 5.19 ton C -1 yr-1이었고 인접지역 신갈나무림의, 4.78 ton C -1 yr-1(Song et al., 1997) 과비슷하였으 며, Park(1999)이 조사한 5.88 ton C -1 yr-1보다는 다소 낮았는데 이는 조사지소 별 임목밀도 수령 토, , 양의 비옥도등의 차이에 따른 것으로 판단된다(Lee and Mun, 2005; Choi et al., 2006).
낙엽생산을 통해 임상으로 유입되는 유기 3.2.
탄소량
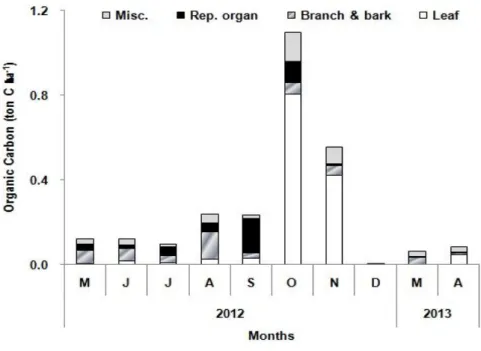
본 조사지소에서 낙엽의 생산은 연중 계속되었으 며 낙엽생산을 통해 임상으로 유입되는 유기탄소량, 은10월과11월에 각각 전체 낙엽량의38.9%(0.94 ton
및 로 가을철에 집중되는
C/ ) 20.9%(0.51 ton C/ ) 것으로 나타났다(Fig. 1).
조사기간 동안 낙엽생산을 통해 임상으로 유입되 는 유기탄소량은 2.42 ton C -1 yr-1이었다 연간 생. 산된 낙엽의 기관별 유기탄소 분포량은 잎(57.1%) >
목질부(18.8%) > 기타(16.6%) > 생식기관(16.3%)의 순 이었다.
Fig. 1. Seasonal organic carbon of litterfall in the Quercus mongolica forest in the study area (Rep. organ : Reproduction organ, Misc. : Miscellaneous).
본 신갈나무림에서 낙엽에 의하여 임상에 유입되 는 유기탄소량은 Lee(2011)가 보고한 서울 남산의 신 갈나무림의 2.89 ton C -1 yr-1, Kang and Han(2004) 이 충북 속리산 국립공원 신갈나무림에서 보고한 2.40 ton C -1 yr-1과 유사하였으며 또한 인접지역의, 월악산 국립공원 굴참나무림(Namgung, 2010)의 2.42 ton C -1 yr-1,중부지방의 낙엽탄소량인 2.5 ton C
-1 yr-1 (Jo and Han, 1999), 미국과 유럽의 여러 온대 림에서 낙엽 낙지에 의한 탄소유입량 2.6 ton C -1 yr-1(Edwards et al., 1989)와도 유사하였다.
임상 낙엽층의 유기탄소량 3.3.
본 신갈나무림에서 조사기간 동안 임상 낙엽층에 분포하는 평균 유기탄소량은 6.49 ± 0.6 ton C -1 이었다 층위별 유기탄소량은. L층이 2.51 ± 0.49 ton C -1, F층이 3.97 ± 0.66 ton C -1로 나타나 층이F
층보다 다소 높게 나타났다 임상 낙엽층의
L (Table 2).
유기탄소량은 L층은 낙엽생산이 왕성한 가을부터 이 듬해 봄에 높고 층은 여름철에 높다가 가을철에 낮F 았다 임상 낙엽층의 유기탄소량은 낙엽의 분포량과. 도 일치하는데 이것은 낙엽의 양이 많을수록 유기탄 소의 양이 많기 때문인 것으로 판단되며 여름철의, 많은 강수량과 높은 온도에 의해 분해자와 균류의 분 해활동이 활발해 분해가 빠르게 진행되기 때문인 것 으로 판단된다(Mun, 2004). Han(2002)은 속리산 신갈 나무림에서 낙엽층의 유기탄소량은 L층 2.31 ton C
-1, F층 2.92 ton C -1로 보고하였고, Park and 는 지리산 신갈나무림에서 낙엽층 층과
Lee(1981) (L F
층 의 유기탄소량을 각각) 0.98 및 2.20 ton C -1으로 보고하여 본 연구의 결과보다 모두 적었다 이상과. 같이 지역에 따라 임상 낙엽층에 분포하는 유기탄소 량이 차이를 보이고 있는데 이는 전술한 바와 같이, 지역과 수종에 따른 낙엽생산량 및 낙엽분해율의 차 이에 의한 것으로 판단된다.
Date Layer
L F Total
Jun. 2012 1.36 ± 0.29 6.02 ± 0.85 7.38 ± 1.05
Sep. 2012 1.97 ± 0.51 5.25 ± 1.68 7.22 ± 1.57
Dec. 2012 4.01 ± 1.18 2.77 ± 0.48 6.78 ± 1.63
Mar. 2013 2.70 ± 0.40 1.85 ± 0.61 4.56 ± 1.00
Mean 2.51 ± 0.49 3.97 ± 0.66 6.49 ± 0.60
Table 2. Seasonal changes of organic carbon (ton C ㏊-1) in litter layer of the Quercus mongolica stand (mean ± SD)
토양의 유기탄소 분포량 3.4.
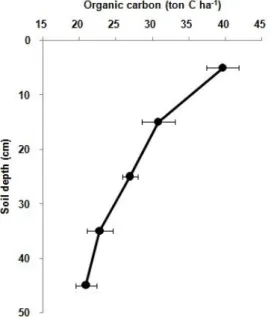
토양 내 분포하는 유기탄소량은 유기물함량 토양, 가비중 석력함량 등을 이용하여 추정하는 방법이 일, 반적으로 많이 이용되고 있으며(Arnold, 1995), 토양 내 유기탄소량은 일반적으로 깊이가 깊어질수록 지수 적으로 감소하는 것으로 알려져 있다(Eswaran et al., 이는 일차적으로 임상으로 유입되는 유기물량 1995).
과 관련이 있다.
본 신갈나무림 내 토양 50 깊이까지의 평균 유기탄소량은 141.23 ton C -1 50 -depth-1이었으며, 상층토(0 10 )와 50 깊이에서 각각 39.69, 20.92 ton C -1 10 -depth-1로 상층토에 분포하는 유기탄소량이 높았다 (Fig. 2). 유기탄소량이 상층토에 서 가장 높게 나타난 것은 지상부로부터 유입된 낙 엽 가지나 줄기 같은 유기물이 분해되어 표토층으로, 유입되었기 때문이며(Armson, 1977), 세근 또한 표토 층 깊이에 주로 분포하여(Park and Yim, 2004; Ruess 계절변화에 따른 뿌리조직 고사로 인해 et al., 1996)
토양 내 유기물량 증가에 기인하는 것으로 판단된다.
Fig. 2. Variation of organic carbon along the soil depth of the Quercus mongolica forest in the
study area. Bars indicate SD.
토양호흡량 3.5.
토양호흡은 크게 미생물호흡과 뿌리호흡의 합으로 나타내어진다(Hanson et al., 2000). 본 신갈나무림에서 조사기간 동안 평균 토양호흡량은 0.67 g CO2 m-2 hr-1이었다 계절에 따른 토양호흡량은. 7월에 1.75 g
CO2 m-2 hr-1로 가장 높았으며 12월에 0.02 g CO2 m-2 hr-1로 가장 낮아 동절기에서 하절기로 갈수록 토양, 호흡량이 증가하는 경향을 보였다(Fig. 3). 이는 토양 온도와 토양수분의 증가에 따른 미생물 활동이 활발 하게 이루어져 미생물호흡을 통해 방출되는 CO2의 증가 및 식물생장에 따른 뿌리호흡을 통해 방출되는 CO2의 증가에 기인하는 것으로 판단된다 이와 같이. 계절변화로 인한 토양온도와 토양호흡간의 정의 상관 관계를 갖는 현상은 많은 연구에서 보고된 바 있다 (Son and Kim, 1996; Lee and Mun, 2001; Han, 2002;
Lee and Mun, 2005; Dulohery et al., 1996; Moon et al., 2001; Kim et al., 2009).
Fig. 3. Seasonal soil respiration of the Quercus mongolica forest in the study area.
본 신갈나무림의 평균 토양호흡량은 Singh and 가 온대지방의 여러 산림생태계에서 측정 Gupta(1977)
한 결과를 종합하여 보고한 토양호흡량(0.01 1.00 g CO2 m-2 hr-1)범위에 포함되는 것으로 나타났다. Ryan 는 산림의 토양호흡은 토양이 비옥하거 and Law(2005)
나 유기물량이 높을수록 증가한다고 보고한 바 있어, 조사지소 별 토양호흡량의 차이는 산림식생을 구성하 는 우점종 낙엽생산과 분해의 차이에 의한 토양 유, 기물량 등과 같은 생물학적 요인과 토양온도와 토양 수분 등의 환경적 요인에 따른 것으로 판단된다(Lee et al., 2013).
산림생태계의 순 생태계생산량은 순일차생산량과 미생물호흡에 의해 결정되므로 순 생태계생산량을 측 정하기 위해서는 미생물호흡과 뿌리호흡의 정확한 추 정이 필요한 것으로 알려져 있다(Lee et al., 2003).
는 일본의 낙엽활엽수림에서 토양호흡중 Nakane(1996)
뿌리호흡이 차지하는 비율이 51% 정도를 차지한다고
보고한 바 있다 본 신갈나무림에서 토양호흡을 통해. 대기 중으로 방출되는 CO2중 약51%를 뿌리호흡량으 로 감안하였을 때 미생물호흡과 뿌리호흡을 통해 방, 출되는 유기탄소량은 각각 3.58, 3.73 g CO2 m-2 hr-1 으로 추정되었다
신갈나무림의 유기탄소 분포 및 순환을 통 3.6.
한 생태계 서비스 가치평가
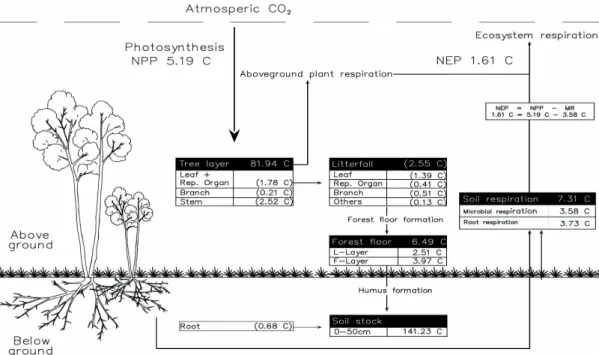
본 신갈나무림의 각 탄소저장고 별 유기탄소 분포 와 수지를 Fig. 4에 종합하였다 조사기간 동안 각 구. 성원별 유기탄소 분포량은 지상부 생물량에 81.94 ton
지하부 생물량에 로
C/ (41.0%), 20.53 ton C/ (8.2%) 식물체 전체에 102.47 ton C/ 가 축적되어 있었다. 그리고 임상 낙엽층에 6.49 ton C/ (2.6%), 토양에
로 토양에 가장 많은 탄소가 141.23 ton C/ (56.4%)
분포하고 있었다 순 광합성을 통하여 식물체에 고정. 된 유기탄소량은5.19 ton C -1 yr-1이었고 토양호흡, 을 통하여 방출되는 탄소량은 7.31 ton C -1 yr-1로 이중 미생물호흡과 뿌리호흡을 통해 방출되는 탄소량 은 각각3.58, 3.73 ton C -1 yr-1이었다 유기탄소 연. 순생산량(NPP) 5.19 ton C -1 yr-1과 미생물호흡량 3.58 ton C -1 yr-1의 차이로 추정하였을 때 본 신갈 나무림의 순 생태계생산량(NEP)은 1.61 ton C -1 yr-1이었다 따라서 본 신갈나무림이 대기중의. , CO2를 순 흡수하여 대기환경 개선에Positive(+) 요인으로 작 용하였으며 유기탄소 흡수원으로서의 역할을 수행하, 는 것으로 나타났다.
Fig. 4. Compartment model showing the distribution and flow organic carbon of the Quercus mongolica forest in the study area Box: standing carbon (ton C ㏊-1), arrow: flux (ton C ㏊-1 yr-1). Parenthesis
indicate NPP (ton C ㏊-1 yr-1).
본 연구를 바탕으로 Douglas 등(2001)의 탄소ton당 가치를 환산해 보았을 때 본 신갈나무림 연구지소의, 이산화탄소 흡수량의 가치는 약 33,971 /원 으로 추 정되었으며 탄소저장 가치는 약, 527만원/ 으로 추 정되었다 월악산 국립공원의 전체 면적인. 28,778 의 12.4%인 신갈나무림의 면적(3,568 )을 바탕으로 생태계 서비스 가치를 추정해보면 월악산의 신갈나, 무 군락에 저장된 탄소의 가치는 약 188억 3,799만원 으로 추정되었고 연간 약 억, 1 2122만원 가치의 이산
화탄소를 흡수하는 것으로 나타났다.
전 지구적 규모의 평가와 신속한 평가를 할 때에 는 생태계와 토지 피복에 따른 서비스와 경관 기능의 평가를 통해 대상지역의 경제적 가치 평가를 수행한 다(Naidoo and Ricketts, 2006; Troy and Wilson, 2006).
반면 일정한 지역의 생태계서비스 가치는 경제적 가, 치 이외에 자연보호구역 등 특정 위치의 토지 피복상 태 뿐만 아니라 도로로부터의 거리 등 주변기역의 특 성과 접근성에 따라 서비스의 가치가 달라지므로(Koo
정확한 가치평가를 위해서는 주변지역에 et al, 2012),
대한 보다 정밀한 평가가 필요할 것으로 판단된다. 감사의 글
4.
본 논문은 환경부의 국가장기생태연구사업 의 지“ ” 원을 받아 수행되었음.
참고문헌 5.
Armson, KA (1977). Forest Soils: Properties and Processes. University of Toronto Press, pp. 390, toronto, Canada
Arnold, RW (1995). Role of soil survey in obtaining a global carbon budget. In Soils and Global Change.
R Lal, J kimble, E Levine and BA Stewart (eds), pp. 257-263.
Black, CA (1965). Methods of Soil Analysis. Part 1.
Physical and Mineralogical Properties, Including Statistics of Measurement and Sampling. American Society of Agronomy.
Brandera, LM, Wagtendonkb, AJ, Hussainc, SS, McVittiec, A, Verburgb, PH, de Groot, RS, van der Ploegd, S (2012). Ecosystem service values for mangroves in Southeast Asia: A meta-analysis and value transfer application. Ecosystem Services 1, pp.
62-69.
Choi, HJ, Jeon, IY, Shin, SH, Mun, HT (2006). Soil properties of Quercus variabilis forest on Yongha valley in Mt. Worak National Park. J. of Ecology and Environment, 29(5), pp. 439-443. [Korean Literature]
Costanza, R, d'Arge, R, de Groot, R, Farber, S, Grasso, M, Hannon, B, Limburg, K, Naeem, S, O'Neill, RV, Paruelo, J, Raskin, RG, Sutton, P, van den Belt, M (1997). The value of the world's ecosystem services and natural capital, Nature, 387, pp.
253-260.
de Groot, RS, Wilson, M, Boumans, MJ (2002). A typology for the classification, description and valuation of ecosystem functions, goods and services, Ecological Economics, 41, pp. 393-408.
Douglas, CM, Elizabeth, ID, David AE (2001).
Modelling the non-market environmental costs and benefits of biodiversity projects using contingent
valuation data, Environmental and Resource Economics, 18(4), pp. 391-410.
Dulohery, CJ, Morris, LA, Lowrance, R (1996).
Assessing forest soil disturbance through biogenic gas fluxes. Soil Science Society of America Journal, 60(1), pp. 291-298.
Edwards, NT, Johnson, DW, McLaughlm, SB, Harris, WF (1989). Carbon dynamics and productivity.
Analysis of Biogeochemical Cycling Processes in Walker Branch Watershed, DW Johnson and RI van Hook (eds), Springer. pp. 197-232
Eswaran, H, Van den Berg, E, Reich, P, Kimble, J (1995). Global soil carbon resources. Soils and Global Change, R Lal, JM Kimble, Levine, E. and BA Stewart (eds). CRC-Press. pp. 27-44.
Gitay, H, Brown, S, Easterling, W, Jallow, B (2001).
Ecosystems and their goods and services. Climate Change 2001: impacts, adaptation, and vulnerability. Contribution of Working Group II to the Third Assessment Report of the IGBP on Climate Change, (JJ McCarthy, OF Canziani, NA Leary, DJ Dokken and KS White (Eds.), Cambridge University Press. Cambridge, pp. 235-342
Han, DY (2002). Carbon cycling modelling by litter decomposition rate and estimation of carbon dioxide budget in Quercus mongolica forest at Mt.
Songni National Park. Ph.D. Dissertation, Chungbuk National University, Chungju, Korea. [Korean Literature]
Hanson, PJ, Edwards, NT, Garten, CT, Andrews, JA (2000). Separation root and soil microbial contributions to soil respiration: A review of methods and observation, Biogeochemistry, 48, pp.
115-146.
Houghton, RA, Hobbie, JE, Melillo, JM, Moore, B, Peterson, BJ, Shaver, GR, Woodwell, GM (1983).
Changes in the carbon content of terrestrial biota and soils between 1860 and 1980: A net release of CO2 to the atmosphere, Ecological Monographs, 53, pp. 235-262.
IPCC (2007). Climate Change 2007: Synthesis Report.
Contribution of Working Group , and to the 4th Assessment Report of the Intergovernmental Panel on Climate Change. IPCC, Geneva, Switzerland.
Jo, HK and Han, GS (1999). Comparison of soil characteristics and carbon storage between urban and natural lands, J. of Forest Science, 15, pp.
71-76. [Korean Literature]
Jeong, HM, Kim HR, You YH, (2013). A study on the ecosystem services of wetland 1. Effective biological control of the Mosquito larvae using native fishes.
J. of Wetlands Research, 15(1), pp. 19-24. [Korean Literature]
Jung, DJ, Kang, KH, Heo, J, Son, MS, Kim, HS (2011). Valuation of biodiversity and ecosystem services using national forest inventory data. Korean Society of Environmental Impact Assessment, 5, pp.
615-625. [Korean Literature]
Kang. SJ and Han, DY (2004). Nutrients and decomposition rate accumulated on soil layers in Quercus mongolica forest at Mt. Songni National Park, Kor. J. of Environmental Biology, 22(1), pp.
93-100. [Korean Literature]
Kang, SJ and Kwak, AK (1998). Comparisons of phytomass and productivity of watershed forest by allometry in South Han River, Korea Forestry Energy Research Society, 17(1), pp. 8-12.
Kimmins, JP (1987). Forest ecology. MacMillan Publishing Company, New York
Kim, SB, Jung, NC, Lee, KH (2009). Soil CO2 efflux and leaf-litter decomposition of Quercus variabilis and Pinus densiflora stands in the Southern Region of Korean Peninsular. J. of Korean Forestry Society, 98(2), pp. 193-188. [Korean Literature]
Koo, MH, Lee, DK, Jung, TY (2012). A study on the contexts of ecosystem services in the policy making process. J. Korean Society of Environmental Restoration Technology, 15(5), pp. 85-102. [Korean Literature]
Korea Forest Service (2012). Pubilc function evaluation of forest in 2010. http://www.forest.go.kr /newkfsweb/html/printpage.do?mn=KFS_09_10 [Korean Literature]
Kremen (2005). Managing ecosystem services: What do we need to know about their ecology, Ecology Letters, 8, pp. 468-479.
Kwon, KC and Lee, DK (2006a). Energy content of Quercus mongolica stands in Korea with respect to
latitude and altitude. J. Korean Forest Society, 95(3), pp. 299-308. [Korean Literature]
Kwon, KC and Lee, DK (2006b). Biomass and annual net production of Quercus mongolica stands in Mt.
Joongwang with respect to altitude and aspect. J.
Korean Forest Society, 95(4), pp. 398-404. [Korean Literature]
Kwon, KC and Lee, DK (2006c). Above- and below-ground biomass and energy content of Quercus mongolica. Korea Forestry Energy Research Society, 25(1), pp. 31-38. [Korean Literature]
Lee, JY, Kim, DK, Won, HY, Mun, HT (2013).
Organic carbon distribution and budget in the Pinus densiflora forest at Mt. Worak National Park. Kor.
J. of Environment and Ecology, 27(5), pp. 561-570.
[Korean Literature]
Lee, KJ and Mun, HT (2005). Organic carbon distribution in an oak forest. J. Ecology and Environment, 28(5), pp. 265-270. [Korean Literature]
Lee, KJ, Won, HY, Mun, HT (2012). Contribution of root respiration to soil respiration for Quercus acutissima forest. Kor. J. of Environment and Ecology, 26(5), pp. 780-786. [Korean Literature]
Lee. MS, Nakane, K, Nakatsubo, T, Koizumi, H (2003). Seasonal changes in the contribution of root respiration to total soil respiration in a cool-temperate deciduous forest. Plant and Soil, 255, pp. 311-318. [Korean Literature]
Lee, SK (2011). Production and litter decomposition and organic carbon distribution in Pinus densiflora and Quercus mongolica and Robinia pseudoacacia forests at Mt. Nam. Master`s Thesis. Kongju National University. Gongju. Korea. [Korean Literature]
Lee, YY and Mun, HT (2001). A study on the soil respiration in a Quercus acutissima forest. J. of Ecology and Environment, 24(3), pp. 141-147.
[Korean Literature]
Millenium Ecosystem Assessment(MA), (2005).
Ecosystems and Human Well-being : Multiscale Assessment. Millennium Ecosystem Assessment Series. 4. Washington. DC (Island Press). Google Books. [Korean Literature]
Moon, HS, Jung, SY, Hong, SC (2001). Rate of soil
respiration at black locust (Robinia pseudo-acacia) stands in jinju area, J. of Ecology and Environment, 24(6), pp. 371-376. [Korean Literature]
Mun, HT (2004). Decay rate and nutrients dynamics during decomposition of Oak branches. J. of Ecology and Environment, 27(2), pp. 97-98.
[Korean Literature]
Naidoo, R and Ricketts, TH, (2006) Mapping the economic costs and benefits of conservation. PLoS Biology, 4(11), pp. 2153-2164
Nakane K (1995). Soil carbon cycling in a Japanese cedar(Cryptomeria jaopnica) plantation. Forest Ecology and Management, 72, pp. 185-197.
Nakane, K, Kohno, T, Horikoshi, T (1996). Root respiration rate before and just after clear-felling in a mature, deciduous, broad-leaved forest. Ecological Research, 11, pp. 111-119.
Namgung, J, Choi, HJ, Han, AR, Mun, HT (2008).
Organic carbon distribution and budget in the Quercus variabilis forest in the Youngha valley of Worak National Park. Kor. J. of Environmental Biology, 26(3), pp. 170-176. [Korean Literature]
Namgung, J (2010). Production and nutrient cycling in the Quercus variabilis forest in Mt. Worak. Ph. D Dissertation, Kongju National University. Gongju.
Korea. [Korean Literature]
Oh, KK, Park, SK, Shim, HY, Kim, TH (2005). Actual vegetation and management in the Woraksan National Park, Kor. J. of Environment and Ecology, 19(2), pp. 119-129.
[Korean Literature]
Park, BK and Lee, IS (1981). A model for litter decomposition of the forest ecosystem in South Korea. J. of Ecology and Environment, 4(1,2), pp.
38-51. [Korean Literature]
Park, GS (1999). Aboveground and soil carbon storages in Quercus mongolica and Quercus variabilis natural forest ecosystems in Chungju. J. of Korean Forest Society, 88(1), pp. 93-100. [Korean Literature]
Park, GS and Lim, JG (2004). Annual carbon storage by fine root production in Quercus variabilis forests. Kor. J. of Environment and Ecology, 17(4), pp. 360-365. [Korean Literature]
Pyo, JH, Kim, SU, Mun, HT (2003). A study on the
carbon budget in Pinus koreansis plantation. J. of Ecology and Environment, 26(3), pp. 129-134.
[Korean Literature]
Raich, JW and Tufekcioglu, A (2000). Vegetation and soil respiration: correlations and controls.
Biogeochemistry, 48, pp. 71-90.
Ruess, RW, Van Cleve, K, Yarie, J, Viereck, LA (1996). Contributions of fine root production and turnover to the carbon and nitrogen cycling in taiga forests of the Alaskan interior, Can. J. of Forest Research, 26(8), pp. 1326-1336.
Ryan, MG and Law, BE (2005). Interpreting, measuring, and modeling soil respiration.
Biogeochemistry, 73, pp. 3-27.
Schmitt, MDC and Grigal, DF (1981). Generalized biomass estimation equations for Betula papyrifera Marsh. Can. J. of Forest Research, 11, pp. 837 840.
Singh. JS and Gupta, SR (1977). Plant decomposition and soil respiration in terrestrial ecosystems, The botanical review. 43, pp. 449-528.
Son, YH and Kim, HW (1996). Soil respiration in Pinus rigida and Larix leptolepis plantations. J. of Korean Forest Society, 85(3), pp. 496-505. [Korean Literature]
Song, CY, Chang, KS, Park, KS, Lee, SW (1997).
Analysis of carbon fixation in natural forests of Quercus mongolica and Quercus variabilis. J. of Korean Forest Society, 86(1), pp. 35-45. [Korean Literature]
Tritton, LM and Hornbeck, JW (1982). Biomass equations for major tree species of the Northeast, United States Department of Agriculture Forest Service, Northeastern Forest Experiment Station, General Technical Report, NE-69.
Troy, A and Wilson, MA, (2006) Mapping ecosystem services : Practical challenges and opportunities in linking GIS and value transfer. Ecological Economics, 60(2), pp. 435-449
Waring, RH and Schlesinger, WH (1985). Forest Ecosystems; Concept and Management. Academic Press, New York,
Wattage P (2011). Valuation of ecosystem services in coastal ecosystems: Asian and European perspectives. Ecosystem Services Economics
Working Paper Series.
Winjum, JK, Dixon, RK, Schroeder, PE (1992).
Estimating the global potential of forest and agroforest management practices to sequester carbon. Water, Air and Soil Pollution , 64, pp.
213-227.
Wunder S (2005). Payment for environmental services:
Some nuts and bolts. CIFOR Occasional Paper No.
42.
논문접수일: 2014년03월19일
○
심사의뢰일: 2014년03월21일
○
심사완료일: 2014년05월15일
○