한국지하수토양환경학회 추계학술발표회 2006년 10월 12일∼13일 KAIST
낙동강 하류 강변퇴적층의 수리지질학적 이방성
정재열, 함세영, 이정환, 김형수*, 석희준*, 김태원 부산대학교 지구환경시스템학부
*한국수자원공사 수자원연구원 [email protected]
요 약 문
Significant anisotropy is often found in stream deposits and riverside deposits due to sedimentation facies change. However, practically, we assume riverside deposits as homogeneous and isotropic media which is more convenient to determine hydraulic parameters. In this study, we disclosed anisotropy of a riverside deposit located in Daesan-Myeon area, Changwon City. The riverside deposit is utilized for producing riverbank filtration water from seven pumping wells to provide municipal water. For studying the deposit, we used drilling data and pumping test data. The sand/gravel layer acting main aquifer
is thicker near the Nakdong River and the eastern part of the study area.The pumping tests were conducted on the seven wells to obtain water-level measurements. This groundwater-level measurement data was applied to anisotropy interpretation methods and isotropic leaky aquifer methods. The result of the interpretation indicates that considering anisotropy is superior to isotropic method. For the anisotropy analysis, it is needed to decide the maximum principal component of the transmissivity tensor (
), the minimum principal component of the transmissivity tensor (
), and principal tensor direction ( ). The anisotropy analysis resulted in 1.359×10
-1m
2/sec of
, 6.413×10
-3m
2/sec of
, and N37°E of
, using the pumping well PW1 and the observation wells PW4 and PW5. From the result, the anisotropy ratio (
) is calculated as 21.2, indicating that permeability of the riverside deposit is higher in sub-parallel direction to the Nakdong River even though a small difference exists between the major groundwater flow direction (N36°E) and the Nakdong River flow direction (N71°E).
key word : Nakdong River, riverside deposit, hydrogeological anisotropy.
1. 서론
일반적으로 충적층 대수층은 균질, 등방성 매체이라고 가정하여 수리시험분석을 한
다. 그러나 강변퇴적층에서는 퇴적상에 따라 대수층내 수리전도도 분포가 수평적인 불균질 성과 이방성을 가지게 되며, 이에 따라 지하수 흐름도 이방성을 가지게 된다. 이때 주된 지 하수 흐름은 하천의 흐름 방향과 거의 평행한 방향을 보인다. 이러한 지하수 투수성의 이방 성은 풍성 모래층과 해안 퇴적층에서도 전형적으로 나타난다(Kruseman and De Ridder, 1983).
본 연구에서는 창원시 대산면 취수장 지역 강변퇴적층의 퇴적상에 의한 대수층의 수리지질학적 이방성을 파악하고자 한다. 이 지역에는 7개 취수정(PW1~PW7)이 강변여과 수 개발을 위하여 설치되어 있다. 또한 이 7개의 취수정과 8개의 관측정의 시추자료로부터 얻어진 강변퇴적층의 퇴적상과 이방성을 비교, 검토하였다. 7개의 취수정의 양수시험자료를 등방성의 누수피압대수층 모델(Hantush and Jacob, 1955)과 이방성의 누수피압대수층 모델 (Hantush, 1966)에 입력하여 수리상수를 산출하였다. 이방성 모델로부터는 최대투수계수, 최 소투수계수, 투수량계수의 주방향, 투수량계수의 이방성 비율을 구하였다.
2. 낙동강 하류 강변퇴적층의 수리층서적 특성
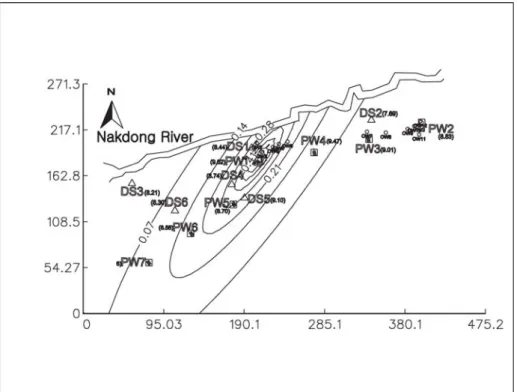
연구지역 7개의 취수정(PW1~PW7)과 8개의 관측정(DS1~DS8)의 시추자료에 의 하면, 지표로부터 세립질 모래층, 중립질 모래층, 세립질 모래층, 모래자갈층으로 구성되어 있으며, 모래자갈층이 주 대수층을 이루고 있다. 모래층의 평균두께는 30.9m, 모래자갈층은 12.5m, 풍화대는 17.6m이다. 모래자갈층의 두께는 PW1, PW2, PW3, PW4호정과 DS1, DS2, DS4, DS8호공 부근이 두껍고(13.2m ~ 17.5m), PW5, PW6, PW7호정과 DS3, DS5, DS6호 공 부근은 얇다(6.3m ~ 10.5m). 즉, 낙동강쪽으로 가까울수록, 동쪽으로 갈수록 모래자갈층 이 두꺼워지는 경향성을 보인다.
3. 낙동강 하류 강변퇴적층의 수리학적 특성
연구지역의
7개의 취수정에 대하여 하나의 취수정에서 양수를 할 때, 주변의 나머 지 취수정에서는 지하수위변화를 관측하는 방식으로 총 7회에 걸쳐 양수시험을 실시하였다.양수량은 취수정에 따라 1248~3384 m3/day로 다르며, 모든 지하수공에는 자동수위 측정기 를 설치하여 1초 간격으로 지하수위 변화를 관측하였다. 앞에서 언급한 바와 같이, 양수시험 분석은 등방성의 누수피압대수층 모델(Hantush and Jacob, 1955)과 이방성의 누수피압대수 층 모델(Hantush, 1966)을 이용하였다.
이방성을 고려하는 2차원, 이방성, 부정류상태의 무한 확장 피압대수층과 누수피압 대수층에 적용되는 편미분 방정식은
과 같다. 여기서, 는 수위강하(L), , , 는 피압대수층에서의 투수계수(L2/T),
는 대수층의 수리전도도(L/T), 는 누수층의 두께(L), 는 i번째 우물의 양수율(L3/T),
는 i번째 우물의 x좌표(L), 는 i번째 우물의 y좌표(L), 는 디락 델타 함수, 는 대수층의 저류계수, 은 적어도 하나 이상의 우물의 개수이다. 대수층의 이방성을 고려할 경우 투수
계수는 ≠ 이고, 이다. 원형좌표계에서 최대투수량계수()와 최소투수량 계수()는
∙
∙
로 나타낼 수 있다. 여기서, 대수층의 이방성 율은 이며, 이방성의 주방향( )은
과 같다. 이방성 분석에는 Waterloo Hydrogeologic, Inc.의 Prince 3.0 (Cleary and Ungs, 1994)을 이용하였다.
이방성 분석에서는 낙동강에 직각방향의 투수량계수를 Txx
라고 하고, 수평방향의 투수량계수를 T
yy라고 가정하였다. 이방성의 최대투수량계수
는 1.359×10
-1m
2/sec, 최 소투수량계수는 6.413×10
-3m
2/sec이고, 따라서 이방성율
는 21.2로 나타났다. 그리고 투수량계수의 주방향
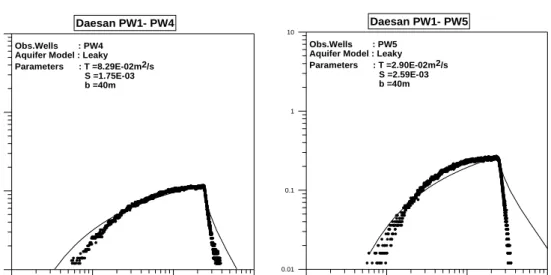
는 N37°E 이다(Fig. 1). 한편 동일한 시험정에 대하여 등방성 모델 을 적용했을 때, PW4호공의 투수량계수는 8.29×10
-2m
2/sec, PW5호공의 투수량계수는 2.90×10
-2m
2/sec였다,
Fig. 1. Groundwater level distribution obtained from anisotropy analysis.
10 100 1000 10000 0.01
0.1 1 10
Daesan PW1- PW4
Obs.Wells : PW4 Aquifer Model : Leaky Parameters : T =8.29E-02m2/s S =1.75E-03 b =40m
10 100 1000 10000
0.01 0.1 1 10
Daesan PW1- PW5
Obs.Wells : PW5 Aquifer Model : Leaky Parameters : T =2.90E-02m2/s S =2.59E-03 b =40m
Fig. 2 Pumping test analysis using isotropic leaky aquifer model (Hantush, 1955)
4. 결론
창원시 대산면 강변여과수 취수부지의 강변퇴적층의 퇴적상과 연관된 대수층의 이 방성을 파악하였다. 이를 위하여 이방성모델을 이용하여 양수시험분석을 실시한 결과,
최대 투수량계수
는 1.359×10
-1m
2/sec, 최소투수량계수는 6.413×10
-3m
2/sec, 이방성 비율은 21.2 그리고 투수량계수의 주방향은 N37°E로 나타났다. 또한 이방성모델 분석과 등방성모델 분석을 비교하면, 이방성 모델이 퇴적상 및 지하수 흐름에 더 잘 맞음을 알 수 있다. 또한,
낙동강의 흐름 방향이 지하수의 흐름의 이방성에 영향을 미치고 있음을 알 수 있다.5. 사사
본 연구는 21세기 프런티어 연구개발사업인 수자원의 지속적확보기술개발사업단의 연구비지원(과제번호 3-4-2)으로 수행되었으며, 이에 감사드린다.
6. 참고문헌
Cleary, Robert W. and Ungs, Michael J., 1994, Princeton Analytical Models of Flow and Mass Transport, Waterloo Hydrogeologic Software, 85 pp.
Kruseman, G.P.. and De Ridder, N.A., 1983, Analysis and evaluation of pumping test data, 3rd ed., Bull. 11, Intern. Inst. for land Reclamation and Improvement, Wageningen, The Netherlands, 200p.
Hantush, M.S. and Jacob, C.E., 1955. Non-steady radial flow in an infinite leaky aquifer.
Amer. Geophy. Union Transactions, 36, 95-100.
Hantush, M.S., 1966, Analysis of data from pumping tests in anisotropic aquifers, Jour.
Geophys. Res., 71, 421-426.