INTRODUCTION
The dry-milling process has been commonly used due to the procedure’s simplicity and time efficiency(Chiang PY & Yeh Al, 2002; Chen JJ. et al., 1999 ; Meuser F. et al., 1979). The wet-milling process, which involves softening the rice before grinding, was used as a traditional method to produce rice powder, the most essential ingredient to steam Backsulgi. However, the wet-milling process has become less common for modern people living in the present day(Ryu YK et al., 2008). Thus, new techniques, such as hot-air drying or air-jet milling process, have been developed using dry non-glutinous rice flour. These two techniques made it easier for rice cakes to be sold in the markets. The dry-milling process, specifically, was used as a standard method due to its productions with consistent moisture content and particles.
The current research regarding rice flour reported that it was largely influenced by many variables: water-soaking time of rice, size of the rice particle, milling method, milling machines, rice variety, degree of milling and milling conditions (Chiang PY &
Yeh Al, 2002; Kum JS & Lee HY, 1999; Kim SK & Bang JS, 1996).
Dried rice flour with moisture content of 12~14% can be easily stored and preserved like wheat flour (Kim WS & Shin MS, 2007).
According to Kim’s research (Kim SM, 2013), the restrictions of the rice flour distribution made it difficult to reach the consumer markets. The quality of wet-milled flour varies with different methods of grinding and storing used. On the other hand, the
rice flour made through dry-milling process was easily stored due to its capacity to be stored at room temperature.
There has been recent research to explore rice cakes made using dry non-glutinous rice flour(Han SK & Rho JO, 2009). Other research focused on finding the optimal mixing ratio for baked glutinous rice cake. The study analyzed the surface of baked rice cakes by using dried glutinous rice flour(Kim KM et al., 2007). In Seolgitteok(Lee MH et al., 2011), the turmeric flour were added into Seolgitteok for an experiment. Tofu was added into the Seo- lgitteok in both dried non-glutinous and glutinous rice flour in attempts to improve dryness of the rice cake while adding nutrition. Tofu, with its large water binding capacity, was able to add moisture and softness in the non-glutinous rice powder(Kim OK, 2009). Studies also revealed that the dryness of the Backsulgi can be further improved by using dry non-glutinous rice flour with milk by differing moisture, hydration time and amount of milk(Park YM & Yoon HH, 2012).
While most of the research focuses on the quality charac- teristics of the rice cake produced by dry-milling or wet-milling process and its influences on the rice cake, there has been a lack of research looking at ways to improve quality of rice cake by using the dry-milling process. Recently, there has been a growing use of various sweeteners, including sugar, to sweeten foods.
Sugar is not only used to sweeten but also to moisten food. It is also an important factor in determining the attribute of the food (Kim HK & Yoon JY, 2004). However, the recent rise in obesity and diabetes rates along with the rapid economic growth and high
A Study on Sensory Properties of Backsulgi using Dry Non-Glutinous Rice Flour
Young Mi Park
1and Hye Hyun Yoon
2,¶1Dept. of Food Service Industry, Hanyang Women’s University, Seoul 133-793, Korea
2Dept. of Culinary and Food Service Management, Kyung Hee University, Seoul 130-701, Korea
ABSTRACT: The study explores the sensory properties of Backsulgi prepared with dry non-glutinous rice flour sweetened with various
sweeteners(sugar, honey, oligosaccharide, trehalos, erythritol and accesulfame K). Sensory attributes of Backsulgi were evaluated by quantitative descriptive analysis(QDA), PCA and PLSR. The QDA results revealed that the sample sweetened with trehalose showed highest value in dryness, and samples with accesulfame K, honey and erythriol had relatively high levels in moisture and springiness.
Principle component analysis (PCA) results showed 78.89 % of the total variation with PC1 (54.92%) and PC2 (23.98%), respectively. The samples with accesulfame K(AF) and honey, which showed high values in moisture level, springiness and sweet taste, showed similar attributes which led to a positive direction of PC1. The correlation between the sensory attributes and consumer acceptance showed that the most important factors for high consumer acceptance were moistness, springiness, sweet taste and sweet flavor. Overall, the samples with accesulfame K(AF) had the closest position in the PLSR results with highest overall consumer satisfaction.
Keywords: Backsulgi, QDA(Quantitative Descriptive Analysis), PCA(Principal Component Analysis), Sensory Properties, Sweeteners,
Dry Non-Glutinous Rice Flour, Accesulfame K
§ Corresponding Author: Hye Hyun Yoon, Dept. of Culinary and Food Service Management, Kyung Hee University, 1 Hoeigi-dong, Dongdaemoon-gu, Seoul 130- 701, Korea., Tel. +82-2-961-9403, Fax. +82-2-964-2537, E-mail: [email protected]
Received: 18 August, 2014, Revised: 1 October, 2014, Accepted: 20 October, 2014.
standard of living has affected the levels of sugar consumption (Ryu DR et al., 2012 ; Jung HS et al., 2014). Research like Baek- sulgi(Ryu DR et al., 2012) attempts to replace sugar used in rice cakes with different sweeteners while some attempted to make mulberry rice cakes using trehalos and starch instead(Kim SS &
Noh, 2008). Despite all these research, there was still a lack of research that focused on making rice cakes using dry non-glu- tinous rice flour with various sweeteners.
When using the dry non-glutinous rice flour to make Tteok, it was presumed to be easier for production purposes because it was a simple method for mass producing. Additionally, there was always an underlying assumption that adding sweeteners in- cluding sugar, would improve the dryness of dry non-glutinous rice flour. The purpose of the research sought to examine the influences of each sweetener on the sensory attributes of Back- sulgi. The following sweeteners were added into the dry non- glutinous rice flour for this study: sugar(CON), trehalos(TH), honey(HN), oligosaccharides(OH), erythritol(ER) and accesulfame K(AK). Another research sought out to load bread by adding honey instead of sugar(Kim EJ. & Lee KS, 2013) because honey was evaluated to have high levels of softness and moistness compared that of sugar. According to mulberry rice cake(Kim HK
& Yoon JY, 2004), there was more softness and moistness in texture by adding erythritol instead of sugar. The research hel- ped to prove erythriotol as a qualifying factor for the sensory properties in Backsulgi. This study was derived from using the quantitative descriptive analysis method to determine sensory attributes of Backsulgi in using dry non-glutinous rice flour with various sweeteners. Overall, the sensory attributes of Backsulgi were measured with QDA, PCA and PLSR methods.
EXPERIMENTAL MATERIALS & METHODS Determining Relative Sweetness
The ingredients include dry non-glutinous flour, a product from Haessalmaroo(Daedoo Foods Co,, Ltd.), trehalos(Low-Sweet sugar, Sunin), oligosaccharide(Isomalto-oligosaccharide, Chung- jungone), honey(Acacia-honey, Dongsuhhoney), erythritol(Ajou food additive), acesulfame K(Ajou food additive), milk (Seoul dairy cooperative), salt (Fine sea salt, Sempio Co. Ltd) and Sugar (CJ. Cheiljedang Corp).
Relative sweetness was determined by pre-testing based on research result by Ryu(Ryu DR et al., 2012). Pre-testing determi- nes optimal addition concentration of five sweeteners which contains 75% of erythritol, 130 times more of accesulfame K, 60%
of oligosaccharide, 120% of Honey, and 50% of trehalos at standard level of 100% of sugar. Through pre-test adding sugar solution with 10%, 15%, and 20% on non-glutinous rice flour, 15
% of sugar solution was appropriate; however, 10% of sugar solution was low in sweetness and 20% was high in sweetness.
Each concentrations of sweeteners were set on the same level of sweetness in consider of relative sweetness. 90 g of trehalos was needed to have the same sweetness as sugar, while accesulfame K only needs small amount. Finally, each 300 g of aqueous solution contains 40 g of sugar, 90 g of trehalos, 37.5 g of honey, 60 g of erythritol, 75 g of oligosaccharide, and 0.2 g of ace- sulfame K and 120 g of each solution was used on 300 g of non-
glutinous rice flour to balance the moisture content.
Preparation Backsulgi Samples with Sweeteners
The pre-testing which was based on advanced research of the Backsulgi characteristics in use of rice flour in the market (Han SK
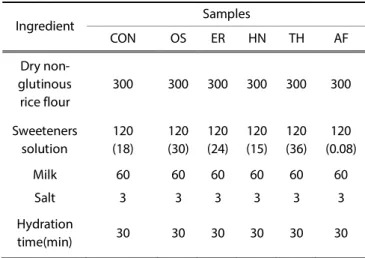
& Rho JO, 2009) determined the moisture content to 60% for making Backsulgi. Prior to steam Backsulgi made of non-glutinous rice flour, sufficient time was necessary to absorb the moisture from dry rice flour due to skipped grinding process. According to the result of Park’s research (Park YM & Yoon HH, 2012), the moisture hydration time was 30 minutes and the amount of added milk was 20%. Furthermore, the whole 60% moisture content was composed of 40% of sweetener solution and 20% of milk. The sweetener solution, milk, and salt were well-mixed in non-glutinous rice flour after going thorugh melting process and set still for 30 minutes of hydration time. The mixture was set flat on earthenware vessel in the bamboo steamer. After cutting 2.5 cm by 2.5 cm, the samples were steamed for 20 minutes and then were left still for 5 minutes. The production process of Backsulgi using non-glutinous rice flour with different sweeteners was the proportion of the ingredients was on Table 1.
Sensory Evaluation of Backsulgi Samples
The quantitative descriptive analysis was used to investigate sensory attributes of Backsulgi using dry non-glutinous rice flour added with various sweeteners.
Panel selection and training
The available volunteers for the sensory priority evaluation of Backsulgi using non-glutinous rice flour experiment were re- cruited in priority of usual interests in new foods and descriptive sensory evaluation and experience in dealing with rice cake and sensory evaluation. The identification test was performed to a group of recruited ten panels that consists five undergraduate
Table 1. Formulas for Backsulgi using dry non-glutinous rice flour unit(g)
Ingredient Samples
CON OS ER HN TH AF
Dry non- glutinous
rice flour
300 300 300 300 300 300
Sweeteners solution
120 (18)
120 (30)
120 (24)
120 (15)
120 (36)
120 (0.08)
Milk 60 60 60 60 60 60
Salt 3 3 3 3 3 3
Hydration
time(min) 30 30 30 30 30 30
CON : Backsulgi with sugar solution.
OS : Backsulgi with oligosaccharide solution.
HN : Backsulgi with honey solution.
ER : Backsulgi with erythritol solution.
TH : Backsulgi with trehalose solution.
AF : Backsulgi with accesulfame K solution.
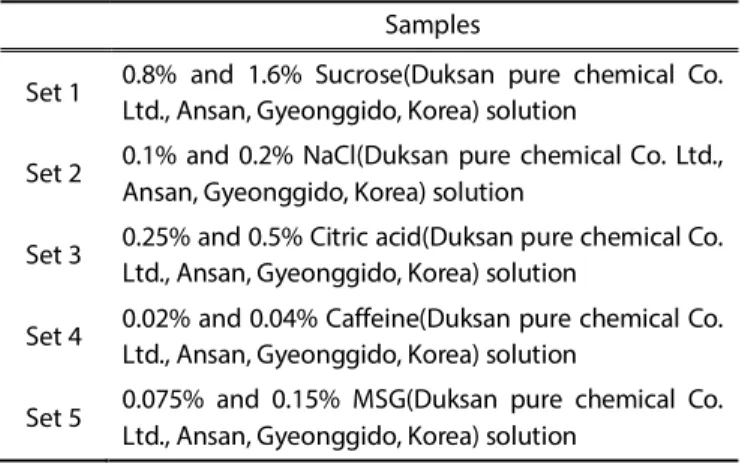
Table 2. The information of samples used in the ranking test for panel selection
and graduate students of department of culinary and service management, college of hotel management, Kyung Hee Univer- sity and five graduating seniors of Department of Traditional Korean Cuisine, Baewha Women’s University.
The identification test consisted 5 set that examine the ability of panels to identify tastes of sweet, bitterness, saline, sourness and MSG(Table 2), and each set was performed twice. The panels were selected because of scoring more than 60% of correct answer to the identification test, and selected panels were 10 females and the average age was 25.
At first, the experiment proceeded three days of describing analysis of Backsulgi. Panels were trained to get used to usual steps of describing analysis and to derive descriptors through sensory evaluation of Backsulgi sample using non-glutinous rice flour(Jeong SY et al., 2004). Prior to training, the trainers intro- duced to panels about the usual steps and meaning of des- cribing analysis after explaining the definition, principal, and method of sensory evaluation.
The training involved two steps. During first step, panels were accustomed to derive descriptors of each rice cake samples by learning how to taste and evaluate samples, and panels arrived at an agreed result (Neely EA et al., 2010). The panels defined descriptors that were previously derived through comparing non-glutinous rice flour Backsulgi samples, and the panels de- termined strength of properties during the second step. The training was held three times a week and took 2 hours each.
Generation of sensory attributes for quantitative descriptive analysis (QDA)
Developing descriptive analysis terminology to attain sensory attributes of non-glutinous rice flour Backsulgi, which was given to trained participants, was set to draw terminologies that express characteristics such as appearance, flavor, taste, texture and mouth feel. Selected terminologies, which were derived to objective concepts after consultation, follow Table 3 that shows each attributes, definition, and standard sample. Brightness, dry- ness, moistness, whiteness and firmness were the descriptors derived from Appearance. The properties of exterior such as dry- ness, hardness and showing white particles were the characte- ristics of rice cake made of non-glutinous rice flour. The range of flavor yielded corn odor, rice odor, rancidity odor, sweet odor, sweet
taste and salt taste. Hardness, springiness, moistness, jjoljitham, roughness and chewiness were derived from texture. In the category of texture, hardness, springiness, moistness, jjoljitham, roughness and chewiness were essential factors to affect texture.
Evaluation
The sensory evaluation of non-glutinous rice flour Backsulgi proceeds at room temperature (21±2℃), and all six samples that were cut in 2.5 cm×2.5 cm×2 cm were proposed to participants in a plastic container(diameter of 30 cm) to evaluate exterior, appearance, taste, texture, and feeling after swallowing. Each sample was marked with three random numbers to remove predictions or bias (Lee SY & Kim KO, 1986). The empty cups were prepared to participants to spit out water, while panels rinse off their mouth with clean water in the course of tasting each sample.
The samples were evaluated in order of exterior, appearance, taste, texture, and after taste; in specific, samples were well sensed and spitted out in a prepared cup to evaluate taste and texture attributes. The participants were learned to taste each sample sufficiently. The participants had to rinse off mouth with clean water after evaluating each sample to remove residues and to minimize tongue dullness.
Each evaluation takes average time of fifty minutes, and the evaluation repeats three times.
The line scale, which was 15 cm long line anchored 1.5 cm away of each ends, was used for evaluation. The participants mark on right side of line for strong property and vice versa.
Statistical Analysis
Upon repetition, the results were analyzed by SPSS 18.0 pro- gram. The one-way ANOVA program was used to test the sig- nificances in the samples. The statistical significance was mea- sured by Duncan’s multiple range test at a level of p<0.05.
Principal Component Analysis (PCA) was used to inquire different attributes in each non-glutinous rice flour Backsulgi samples. It was applied an average value that was previously derived through the descriptive analysis result. Moreover, PC1 and PC2, the average values applied to PCA, were used to sum up sensory attributes of Backsulgi using non-glutinous rice flour.
PLSR was used to analyze the relation between acceptance and sensory attributes of Backsulgi using non-glutinous rice flour. The PCA factor rotation was determined by the Varimax method with Eigen value as one. XLSTAT(XLSTAT version 2011, Addinsoft, New York, N.Y., U.S.A.) analyzes PCA and PLSR.
RESULT AND DISCUSSION Quantitative Descriptive Analysis
Table 4 shows the results from QDA of Backsulgi using non- glutinous rice flour added with various sweeteners.
The property showed significant differences in brightness, dryness, moistness and appearance of white particles. The dry- ness value was high in Backsulgi with trehalos, while the moist values were high in Backsulgi with accesulfame K, erythritol and honey.
The erythritol sample showed the brightest (brightA) rice cake Samples
Set 1 0.8% and 1.6% Sucrose(Duksan pure chemical Co.
Ltd., Ansan, Gyeonggido, Korea) solution
Set 2 0.1% and 0.2% NaCl(Duksan pure chemical Co. Ltd., Ansan, Gyeonggido, Korea) solution
Set 3 0.25% and 0.5% Citric acid(Duksan pure chemical Co.
Ltd., Ansan, Gyeonggido, Korea) solution
Set 4 0.02% and 0.04% Caffeine(Duksan pure chemical Co.
Ltd., Ansan, Gyeonggido, Korea) solution
Set 5 0.075% and 0.15% MSG(Duksan pure chemical Co.
Ltd., Ansan, Gyeonggido, Korea) solution
surface, and the rest, ranked in descending order: sugar, trehalos, accesulfame K, oligosaccharide and honey. Honey had the lowest brightness due its own natural brown color.
The trehalos sample showed the highest result for dryness (drysA), while the accesulfame K and honey samples had the moistest exterior. The analysis of exterior moistness (moistA) in contrast to dryness revealed that accesulfame K had the moistest
exterior while the trehalos sample had the lowest value.
The sample with honey and accesulfame K had the lowest value in “whiteness” (white A), while the trehalos and Erythritol samples showed plenty of rice particles on surface. The sample with trehalos had the highest value on dryness of surface and spotting with rice particles.
The erythritol had the most firm surface (firmA), although not Table 3. Definitions and reference standards of appearance, flavor, taste, texture and mouth feel/attributes used in the descriptive analysis of Backsulgi
Sensory
attributes Descriptors Abbrev. Definitions Reference
(intensity of the reference)
Appearance
Brightness brightA Intensity of brightness associated with milk Milk(13) Dryness drysA Intensity of dryness associated with mung bean
crumbs Mung bean crumbs(8)
Moistness moistA Intensity of moistness associated with castella Castella(8)
Whiteness whiteA Intensity of rice particles associated with black
sesame jook Black sesame jook(14)
Firmness firmA Intensity of firmness associated with chiffon cake Chiffon cake(10)
Flavor
Corn odor cornO Flavors associated with corn silk tea Corn silk tea(7)
Rice odor riceO Flavors associated with cooked rice Cooked rice(7)
Rancidity
odor rancidO Flavor associated with row rice Row rice(7)
Sweet odor sweetO Flavor associated with grain syrup Grain syrup(11)
Sweet taste sweetF Fundamental taste sensation of which sucrose
solution 10% is typical 10% sucrose solution(7)
Salt taste saltF Fundamental taste sensation of which salt solution
1% is typical 1% salt solution(9)
Texture
Hardness hardT The feeling of hardness associated with peeled
banana Banana(8)
Springiness springT Degree to which center of jeung-pyun returns to original shape after press by the forefinger
Jeung-pyun (10 )
Moistness moistT Amount of moisture on surface of castella Castella(10)
Jjoljitham jjoljitT The mouthfeeling of garaetteok Garaetteok(13)
Roughness roughT The feeling of roughness in the mouth associated with surface of toasted bread
Surface of toasted bread(9)
Chewiness chewT Time required to masticate kkaechal ppang (sweet Rice Bun) to be suitable for swallowing
Kkaechal ppang (sweet rice bun)(10)
Mouth feel After taste After taste The aftertaste associated with hardtack Hardtack(10)
statistically important, while the sample with accesulfame K had the weakest surface. The erythritol also had weak surfaces be- cause the erythritol had low water (Kim HS & Yoon JY, 2004) absorption level when steaming.
The samples with honey and oligosaccharide had the stron- gest corn flavor while the sample with sugar had the weakest.
The criteria of flavor included corn flavor (cornA), rice flavor (riceO), rancidity (rancidO), and sweet flavor (sweetO). The sam- ple with oligosaccharide had the most rice flavor and rancidity due to its own its flavor of non-glutinous rice flour. The sugar- added-sample had little rice flavor, and rancidity showed lowest value in a sample with honey. The sample with accesulfame K had the sweetest flavor, while erythritol was the least sweet.
The criteria of taste consist of two: salty taste (saltF) or sweet taste (sweetF). The sample with accesulfame K had the highest value in sweet taste, and the rest were rated in following descending order: sugar, honey, erythritol, oligosaccharide, and trehalos. The sample with trehalos tasted less sweet, although the sugar content was in the same level in all samples. The sample with erythritol had sweeter taste than samples with oligosaccharide and trehalos, even though the sweet taste of erythritol rapidly disappeared in the end (Ryu DR et al., 2012).
Panels confirmed that low durability of sweet taste in Erythritol was less sweet than sugar added Baeksulgi, which is the same result from Ryu DR et al.(2012).
The sample with oligosaccharide had the highest value in salty taste, while the samples with sugar and accesulfame K had the lowest value. The sample which had highest value in salty taste was evaluated to have low value in sweet taste, and vice versa.
Hardness and chewiness were evaluated to have high value in the sample with trehalos, and springiness and moistness highest in the sample with erythritol, honey, accesulfame K.
The texture had multiple criteria including hardness (hardT), springiness (springT), moistness (moistT), jjoljitham (jjojitT), rou- ghness (roughT), and chewiness (chewT). The sample with tre- halos, which had the lowest value in moistness and the highest value in dryness, had the highest value in hardness.
The sensory evaluation showed the result of hardness levels in descending order: accesulfame K, honey, oligosaccharide, sugar and trehalos. The exterior hardness of Backsulgi appeared due to lack of its moisture content. As a result, it causes cooking to be difficult while making it prone to rapid aging. The trehalos sample steamed by the wet method showed a decrease in hardness with an increase in moisture levels as the trehalos levels increased (Kang JH et al., 2010). However, the samples steamed by the dry method showed opposite results. The accesulfame K sample had the highest value in springiness, and the rest were evaluated in the descending order: erythritol, honey, sugar, trehalos, and oligosaccharide. The samples with accesulfame K and honey, had the highest value in moistness (Tong Q et al., 2010). On the other hand, the trehalos sample, which had high value in dryness and hardness, showed the moisture levels. The sample with trehalos, which had low moist and hard exterior, was evaluated to have the most jjoljitham while the sample with oligosaccharide had the lowest value in jjoljitham. The sample with honey, high in moisture, intended to have low value in
jjoljitham. When steamed by the dry method, the trehalos and oligosaccharide samples had the highest value in roughness, which requires an improvement. Adding accesulfame K caused the lowest value of roughness with its moisture value. The samples with trehalos, with high value in jjoljitham, also app- eared to have high value in chewiness. The sample with the honey had the lowest value in chewiness.
The trehalos and oligosaccharide had higher values in the criteria of sweet after-taste than accsulfame K; however, the values are not statistically significant.
The study was performed to improve the defects of the dry method steaming by adding various sweeteners. Trehalos, highly moist sweetener, had the highest value in dryness and hardness;
however, adding a small quantity of accesulfame K added to a high value in moistness and softness. Adding sweeteners in non- glutinous rice flour steamed by the dry method caused adverse consequences due to hydration and gelatinization of non-glu- tinous rice flour regardless of sweeteners’ capacity to hold mois- ture. The accesulfame K had a sweet taste even when small am- ounts were added. However, due to its high moisture content, small amounts of accesulfame K were insufficient for the gela- tinization process of rice flour and sugar.
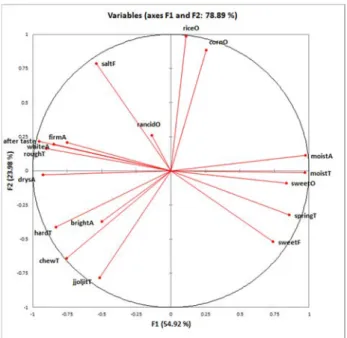
Principal Component Analysis (PCA) of the Sensory Properties Fig. 2, 3 shows the PCA results of Backsulgi using non-glutinous rice flour added with various sweeteners. Performing the PCA through descriptive evaluation extracted two principal compo- nents; there was a total variation of 78.89% of total variation; PC1 and PC2 levels at 54.92% and 23.98% respectively.
Each property, which includes rice flavor, corn flavor, exterior moistness, texture moistness, sweet flavor, and springiness, po- sitioned in a positive direction of PC1 of the principal component;
whereas salty taste, rancidity, compactness, aftertaste, brightness, roughness, dryness, hardness, degree of whiteness, chewiness, and jjoljitham positioned in a negative direction. Properties that positioned in the same direction have positive correlation while properties that positioned in the opposite direction have the negative correlation.
PC2 was positioned in the positive direction of salty taste, degree of compactness of exterior, degree of whiteness, and roughness of texture while factors like roughness of exterior was strongly positioned in the negative direction. The criteria of hardness of texture, chewiness, and jjoljitham were positioned in the negative direction as well.
Honey, accesulfame K, and erythritol were strongly pointed in a positive direction of the degree of loaded principal component of each sample; however, oligosaccharide, trehalos, and sugar loaded in the negative direction. Oligosaccharide was positioned in the positive direction in PC2, and honey and erythritol were strongly charged. Trehalos, sugar, and accesulfame K were char- ged in the negative direction.
The good characteristics of Backsulgi such as rice flavor, corn flavor, moistness of exterior, moistness of texture, sweet flavor, and springiness appeared on the samples with non-glutinous rice flour added with honey, erythritol, and accesulfame K.
trehalos, sucrose, and oligosaccharide, which were positioned in
the negative direction, had the properties of salty taste rancidity, after taste hardness, roughness, dryness, whiteness, chewiness, and jjoljitham. The positive direction showed high properties in moisture level, springiness and sweet taste. Samples loaded hi- ghly in the negative direction showed to have roughness, dry- ness, hardness, jjoljitham and chewiness.
The Correlation of the Sensory Properties and the Consumer Acceptability by PLSR
The PLSR, displayed in Figure 4, was conducted to inquire the correlation between non-glutinous rice flour, consumer accep- tance and the sensory attributes of Backsulgi samples made with non-glutinous rice flour. From the PLSR result, it can be con- cluded that Backsulgi containing erythritol(ER) or accesulfame K(AF), with high levels in exterior color, proved that brightness of
the rice cake had positive effects on consumer acceptance. By observing samples with oligosaccharide(OH) or honey(HN) add- ed, it is presumed that their low scores in brightness of color had negative effects on the level of consumer acceptance. Also trehalos(TH), scoring high in showing rice particles, was placed on the opposite side of PLSR which explains it slow consumer acceptance.
The following attributes had major impacts on consumer acceptance: texture, taste, overall desirability and flavor. Springi- ness, sweet taste, sweet odor, moistness of texture and mo- istness in exterior were all close to accesulfame K(AF) and they had positive impacts on the level of acceptance. When plenty of water was used to produce rice cakes, roughness and rice particles were seen in exterior of rice cakes. Depending on the sweetener used, there were rice particles due to the dryness of Table 4. Quantitative descriptive analysis results of dry non-glutinous rice flour Backsulgi
Sensory attributes Samples
F-value
CON
1)OS ER HN TH AF
Appearance
brigtA 9.45±2.47
2)a3)b7.81±1.94
b9.56±1.87
a3.84±1.49
c8.88±2.83
b8.47±2.39
ab14.98
***drynA 9.09±2.71
a9.39±2.12
a6.76±3.04
b6.67±3.63
b10.28±3.24
a6.21±4.23
b4.53
**moistA 6.94±2.38
c7.25±2.46
bc9.10±2.96
ab10.25±2.76
a5.30±3.47
c10.78±3.00
a8.80
***whiteA 5.79±2.48
b8.60±3.15
a9.36±3.01
a4.49±2.78
b10.45±2.62
a4.56±2.86
b13.42
***firmA 8.95±3.25 8.58±3.13 9.03±3.38 6.76±3.76 8.21±3.72 5.88±3.34 2.26
NSFlavor
corn O 4.02±3.65
b7.01±3.15
a5.06±3.42
ab7.06±2.92
a4.33±4.18
b4.63±3.62
ab2.43
*rice O 4.19±3.15
b7.81±2.99
a6.41±3.34
ab6.31±3.38
ab4.51±2.95
b5.04±3.27
b2.98
*rancid O 4.65±3.37
ab5.89±3.94
a5.07±2.79
a2.37±1.71
b3.50±2.58
ab5.15±3.78
a2.70
*sweet O 4.91±3.98
bc5.33±3.42
bc3.60±3.17
c7.41±3.84
ab3.94±3.01
c8.91±4.50
a5.05
***sweet F 8.10±2.73
b3.57±2.42
c3.81±2.72
c6.83±3.63
b3.41±2.75
c11.34±2.32
a20.84
***salt F 4.24±2.64
b8.08±3.73
a6.20±3.70
ab5.31±3.57
b6.36±3.43
ab4.36±3.93
b2.68
*Texture
hard T 8.06±2.73
b6.88±3.52
b6.99±3.21
b6.61±2.42
b11.05±1.85
a5.95±3.24
b6.42
***spring T 7.18±2.46
abc5.38±2.46
c8.23±3.39
ab8.09±3.18
ab5.78±4.19
bc8.83±4.01
a2.80
*moist T 6.96±2.09
bc6.77±3.37
bc9.03±3.89
ab9.81±3.21
a5.33±2.93
c11.21±2.56
a8.23
***jjoljit T 8.61±2.62
ab6.68±2.86
b7.41±3.20
b7.13±3.10
b10.71±3.48
a8.30±4.05
b3.19
*rough T 7.83±1.94
ab8.93±2.82
a6.09±2.63
bc6.16±3.56
bc8.98±2.90
a5.48±3.91
c4.11
**chewi T 8.11±1.78
ab6.34±2.94
b6.95±3.38
b5.89±3.01
b9.75±3.90
a6.67±4.35
b2.92
*Mouth feel after
taste 7.75±2.38 8.86±3.45 7.58±3.66 6.24±2.99 8.85±3.67 6.36±4.08 1.80
NS1)
Refer to the legend in Table 1.
2)
Mean±S.D.
***p<0.001,
**p<0.01,
*p<0.05, NS; not signification.
3) a~c