Vol.21, No.2, (2019), pp.1~9 https://doi.org/10.9714/psac.2019.21.2.001
```
1. INTRODUCTION
The practical superconducting wires and tapes include multicomponent structure designed to meet optimized engineering requirements. Because the constituent components have different coefficients of thermal expansion (CTE) and different moduli of elasticity, it is difficult to determine simply the local stress and strain exerted on the superconductive component and how it influences the electromagnetic properties under operation [1]. Several analyses of the local stress and strain have been reported in the literatures for the commercialized superconductors, MgB
2[2], BSCCO [3, 4], REBCO [5-7]
and Nb
3Sn [8-11]. The nature and origin of the stress and strain behavior on the electromagnetic properties depends on the architecture of these composite systems, so it is still essential to carry out quantitative studies of these materials in order to get a full understanding and to realize the best available performance under operational stress and strain conditions.
One of major applications for the composite superconducting wires is to build electrical power devices like NMR and MRI under high magnetic field. While the magnet is being manufactured, complicated stress / strain is generated during its drawing and winding, and while it is being energized, a large electromagnetic force is generated to the superconducting wires because of its high current density. It is therefore indispensable to have full knowledge of the mechanical - electromagnetic properties of the relevant superconducting wires.
Recently quantum beam techniques have been developed to measure directly the local strain exerted on the superconducting component in the composite
superconductor like YBCO layer in the 2G tape [1, 12], BSCCO filaments [3] in the DI-BSCCO tape and Nb
3Sn filaments in the Nb
3Sn strand [13]. The local strain consists of thermal strain and lattice strain. The latter means the strain induced by the external applied stress. In practice, the local strain on the superconducting component is not equal to the external applied strain, because the local strain is affected by thermal strain and anisotropy of elastic moduli.
Thus, the modern quantum beam analysis is quite unique in order to clarify accurately the strain state on the superconducting component. In the present report, we would like to introduce the situation on the stress / strain experiments and on the analysis of their influence to mechano – electromagnetic properties by using mainly our reported data.
2. GENERATION OF LOCAL STRESS / STRAIN IN THE COMPOSITE SUPERCONDUCTING WIRES
AND THEIR EVALUATION TECHNIQUES 2.1. Principle of local strain measurements under external load
Fig. 1 explains simply the principle of strain measurements by diffraction method. The incident beam is diffracted by a specified lattice plane (hkl) with lattice spacing d(hkl) and the diffracted beam is detected, where this lattice plane locates vertical to the external load axis.
When applying the tensile load, the lattice plane increases from d(hkl) to d(hkl) + △ d. This change of lattice spacing can be detected from the observation of peak shift of lattice plane (hkl) as indicated in Fig. 1.
The Bragg diffraction profile can be measured by means of two type of scanning techniques; angular dispersive and energy dispersive methods. In the angular dispersive method,
Local strain / stress and their influence to mechano –
electromagnetic properties of in composite superconducting wires
Kozo Osamura
a,*, and Shutaro Machiya
ba
Research Institute for Applied Sciences, Kyoto, Japan
b
Daido University, Nagoya, Japan
(Received 10 May 2019; revised or reviewed 11 June 2019; accepted 12 June 2019)
Abstract
Practical superconducting wires are designed with a composite structure to meet the desired engineering characteristics by expert selection of materials and design of the architecture. In practice, the local strain exerted on the superconducting component influences the electromagnetic properties. Here, recent progress in methods used to measure the local strain in practical superconducting wires and conductors using quantum beam techniques is introduced. Recent topics on the strain dependence of critical current are reviewed for three major practical wires: Nb
3Sn, BSCCO-2223 and REBCO tapes.
Keywords: practical Superconductor, Nb
3Sn, BSCCO, REBCO, quantum beam diffraction, local strain, electromagnetic property
* Corresponding author: [email protected]
Local strain / stress and their influence to mechano – electromagnetic properties in composite superconducting wires
Fig. 1. Principle of strain measurement by diffraction method.
TABLE I
N
UMERICAL COMPARISON FOR USUAL NEUTRON ANDX-
RAY DIFFRACTION EXPERIMENTS FOR COPPER.
the monochromatized incident beam with constant wavelength λ is rotated and then search a peak position θ(hkl). The lattice spacing d(hkl) is calculated by the equation;
(1) On the other hand, in the energy dispersive method, the angle is fixed, but the wavelength of the incident beam is continuously changed as mentioned below. Then the peak of a specified Bragg diffraction is searched and the corresponding lattice spacing is determined according to Eq. (1). There are some different characteristic features depending on both methods. When using the present standard diffraction apparatuses, the precision is estimated as △2θ/2θis about 0.01% for angular dispersion method and △t/t is about 0.03% for energy dispersive one.
The diffraction intensity for the (hkl) crystal plane is given by the equation,
I(hkl)=I
0T|F(hkl)|
2(2) where I
0is the incident beam intensity and the structure factor F(hkl) is given by
(3) where f
j(hkl) is the atomic scattering factor. The transparent factor is
(4) where μ and t are the absorption coefficient and the sample thickness.
It is possible to use two types of beam; neutron and x-ray.
Their interaction ability with materials is different each other for instance, as indicated in Table 1 for copper. In general, neutron gives a smaller scattering amplitude, and a larger transmittance.
2.2. Neutron diffraction method
Neutron diffraction facilities for the strain measurements used in our study are classified into two types due to the kinds of neutron source; continuous neutron from the
atomic reactor and pulsed one from the spallation source.
We used the diffractometer RESA facilitated at the atomic reactor JRR-3 at JAEA and TAKUMI facilitated at the pulsed neutron facility J-PARC / MLF, JAEA.
2.2.1. Continuous neutron
The diffraction experiments at low temperature were carried out at Residual Stress Analysis (RESA) station of the research reactor JRR-3 of JAEA as shown in Fig. 2.
Here the experimental results on Nb
3Sn wire [14] are introduced. The simultaneous experiments of tensile test and diffraction were carried out by using the specially designed load frame as reported in [15]. The apparatus for gripping the specimen was replaced as shown in Fig. 3 for the present purpose. The tape sample was gripped by copper chucks and loaded at constant strain levels step by step. The residual strain of Nb
3Sn component was determined by comparing the lattice constant of the strain-free powder sample extracted from the same strands.
The monochromatic neutron beam with mean wavelength of 0.19726 nm was used. The direction of scattering vector was controlled to keep parallel to the wire axis. There in order to increase the diffraction intensity, three wires were bundled and attached to chucks. Strain gauge was attached on each wire to measure strain while a dummy strain gauge was placed nearby where the same temperature was kept.
Fig. 2. Low temperature apparatus for strain measurement under tensile strain at RESA, JRR-3.
Fig. 3. Setup for strain measurement on Nb
3Sn wires, where 1: three Nb
3Sn wires, 2: dummy wire under no applied strain, 3: Nb
3Sn powder, 4: Ni powder, 5: strain gauges and 6:
thermometer.
2.2.2. Pulsed neutron
Neutron diffraction measurements were carried out [16]
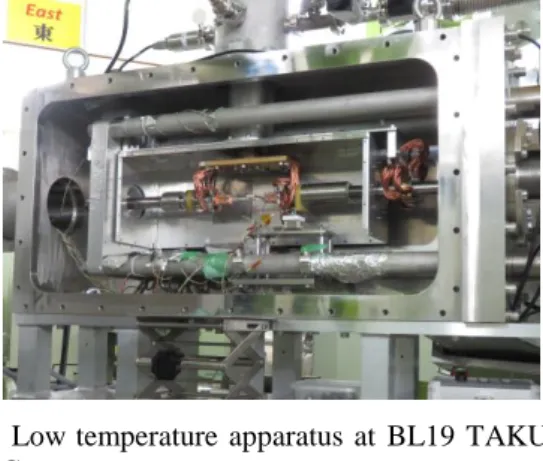
at the beam line BL19 TAKUMI of Japan Proton Accelerator Research Complex (J-PARC) as shown in Fig.
4, where pulsed neutrons with wavelengths between 0.06 and 0.2 nm were utilized [17].
Scattering Amplitude [10
-14m]
Thickness for 1 % Transmission [mm]
Neutron 0.763 45.1
X-ray 8.17 0.040
Fig. 4. Low temperature apparatus at BL19 TAKUMI of J-PARC.
Fig. 5. Detail of the sample holder.
The diffraction data were accumulated by using southern detector banks, by which the diffracted neutrons with scattering vector parallel to the tape axis could be obtained.
A specially designed load frame [18] was used in the present simultaneous tensile test and diffraction experiments. The load frame was placed at the center of goniometer as shown in Fig. 5. The single tape sample was gripped by brass chucks. A Nyilas-type extensometer was attached to the sample to measure the applied strain. Load was measured by using a load cell. The sample was loaded to successive constant load level step by step.
2.3. Synchrotron radiation method
Synchrotron radiation facilities for strain measurements used in our projects were BL46XU and BL28B2 equipped at Spring-8 JAEA.
2.3.1. Monochromatized X-ray
The diffraction experiments were carried out at room temperature at BL46XU SPring-8 where the monochromatized X-ray with wavelength of, for instance, 0.063614 nm was utilized. A part of diffraction meter is shown in Fig. 6, of which the detail was reported in [5].
The diffracted X-ray was detected towards two specified directions parallel and transverse to the wire axis by tilting the sample. By the 2θ- θ scanning technique, the intensity profile from a specified crystal plane was detected in the necessary scattering angle region under the geometry as the scattering vector is parallel to the longitudinal axis of the tape and to the tape surface. The details of the diffraction measurement were reported elsewhere [12].
2.3.2. White X-ray
The diffraction experiments by using white X-ray were carried out at room temperature at the BL28B2 station of
Fig. 6. Room temperature apparatus at BL46XU SPring-8.
Fig. 7. Two types of sample holder for diffraction experiments.
SPring-8 [19]. It used white X-rays with energies between 30 and 150 keV with the cooled Ge solid-state detector set to a diffraction angle of 2 = 8
o. Corresponding to the critical current measurements, two kinds of sample holder were used. As shown in Fig. 7 (a), the Nyilas type strain gauge was placed outside the diffraction point of incident beam, because of avoiding the absorption of incident beam by the strain gauge. Then the change of diffraction angles of components was measured as a function of tensile strain.
As shown in Fig. 7 (b), the springboard was installed in a specially designed load frame, which was placed at the center of the goniometer. In order to reduce the absorption of incident beam, an unpierced hole was digged in the spring board. The diffraction peaks were measured as a function of uniaxial strain. The diffraction geometry ensured that the scattering vector was parallel to the tape axis. The diffraction measurements were repeated at different levels of strain. Diffraction peaks belonging to several crystal planes of superconducting component were observed. For instance, several diffraction peaks belonging to {100} and {110} crystal planes of REBCO were observed. In the present study, the spacing of the {h00}
planes was employed for local strain measurements because its diffraction intensity was strong enough to ensure sufficient statistical accuracy.
2.4. Critical current measurement under external load
The critical current measurements were carried out in the
open cryostat filled by liquid nitrogen. In order to
investigate the strain dependence of critical current over the
wide range of uniaxial strain, two techniques were
employed in the present study. As shown in Fig. 8, the
Local strain / stress and their influence to mechano – electromagnetic properties in composite superconducting wires
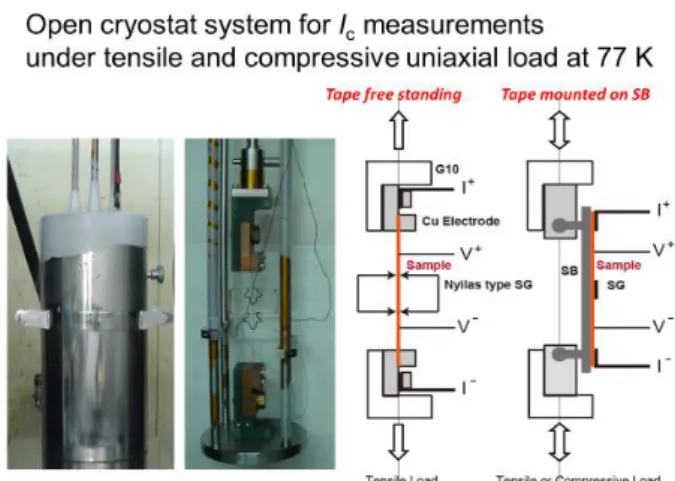
Fig. 8. Open cryostat system for I
cmeasurements under tensile and compressive uniaxial load.
sample holder (a) is attached to the universal testing machine and is pulled by tensile load. The tape sample is gripped by two copper electrodes, which are insulated from the tensile machine by means of G10 insulators. Under an applied tensile load, the V – I characteristics is measured and the critical current is determined, while the strain is monitored by means of the Nyilas type strain gauge.
Further to measure critical current towards both compressive and tensile directions, we employed a springboard (SB) as shown in Fig. 8 (b). A tape-sample is soldered on SB, where a strain gauge is glued on the sample surface. Then applying tensile or compressive load, it becomes possible to measure uniaxial strain dependence of critical current towards both directions. The present SB was designed by the research group of Durham University [20].
3. LOCAL STRESS / STRAIN AND THEIR INFLUENCE TO PROPERTIES OF PRACTICAL
COMPOSITE SUPERCONDUCTING WIRES 3.1. Nb
3Sn composite wires
Strain sensitivity of critical current of Nb
3Sn strands has been studied by numerous investigators. The way towards its full understanding has been gradually established through the excellent research works done by Ekin [21], Ten Haken [22], Markiewicz [23], Hampshire [24], Arbelaez [25] and other investigators. The most proper method available for the introduction of strain dependency of the critical properties is based on the full invariant analysis by Markiewicz. The model correlates the strain dependence of T
cto strain induced changes in the phonon frequency spectrum. The strain energy function is written as a function of harmonic and higher order anharmonic terms, where the latter determines the strain dependence of the lattice vibrations and the harmonic terms determine the strain free value for T
c. The position of the maximum in the strain dependency curve is predicted to appear at the point where the three-dimensional deviatoric strain components are minimal. However, the direct evidence by experiments has been scarcely reported until now.
Fig. 9. Cross section of the Nb
3Sn wires.
0.5 0.6 0.7 0.8 0.9 1 1.1
0 0.1 0.2 0.3 0.4 0.5 0.6 0.7 0.8
Nb3Sn
Ic/Icm
A (%) at T=4.2K, B=13.5T
Fig. 10. Applied strain dependence of normalized critical current for ITER Nb
3Sn strand fabricated by Hitachi cable.
The influence of local strain on mechanical - electromagnetic properties of ITER Nb
3Sn strands [14] is explained here. The sample was the Nb
3Sn strand with diameter of 0.828mm, which Hitachi Cable fabricated by Bronze method. It consisted of five components of Nb
3Sn, Nb(core), bronze(matrix), Nb (barrier) and Cu (stabilizer).
Figure 9 shows the cross section of the twisted strand, which includes 11,077 Nb
3Sn filaments. The single bundle includes 19 Nb
3Sn filaments. The whole strand consists of 577 bundles. The original composition of Bronze was 15.5wt%Sn-0.3wt%Ti.
By using the Nb
3Sn strand indicated in Fig. 9, the critical current measurement was performed at 4.2K under magnetic field of 13.5T as shown in Fig. 10. The maximum was observed at 0.15%, which is close to the force free strain determined directly from the diffraction experiment mentioned below as it has been validated by the recent theoretical consideration [14].
The diffraction experiments at low temperature using neutrons were carried out at Residual Stress Analysis (RESA) station of the research reactor JRR-3 of JAEA [14]
as explained in the previous section 2.2.1. For the present neutron diffraction experiments, (321) Nb
3Sn crystal plane was used because of the selection of optimum diffraction condition.
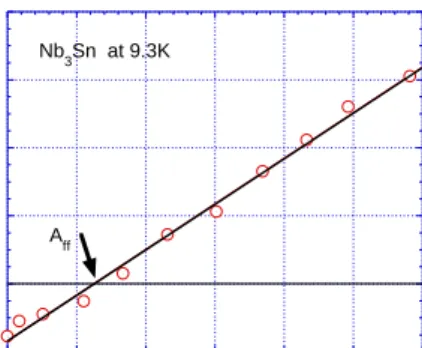
The change of local strain in the Nb
3Sn filaments
estimated from (321) diffraction as a function of applied
strain is shown in Fig. 11. Its applied strain dependence
-0.2 0 0.2 0.4 0.6 0.8
0 0.1 0.2 0.3 0.4 0.5 0.6
Al 321 (%)
A (%) Aff
Nb3Sn at 9.3K
Fig. 11. Applied strain dependence of local strain exerted on Nb
3Sn filaments at 9.3 K.
indicated a linear relation up to 0.6% applied strain as given by the equation,
(5) From this equation, the force-free strain was estimated to be A
ff=0.124%. The proportional constant with applied strain was 1.34. In general, when the polycrystalline sample is loaded, the responding slope is different with the different crystal orientation, because their elastic modulus is different [5, 26]. In the present case, the (321) crystal axis is parallel to the principal stress direction. Thus the local strain estimated from the (hkl) crystal plane is given as a general form,
(6) where the thermal strain was estimated to be -0.153 %.
Then the force free strain is represented by the following relation,
dA dA A A
lhkl T hkl ff
(7)
The force free strain relates directly with the thermal strain along the strand axis, but modified by the slope (dA
hkl/dA), which is generally not unity. The most important suggestion is that the force free strain is not eigen value, but has a distribution in the polycrystalline sample, because the slope is different depending on the crystal axis of grain.
Further in order to evaluate quantitatively the thermal strain exerted on superconductive filaments, local strain measurements were carried out during heating and cooling by means of quantum beams [27]. Another local strain measurement on Nb
3Sn filaments was carried out at cryogenic temperature by means of a pulsed neutron technique [16]. The lattice axial strain increased linearly against applied strain, while the thermal axial strain was
−0.22% at 8.5 K. Then the force-free strain was evaluated to be 0.22–0.23% in that case.
Fig.12 shows the stress - strain curve measured during neutron diffraction experiments. Here the experimental data was fitted with the elasto-plastic expression given by Eq. (8) as pointed out by N. Mitchell [28], where the elastic modulus of E=131.1 GPa was calculated by using Eq. (8).
As shown in Fig. 12, the stress – strain relation reveals the yielding from the beginning of loading,
0 50 100 150 200 250 300
0 0.1 0.2 0.3 0.4 0.5 0.6 0.7
Hitachi Cable 9.3K
Rexp Rcal
R (MPa)
A (%)
Fig. 12. Record of stress – strain data during the neutron diffraction measurements.
E R kR
A
n / (8) where A is strain, R is stress and k is constant. When fitting Eq. (8) with the experimental data, the results are given in Fig. 12, where the fitting curve coincides well with the experimental data over the whole strain range.
The local strain exerted on SC filaments along the axial direction was compressive at room temperature and tensile at high temperatures, which was common for Nb
3Sn and Nb
3Al strands. Their temperature dependence was numerically evaluated by means of the iteration method. As a whole, it was made clear that the temperature dependence of thermal strain could be reproduced well by the numerical calculation as reported in [8].
3.2. BSCCO-2223 Tapes
Figure 13 shows the strain dependence of normalized critical current of DI-BSCCO tapes,on which the stainless tape was laminated under different pretention [29]. In general, the critical current decreased gradually in the reversible region and abruptly it decreased due to the fracture of BSCCO filaments as reported previously [30].
The strain tolerance on critical current was determined as the strain to retain 95% I
c. Apart from the small A
95for the bare tape, the strain tolerance for the laminated tapes was improved largely and further increased with increasing the pretension from 44 to 161 N [31]. Thus the pretensioned lamination technique improves the strain dependence of critical current.
The measurements of lattice constant by means of
diffraction technique were carried out at room temperature
[29]. Figure 14 shows the applied strain dependence of
local strain exerted on BSCCO filaments (A
BSCCO). The
local strain consists of two contributions. One is the
thermal strain (A
BSCCO,T), which is given as the data on the
vertical axis. A compressive thermal strain generates in the
BSCCO filaments due to the difference of CTE among
constituent components as well as the pretension at the
soldering temperature. Another is the lattice strain, which
increases with increasing the applied strain. When
increasing the applied strain, the local strain increases and
changes sign over crossing a force free strain, A
ff[3]. The
local stress exerted on BSCCO filaments becomes zero
Local strain / stress and their influence to mechano – electromagnetic properties in composite superconducting wires
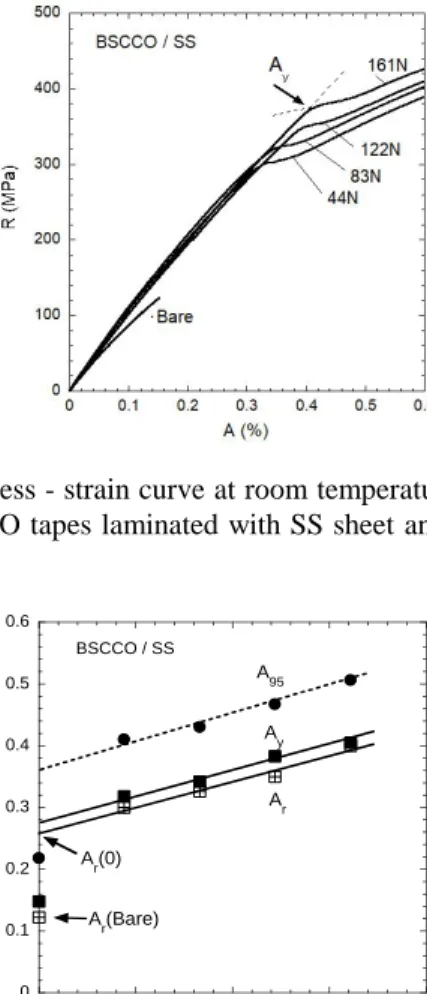
Fig. 13. Applied strain dependence of the normalized critical current for BSCCO tapes laminated with and without SS sheet.
Fig. 14. Applied strain dependence of local strain exerted on BSCCO filaments for DI-BSCCO tapes.
at A
ff. Still the local strain changes linearly with increasing the applied strain. This linearity ensures the elastic behavior of BSCCO filaments against the applied strain. At a high applied strain, the local strain saturates or shows a maximum and then decreases. This phenomenon was attributed to the breakage of BSCCO filaments, where the relaxation of local strain starts due to the filament fracture.
This relaxation strain is assigned as A
r, which was given by the sum of the thermal strain with opposite sign and the true tensile strain to fracture of BSCCO filaments.
Stress – strain behavior at room temperature is shown in Fig. 15. The bare tape fractured after a short elongation. In the low strain region below 0.3 %, the SS laminated tapes behave quasi-elastically as the details were reported [3, 32].
At the shoulder indicated by A
y, the macroscopic yielding starts due to the fracture of BSCCO filaments. The yielding strain A
ywas found to increase with increasing the pretension. Over the shoulder, the tapes did not fracture as a whole, and the plastic deformation was observed successively accompanying with the work hardening of metallic components.
The lamination of metallic sheet on the bare tape improves simultaneously both superconducting and mechanical properties. As shown in Fig. 16, the same pretension dependence can be recognized for three parameters
Fig. 15. Stress - strain curve at room temperature for four DI - BSCCO tapes laminated with SS sheet and one bare tape.
Fig. 16. Change of three kinds of strains as a function of pretension, where A95 is the strain to retain 95% Ic , Ay is the yielding strain and Ar is the relaxation strain of BSCCO filaments.
of the strain to retain 95% I
c(A
95), the yielding strain (A
y) and the relaxation strain of BSCCO filaments (A
r). The local strain state exerted on BSCCO filaments seemed to change depending on the thermo-mechanical history during the fabrication. It was pointed out that the pretension dependence of the stress to retain 95% I
cis identical with that of yielding stress at room temperature.
Further in order to investigate the effect of uniaxial strain from the compressive to tensile strain region on the critical current of DI-BSCCO tapes, the springboard sample holder was used [19]. At room temperature, the local strain exerted on BSCCO filaments was measured by means of a quantum beam diffraction technique. Over the whole tensile strain region up to 0.2% and the small compressive strain range, the local strain changed linearly with applied strain. When the compressive strain was applied beyond the relaxation strain, the local strain versus the applied strain deviated from linearity. That deviation related to the onset of BSCCO filament fracture.
3.3. REBCO Tapes
In order to discuss the mechanism for the uniaxial strain dependence of critical current in practical REBCO tapes [33], two kinds of commercialized REBCO
-0.2 -0.1 0 0.1 0.2
0 0.1 0.2 0.3 0.4 0.5 0.6
BSCCO / SS
Bare 44 N 83 N 122 N 161 N ABSCCO (%)
A (%) Ar
Aff
ABSCCO,T 0.85
0.9 0.95 1
0 0.1 0.2 0.3 0.4 0.5 0.6
44 N 83 N 122 N 161 N Bare
Ic / Ico
A (%) A95
0 0.1 0.2 0.3 0.4 0.5 0.6
0 50 100 150 200
BSCCO / SS
Strain, A (%)
Pretension, Pp (N) Ar(0)
Ar(Bare)
Ar Ay
A95
superconducting tapes acquired from Superpower and SuNAM were examined as test samples, of which general specification can be referred to their homepages [33, 34].
The critical current measurements were carried out by using the following sequence. First the critical current was measured at zero applied strain ( I
c0). In the second step, a strain was applied and I
cwas measured. Then the applied strain was reduced to zero and the critical current, I
crwas measured again. Here I
cris called as “recovered critical current”. Further critical current measurements were repeated in this cyclic fashion by increasing the applied strain step by step.
Normalized critical currents, I
c/I
c0and I
cr/I
c0are plotted as a function of applied strain in Fig. 17. The recovered critical current I
cr/I
c0kept almost constant as unity up to about 0.45 % and then decreased abruptly. Its abrupt decrease was attributed to a brittle fracture of REBCO layer as discussed in [12]. On the other hand, the critical current I
c/I
c0decreased gradually from the beginning and then decreased rapidly accompanying with the abrupt drop of I
cr/I
co. The recovered critical current I
crdecreased rapidly beyond a certain strain. The reversible strain limit was defined by using the 99% I
crrecovered strain.
Similar I
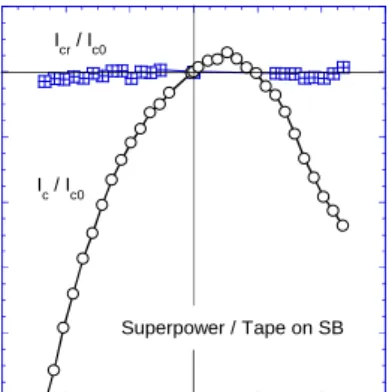
cmeasurements were carried out for the tape mounted on the SB as shown in Fig. 8. The result for Superpower tape is shown in Fig. 18. Within the strain region between -0.5% and 0.5%, the normalized recovered critical current I
cr/I
c0kept almost unity, which means no occurrence of degradation. The normalized critical current I
c/I
c0indicated a clear maximum. This result is quite in contrast against Fig. 17. This convex behavior is not symmetric with respect to the applied strain and the center of the convex curve located in the tensile strain region.
It is important to get direct information about the local strain exerted on REBCO superconducting layer to investigate properly the present results on critical current.
The measurement of local strain was carried out at room temperature. We used the crystal plane spacing of the powder in order to determine the strain-free plane spacing,
p REBCO
d . When the plane spacing from the tape without applied strain at A=0 is d ( 0 )
REBCOthe thermal strain is
Fig. 17. Normalized critical currents, I
c/I
c0and I
cr/I
c0as a function of applied strain for Superpower tape free standing.
Fig. 18. Normalized critical currents, I
c/I
c0and I
cr/I
c0as a function of applied strain for Superpower tape mounted on SB.
given by the equation,
[%]
) 100
0 (
p REBCO
p REBCO REBCO T
REBCO
d d
A d (9)
When external tensile or compressive strain is applied to the tape sample, REBCO layer elongates or shrinks and the crystal plane spacing changes from d(0)
REBCOto d(A)
REBCO. The lattice strain is defined as
[%]
) 100 0 ( )
) (
(
P
REBCO REBCO REBCO
lat REBCO
d d A
A d
A (10)
Then the local strain exerted on the REBCO layer becomes the sum of the thermal strain and lattice strain given by the equation,
) ( )
( A A A A
A
REBCO
REBCOT
latREBCO(11) The change of local strain exerted on REBCO layer is
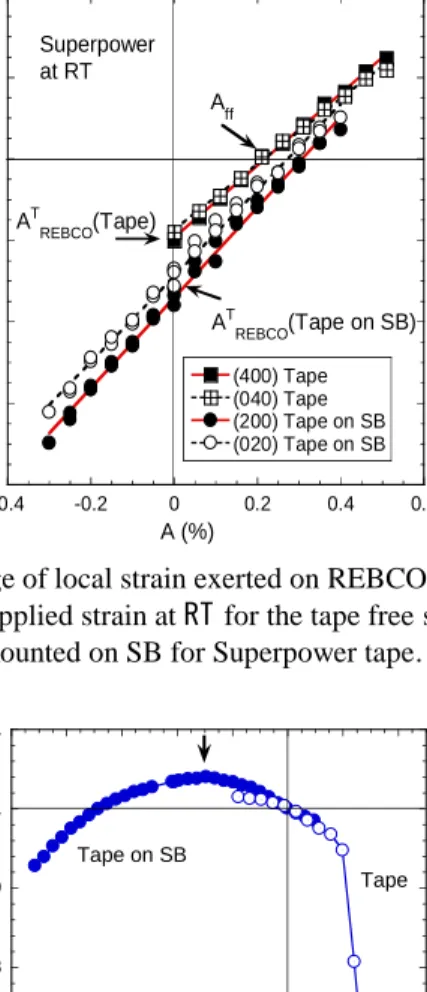
shown in Fig. 19 for Superpower tape. The applied strain dependence of A
REBCOlooks linearly change as similar to Eq. (6),
dA A A dA
A A
lat REBCO T
REBCO
REBCO
( ) (12) Eq. (12) was curve-fitted to the observed data as shown in
Fig. 19.
Further an important strain parameter is the force free strain ( A
ff) where the residual stress exerted on REBCO layer becomes zero[12, 36]. As shown in Fig. 19, the local strain A
REBCObecomes zero at A
ff, and then the local stress exerted on REBCO layer shall be zero.
Then it is possible to evaluate the local strain exerted on REBCO layer at 77 K, when applying the uniaxial strain.
As given by Eq. (12), the local strain on REBCO layer at 77 K is the sum of the lattice strain and thermal strain. The thermal strain, A
TREBCOwas determined for the tape free standing and the tape mounted on SB as mentioned above.
The slope,
dA
dAlatREBCO
was assumed to be the same with that at room temperature.
As mentioned above, when comparing both data indicated in Figs. 17 and 18, their strain dependence of I
cis inconsistent with each other, especially on an appearance of the maximum and on the reversible strain limit. Instead of applied strains, the local strain on REBCO layer is employed
0.72 0.76 0.8 0.84 0.88 0.92 0.96 1 1.04
0 0.1 0.2 0.3 0.4 0.5 0.6
I
c/I
c0, I
cr/I
c0A (%) Superpower / Tape
Ic/Ic0
Icr/Ic0
0.9 0.92 0.94 0.96 0.98 1 1.02
-0.6 -0.4 -0.2 0 0.2 0.4 0.6
Ic / Ico, Icr / Ico
A (%)
Superpower / Tape on SB Icr / Ic0
Ic / Ic0
Local strain / stress and their influence to mechano – electromagnetic properties in composite superconducting wires
Fig. 19. Change of local strain exerted on REBCO layer as a function of applied strain at RT for the tape free standing and the tape mounted on SB for Superpower tape.
0.6 0.7 0.8 0.9 1 1.1
-1 -0.8 -0.6 -0.4 -0.2 0 0.2 0.4
I
c/ I
c0'AREBCO (%) Tape on SB
Tape
Superpower
Fig. 20. Normalized critical currents obtained by two techniques as a function of local strain exerted on REBCO layer for Superpower tape.
and then the normalized critical current is plotted as a function of local strain on REBCO layer as shown in Fig.
20, where the critical current was renormalized as unity at A
REBCO 0 . Both data for the Superpower tape free standing and the same tape mounted on SB are linked quite smoothly as a function of local strain.
A maximum of critical current in the external strain dependence was observed at 0.035% as shown in Fig. 18.
On the other hand, the A
ffwas evaluated to be 0.19–0.21%
at 77 K. Thus it was made clear that the strain at the critical current maximum does not correlate with A
fffor YBCO coated conductors.
The stress/strain dependence of elastic property of the surround Cu stabilized YBCO coated conductor was further precisely analyzed by means of diffraction experiments [5, 37]. The elastic modulus E
bestimated from (0k0) diffraction peaks was larger than E
aalong the a-axis from (h00) peaks. Their observations strongly suggest that the micro twin structure is key nanostructure to understand the present unusual microscopic elastic constant.
4. SUMMARY
Practical superconducting wires consist of a composite structure, where different local stress / strain distributes in each component. Local strain on the superconducting component like YBCO layer in the 2G tape, BSCCO filaments in the DI-BSCCO tape and Nb
3Sn filaments in the Nb
3Sn strand was measured directly by quantum beam techniques. Their influence to mechano – electromagnetic properties has been analyzed by using mainly our reported data.
ACKNOWLEDGMENT
We express our hearty thanks to Professor D P Hampshire, University of Durham and Professor H-S Shin, Andong National University for their valuable collaborations and discussions. We carried out the neutron diffraction experiments at RESA of atomic reactor JRR-3 at JAEA and at TAKUMI of J-PARC / MLF, JAEA.
Synchrotron radiation experiments were performed at BL28B2(BL45XU) and BL46XU equipped at Spring-8 JAEA and BL8B equipped at PF, KEK. We would like to express our respected appreciation to the parties concerned for their excellent support.
REFERENCES
[1] K. Osamura, S. Machiya, Y Tsuchiya and H Suzuki, Supercond. Sci.
Technol., vol. 23, pp. 045020-045026, 2010.
[2] K. Vinod, R. G. Abhilash Kumar and U. Syamaprasad, Supercond.
Sci. Technol., vol. 20, pp. R1-R13, 2007.
[3] K. Osamura, S. Machiya, H. Suzuki, S. Ochiai, H. Adachi, N. Ayai, K. Hayashi and K. Sato, Supercond. Sci. Technol., vol. 21, pp.
054010-054018, 2008.
[4] S. Ochiai and H. Okuda, J. Cryo. Soc. Jpn., vol. 46, pp. 212-219, 2011.
[5] K. Osamura, S. Machiya, Y. Tsuchiya, H. Suzuki, T. Shobu, M.
Sato and S. Ochiai, IEEE Trans Applied Supercon., vol. 22, pp.
8400809, 2012.
[6] K. Ilin, K. A. Yagotintsev, et al., Supercond. Sci. Technol., vol. 28, pp. 055006, 2015.
[7] T. Suzuki, S. Awaji, H. Oguro and K. Watanabe, IEEE Trans.
Applied Supercon., vol. 25, pp. 8400704, 2015.
[8] K. Osamura, S. Machiya, Y. Tsuchiya, H. Suzuki, T. Shobu, M.
Sato, S. Harjo, K. Miyashita, Y. Wadayama, S. Ochiai and A.
Nishimura, Supercond. Sci. Technol., vol. 26, pp. 094001, 2013.
[9] H. Oguro, S. Awaji, K. Watanabe, M. Sugano, S. Machiya, T.
Shobu, M. Sato, T. Koganezawa and K. Osamura, Supercond. Sci.
Technol., vol. 25, pp. 054004, 2012.
[10] D. Arbelaez, A. Godeke and S. O. Prestemon, Supercond. Sci.
Technol., vol. 22, pp. 025005, 2009.
[11] D. M. J. Taylor and D. P. Hampshire, Supercond. Sci. Technol., vol.
18, pp. S241-52, 2005.
[12] K. Osamura, M. Sugano, S. Machiya, H. Adachi, S. Ochiai and M.
Sato, Supercond. Sci. Technol., vol. 22, pp. 065001-6, 2009.
[13] H. Oguro, S. Awaji, G. Nishijima, K. Takahashi, K. Watanabe, S.
Machiya, H. Suzuki, Y. Tsuchiya and K. Osamura, Supercond. Sci.
Technol., vol. 23, pp. 025034, 2010.
[14] K. Osamura, S. Machiya, Y. Tsuchiya, H. Suzuki, T. Shobu, M.
Sato, T. Hemmi, Y. Nunoya and S. Ochiai, Supercond. Sci.
Technol., vol. 25, pp. 054010, 2012.
[15] Y. Tsuchiya, H. Suzuki, T. Umeno, S. Machiya and K. Osamura, Meas. Sci. Technol., vol. 21, pp. 025904, 2010.
-0.8 -0.6 -0.4 -0.2 0 0.2 0.4
-0.4 -0.2 0 0.2 0.4 0.6
(400) Tape (040) Tape (200) Tape on SB (020) Tape on SB AREBCO (%)
A (%) Superpower at RT
ATREBCO(Tape)
ATREBCO(Tape on SB) Aff