CENSORED FUZZY REGRESSION MODEL
Seung Hoe Choi and Kyung Joong Kim
Abstract. Various methods have been studied to construct a fuzzy regression model in order to present a fuzzy relation between a de- pendent variable and an independent variable. However, in the fuzzy regression analysis the value of the center point of estimated fuzzy output may be either greater than the value of the right end- point or smaller than the value of the left endpoint. In the case, we cannot predict the fuzzy output properly.
This paper presents sufficient conditions to construct the fuzzy regression model using several methods investigated by some au- thors and then introduces the censored fuzzy regression model using the censored samples to manipulate the problem of crossing of the center and the end points of the estimated fuzzy number. Exam- ples show that the censored fuzzy regression model is an extension of the fuzzy regression model and also it improves the problem of crossing.
1. Introduction
The equation in which the relation between the dependent and in- dependent variables is expressed into a mathematical model, is called a regression model, being expressed, as follows:
y
i= f (x
i, θ
o) + ²
i, i = 1, 2, . . . , n,
where x
iis an independent variable, y
iis a dependent variable, ²
iis an error term, and θ
0is an unknown parameter.
It seems that in regression analysis a difference happens between the actual value of a response value and its estimator owing to errors arising from measuring the real value of the respond variable. Therefore, the value minimizing the difference between the real value and its estimator is used as the estimator of regression parameters. However, in the actual
Received April 1, 2005. Revised May 10, 2005.
2000 Mathematics Subject Classification: 62J99, 62Y05.
Key words and phrases: fuzzy regression, censored data, statistical estimators.
This article was supported by 2005 Hankuk Aviation Faculty Research Grant.
state of things, all reactive variable values cannot be precisely measured.
There exist ambiguity and vagueness in cases such as human subjective appraisal or judgment. In order to inquire into those regression models that have as their reactive variables such materials as include ambiguity and vagueness like linguistic variables, Tanaka et al. [15] proposed the following fuzzy regression model for the first time:
Y
i= A
0+ A
1x
i1+ · · · + A
px
ip, i = 1, 2, . . . , n, (1.1)
where A
iand Y
iare fuzzy numbers and x
ijis a positive non-fuzzy num- ber. And µ
Yiand µ
Aiare membership function of Y
iand A
i, respectively.
Several methods were presented to estimate fuzzy regression models.
Developed in Tanaka [13, 14, 15, 16], Savic and Pedryzc [12], Kao and Chyu [8] and Chang and Ayyub [2] were numerical methods that mini- mize the fuzziness of the response variables, while studied in Diamond [5, 6, 7], Ming et al. [10], Chang [1], and Chen [4] were statistical methods that minimize the difference between the estimated and observed out- puts. The fuzzy least squares method applies the least squares method used in ordinary regression models to fuzzy regression models and it estimates fuzzy models by first defining the distance between two fuzzy numbers and then generalizing to the distance in fuzzy regression mod- els. Unlike ordinary regression models, the fuzzy output estimated using the least squares method must be fuzzy numbers. However, as in Ex- amples 2.3, the value of the center point of estimated fuzzy output may be either smaller than the value of the endpoint on the left or greater than that on the right. That is, the example given in Section 2 is not fit to be explained with the fuzzy regression model. When analysis is inappropriate with a fuzzy regression model as in Example 2.3, such sufficient condition should be taken into account as can be described with the fuzzy regression model. Furthermore, in case that there arises a phenomenon in which the center point of the estimated fuzzy output is unable to satisfy the given sufficient condition because of cross end- points on the right or the left side, new methods are required to solve such a problem.
This study presents the sufficient condition for the fuzzy regression
model and introduces a model using some techniques of censoring to
work out the problem that the center and end points in estimated fuzzy
regression numbers cross each other. Moreover, it identifies the fact
through examples that the fuzzy regression analysis using censored sam-
ple is an extension of fuzzy regression analysis and at the same time
serves as a method to handle with the problem that the center point
and the end points of the estimated fuzzy output cross.
2. Fuzzy regression model
We define A
j= (a
j, l
j, r
j) and Y
i= (y
i, l
yi, r
yi) as LR-fuzzy numbers to suggest the sufficient condition for the fuzzy regression model. Then, an α-cut of fuzzy number A
j, written A
j(α) is defined as
A
j(α) = {x|µ
Aj≥ α} = [a
j− l
jL
(−1)(α), a
j+ r
jR
(−1)(α)], where L and R are reference functions on the right and the left side, respectively. A triangular fuzzy number is represented by the shape function L(x) = R(x) = 1 − x. In particular, {x|µ
Aj> 0} is called the support of fuzzy number A
jand a
j−l
jand r
j−a
jare called a left spread and a right spread of fuzzy number A
j, respectively. See Zimmerman [18]. The difference between two fuzzy numbers A
iand A
jequals
[A
i(α) − ¯ A
j(α), ¯ A
i(α) − A
j(α)],
where A
j(α) = a
j− l
jL
(−1)(α), ¯ A
j(α) = a
j+ r
jR
(−1)(α) and 0 ≤ α ≤ 1.
In order to construct the fuzzy regression model many scholars de- fined the distance between two fuzzy numbers A
iand A
j.
Diamond was defined the distance between two fuzzy numbers as D
d(A
i, A
j) = ( ¯ A
i(1) − ¯ A
j(1))
2+ (A
i(0) − A
j(0))
2+ ( ¯ A
i(0) − ¯ A
j(0))
2, that of Ming et al. as
D
m(A
i, A
j) = h Z
10
{(A
i(α) − A
j(α))
2+ ( ¯ A
i(α) − ¯ A
j(α))
2}dα i
12
, that of Chang as
D
ch(A
i, A
j) = R
10
{(A
i(α) − A
j(α))
2+ ( ¯ A
i(α) − ¯ A
j(α))
2}αdα R
10
αdα ,
and that of Chen as D
c(A
i, A
j) = 1
2 Z
10
{(A
i(α) − A
j(α)) + ( ¯ A
i(α) − ¯ A
j(α))}dα.
On the other hand, in estimating the fuzzy regression coefficients we can use the distance between two fuzzy numbers which is derive from the generalized Hausdorff distance as
(A
i(α) − A
j(α))
2+ ( ¯ A
i(α) − ¯ A
j(α))
2.
(2.1)
However, in this case solution may not exist or the uniqueness of the solution cannot be guaranteed in a normal equation. Therefore, an an- other distance between the fuzzy numbers needs to be defined to use the least squares method in the fuzzy regression analysis.
In this paper we construct the fuzzy regression model using the dif- ference between fuzzy numbers as
D
f(A
i, A
j) = ((A
i(1) − A
j(1))
2+ (A
i(α) − A
j(α))
2+ ( ¯ A
i(α) − ¯ A
j(α))
2, which is a transformed equation of equation (2.1), to find the unique solution in a normal equation. Especially, the distance D
d(A
i, A
j) is easily seen to be a special case of D
f(A
i, A
j) when α = 0.
As the results of the fuzzy simple regression model with two param- eters can be naturally extend to the fuzzy model with several fuzzy regression coefficients, in this paper we consider the fuzzy simple regres- sion model.
The least squares fuzzy estimators of the fuzzy regression coefficient, denoted by ˆ A, are the value which minimize the objective function
Q
n(a, l, r) = X
ni=1
D
f(Y
i, A
0+ A
ix
i).
And we should consider the following conditions to provide for such a case not to occur in which the center point and the end points of the estimated fuzzy output cross.
Throughout this section, we want to make the following Conditions in the fuzzy regression model (1.1):
Condition A.
A
1: X
ni=1
(x
i− ¯ x
n)(l
yi− ¯l
yn) > 0.
A
2: X
ni=1
(x
i− ¯ x
n)(r
yi− ¯ r
yn) > 0.
A
3: X
ni=1
(x
i− ¯ x
n)(¯ x
nl
yi− x
i¯l
yn) > 0.
A
4: X
ni=1
(x
i− ¯ x
n)(¯ x
nr
yi− x
ir ¯
yn) > 0.
In the above conditions, ¯ x
n, ¯ r
yn, and ¯l
ynsignify the standard mean of
input and of the right endpoint and the left endpoint in fuzzy output,
respectively.
We present the sufficient conditions for the fuzzy regression model in the following theorem. For the proof, see Diamond [5].
Theorem 2.1. For the fuzzy regression model (1.1), suppose that Condition A is fulfilled. Then the left spread and the right spread of the estimated fuzzy output are always greater than zero. That is, estimated fuzzy output satisfies the condition for fuzzy numbers.
As before mentioned, many scholars defined the distance between two fuzzy numbers, and estimated regression coefficients by applying the defined distance to the fuzzy regression model. We denote the value that minimizes objective function P
ni=1
D
d(Y
i, A
0+A
ix
i) using the fuzzy distance D
d(Y
i, A
0+ A
ix
i) suggested by Diamond as ˆ A
d. Similarly to A ˆ
d, we denote the estimator suggested by Ming as ˆ A
m, that by Chang as ˆ A
ch, and that by Chen as ˆ A
c.
The following theorem shows that fuzzy regression coefficients esti- mated by mutually different methods are the same.
Theorem 2.2. Suppose that the fuzzy regression model (1.1) satisfies Assumptions given in Theorem 2.1. Then, estimators ˆ A
d, estimators A ˆ
m, estimators ˆ A
ch, and estimators ˆ A
care all the same as the least squares fuzzy estimators ˆ A suggested in Theorem 2.1.
Proof. It suffices to show that the mutually different fuzzy estimators have same normal equation. For this, the derivatives of the function Q
n(a, l, r) with respect to the six unknowns need to be derived, set to zero, and then solved for the six unknowns. From the derivatives of the function Q
n(a, l, r) with respect to the unknowns a
0, a
1, l
0, l
1, r
0, r
1and rearranging the terms of equation, we obtain the following six sets of normal equations which are well-known equations:
na
0+ X
n i=1x
ia
1= X
ni=1
y
i, X
ni=1
x
ia
0+ X
n i=1x
i2a
1= X
ni=1
x
iy
i,
nl
0+ X
n i=1x
il
1= X
ni=1
l
yi, X
n i=1x
il
0+ X
n i=1x
i2l
1= X
ni=1
x
il
yi,
nr
0+ X
ni=1
x
ir
1= X
ni=1
r
yi, X
ni=1
x
ir
0+ X
n i=1x
i2r
1= X
n i=1x
ir
yi. By simple calculation, we know that the sets of the normal equations for the objective functions
X
n i=1D
d(Y
i, A
0+ A
ix
i), X
ni=1
D
m(Y
i, A
0+ A
ix
i),
X
n i=1D
ch(Y
i, A
0+A
ix
i), and X
ni=1
D
c(Y
i, A
0+A
ix
i) are all equal to the form of the normal equations given from above. So, the four fuzzy estimators are all identical.
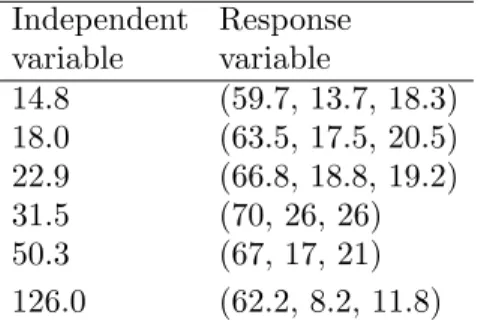
Example 2.3 Table 2.1 shows the data suggested by Chang [3] and analyzed with Pierpaolo [11].
Table 2.1: Numerical data for Example 2.3 Independent Response
variable variable
14.8 (59.7, 13.7, 18.3) 18.0 (63.5, 17.5, 20.5) 22.9 (66.8, 18.8, 19.2) 31.5 (70, 26, 26) 50.3 (67, 17, 21) 126.0 (62.2, 8.2, 11.8)
The fuzzy regression model using non-fuzzy input x
iand fuzzy output Y
iin Table 2.1 results in
Y ˆ
i= (44.716 + 0.075x
i, 65.478 − 0.014x
i, 88.341 − 0.091x
i).
The left endpoint, 62.716, of the fuzzy output value for input value x = 240 is larger than its center, 62.118 and the right endpoint, 59.949, of the fuzzy output value for input value x = 312 is smaller than its center, 61.11. That is, the estimated fuzzy output ˆ Y
icannot be a fuzzy number because the center point is larger than the right endpoint or smaller than the left endpoint. The reason may be attributed to the fact that the values of
X
n i=1(x
i− ¯ x
n)(l
yi− ¯l
yn) and X
n i=1(x
i− ¯ x
n)(r
yi− ¯ r
yn) suggested by Condition A are -788 and -687, respectively, being smaller than 0.
As in Example 2.3, there exists a problem that the estimated fuzzy outputs do not satisfy the assumption for the fuzzy regression model.
So, in this case we have to introduce new method to construct the fuzzy
regression model.
3. Censored fuzzy regression model
As identified in Section 2, in order to estimate fuzzy regression coef- ficients using the least squares method that play an important role in the regression model, certain conditions must be satisfied. Therefore, new methods are required to be studied to estimate the data that are not able to satisfy the sufficient condition suggested in the previous sec- tion with the fuzzy regression model. In the fuzzy regression model, the center point of the estimated fuzzy output must be larger than the left endpoint and smaller than the right endpoint. That is to say, the right endpoint of the estimated fuzzy output must be at least larger than the center of the estimated fuzzy output but the left endpoint of the esti- mated fuzzy output may not be larger than the center of the estimated fuzzy output. In order to employ this nature, we apply censored data used in statistics to fuzzy regression analysis.
Tobin [17] applied the concept of censoring to regression analysis for the first time, see Kmenta [9]. He inquired into the relations between expenditure and income, recognized that expenditure in the home may be more than zero, utilizing censored data to estimate the regression model.
We call the fuzzy regression model using censored data a censored fuzzy regression model and we consider a two-stage procedure to esti- mate the fuzzy regression model using censored data, as follows:
Step I. We use the objective functions to estimate the center of fuzzy regression coefficient A
jusing the center of fuzzy numbers Y
iand A
0+ A
1x
i, as follows:
X
n i=1ρ(y
i− a
0− a
1x
i) = min!, where ρ is a continuous function on R.
In particular, the estimators ˆa
ibecomes the least square estimators in case of ρ(x) = x
2and when ρ(x) = |x|, it becomes the least absolute deviation estimators.
Step II. We put l
minand r
minas the least left and right spreads among observed fuzzy outputs, respectively. We can obtain the right and the left spreads of the predicted fuzzy output using the following equation with the concept of censoring:
X
n i=1³
r
yi− max ©
ˆa
0+ ˆa
1x
i+ r, ˆa
0+ r
0+ (ˆa
1+ r
1)x
iª´
2= min!
and X
ni=1
³
l
yi− min ©
ˆa
0+ ˆa
1x
i− l, ˆa
0+ l
0+ (ˆa
1+ l
1)x
iª´
2= min!
subject to
r > min{r
y1− y
1, . . . , r
yn− y
n} and l > min{y
1− l
y1, . . . , y
n− l
yn}.
If we suppose that l > 0 and r > 0 in the above inequality, a case may occur in which the center and endpoint of the estimated fuzzy output may be nearly identical. So, we used the inequality to prevent the case in which the right and the left spreads approximate zero and to use the information of the given data.
Furthermore if the given data satisfy Condition A given in Section 2, when we put l and r suggested in Step II as 0 and 0, respectively, the fuzzy regression model can be estimated by the same method as that of the estimators made mention in Section 2.
In the following example we find the censored fuzzy regression model for the case satisfying the sufficient condition for the fuzzy regression model.
Example 3.1. The following data is an example given by Tanaka et al. [15], and the fuzzy regression model estimated using censored data is as follows:
f ˆ
r(x) =
½ 9.05 + 0.71x if x ≤ 2 7.05 + 1.71x if x > 2, f ˆ
c(x) = 4.45 + 1.71x, and
f ˆ
l(x) =
½ 2.65 + 1.71x if x ≤ 4 5.21 + 1.07xx if x > 4,
where ˆ f
r, ˆ f
c, and ˆ f
ldenote the function for right endpoint, the function for center point, and the function for left endpoint, respectively.
However, in the data presented in Table 3.1, Condition C
1and C
2are
positive number and Condition C
3and C
4are negative number. As the
data satisfy the conditions given in Theorem 2.1, the fuzzy regression
model can be estimated by putting l = r = 0. Table 3.1 shows the result
estimated using Step I and Step II in case of l = r = 0.
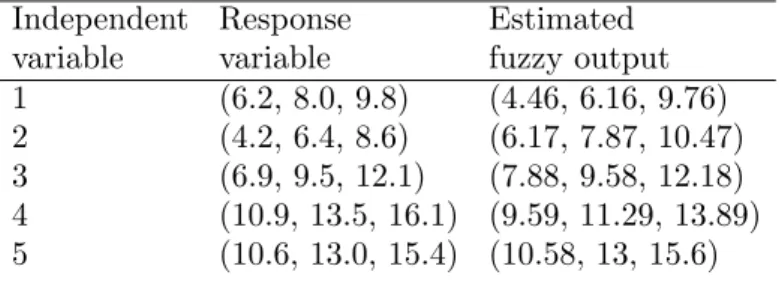
Table 3.1: Numerical data and the estimated outputs for Example 3.1
Independent Response Estimated
variable variable fuzzy output 1 (6.2, 8.0, 9.8) (4.46, 6.16, 9.76) 2 (4.2, 6.4, 8.6) (6.17, 7.87, 10.47) 3 (6.9, 9.5, 12.1) (7.88, 9.58, 12.18) 4 (10.9, 13.5, 16.1) (9.59, 11.29, 13.89) 5 (10.6, 13.0, 15.4) (10.58, 13, 15.6)
Example 3.1 implies that the censored fuzzy regression model extends the fuzzy regression analysis given by many authors.
4. Numerical example
In order to use, in fuzzy regression analysis, the data in which inputs are non-fuzzy numbers and outputs fuzzy numbers, certain conditions must be satisfied. However, even in the case that the sufficient condi- tion is not satisfied, the fuzzy regression model can be estimated using censored data.
In this section, we first identify through the following example that in the censored fuzzy regression model the center and end points of the estimated fuzzy outputs do not cross at all and then compare two meth- ods to estimate the center and end points of fuzzy regression coefficients with the least squares method and the least absolute deviation method.
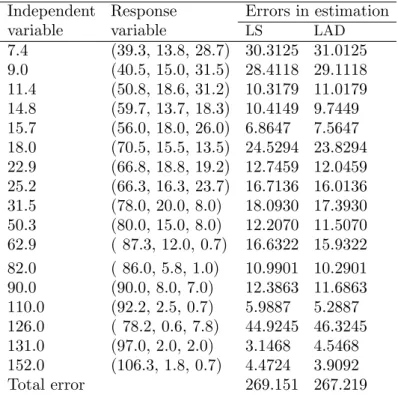
Example 4.1. The data on the left of Table 4.1 was introduced by Chang et al. [3].
As in Example 2.3, it does not satisfy Condition A
1and A
2, there occurs the phenomenon that the center and end points of the estimated fuzzy output cross each other in cases when the input is either 128 or 148. In order to solve the problem of crossing, the result estimated using the censored fuzzy regression model is as follows:
f ˆ
r(x) =
½ 78.27145 + 0.1535x if x < 126 55.3673 + 0.3411x if x ≥ 126, f ˆ
c(x) = 54.6672 + 0.3411x,
and
f ˆ
l(x) =
15.6144 + 1.5675x if x < 25.2
35.9349 + 0.7611x if 25.2 ≤ x < 31.5
49.1672 + 0.3411x if x ≥ 31.5.
Table 4.1: Numerical data and the estimation errors for Example 4.1 Independent Response Errors in estimation
variable variable
LS LAD7.4 (39.3, 13.8, 28.7) 30.3125 31.0125 9.0 (40.5, 15.0, 31.5) 28.4118 29.1118 11.4 (50.8, 18.6, 31.2) 10.3179 11.0179 14.8 (59.7, 13.7, 18.3) 10.4149 9.7449 15.7 (56.0, 18.0, 26.0) 6.8647 7.5647 18.0 (70.5, 15.5, 13.5) 24.5294 23.8294 22.9 (66.8, 18.8, 19.2) 12.7459 12.0459 25.2 (66.3, 16.3, 23.7) 16.7136 16.0136 31.5 (78.0, 20.0, 8.0) 18.0930 17.3930 50.3 (80.0, 15.0, 8.0) 12.2070 11.5070 62.9 ( 87.3, 12.0, 0.7) 16.6322 15.9322 82.0 ( 86.0, 5.8, 1.0) 10.9901 10.2901 90.0 (90.0, 8.0, 7.0) 12.3863 11.6863 110.0 (92.2, 2.5, 0.7) 5.9887 5.2887 126.0 ( 78.2, 0.6, 7.8) 44.9245 46.3245 131.0 (97.0, 2.0, 2.0) 3.1468 4.5468 152.0 (106.3, 1.8, 0.7) 4.4724 3.9092
Total error 269.151 267.219
Unlike the fuzzy regression model, we known that the left spread and the right of the predicted censored fuzzy regression model are greater than zero from Example 4.1.
On the other hand, the last two columns of Table 4.1 show the er- rors obtained from using the Least Squares (LS) method and the Least Absolute Deviation (LAD) estimation. We can see that due to the ab- normal position of the center point of the given data, errors of the least squares method are larger than those of the least absolute deviation method. Thus, it is well justified to use the censored data method we have developed newly.
5. Conclusion
In this paper several methods that estimate the fuzzy regression
model initiated by Tanaka et. al show the same results. And it carefully
considered the problem that the estimated fuzzy outputs in the fuzzy
regression model cross. In order to solve the problem of the crossing of
the estimated fuzzy outputs, the sufficient condition was suggested, and
in case that the suggested sufficient condition cannot be satisfied, the censored fuzzy regression model using censored data was suggested.
We verified that the fuzzy regression model with censored data was an extension of the fuzzy regression model and identified the solution of the problem of the crossing of the fuzzy outputs from which the censored regression model was estimated.
If the data for fuzzy regression model is unable to satisfy linearity, it is not appropriate to use the fuzzy regression model. Therefore, we need to study methods of how to interpret fuzzy data given using a segmented regression model or a semi-parametric regression that are used in regression analysis.
References
[1] Y. O. Chang, Hybrid fuzzy least-squares regression analysis and its reliability mea- sures, Fuzzy Sets and Systems 119 (2001), 225–246.
[2] Y. O. Chang and B. M. Ayyub, Fuzzy regression methods-a comparative assess- ment, Fuzzy Sets and Systems 19 (2001), no. 2, 187–203.
[3] P. Chang, E. S. Lee, and S. A. Konz, Applying fuzzy linear regression to VDT legibility, Fuzzy Sets and Systems 80 (1996), 197–204.
[4] Y. S. Chen, Fuzzy ranking and quadratic fuzzy regression, Computers Math. Ap- plic. 38 (1999), 265–279.
[5] P. Diamond, Fuzzy least squares, Inform. Sci. 46 (1988), no. 3, 141–157.
[6] P. Diamond and P. Kloeden, Metric spaces of fuzzy sets: Theory and application, World Scientific Publishing Co., 1994.
[7] P. Diamond and R. Korner, Extended fuzzy linear models and least-squares esti- mates, Comput. Math. Appl. 9 (1997), no. 9, 15–32.
[8] C. Kao and C. Chyu, A fuzzy linear regression model with better explanatory power, Fuzzy Sets and Systems 126 (2002), no. 3, 401–409.
[9] J. Kmenta, Elements of econometrics, Reprint of the 1986 second edition, Uni- versity of Michigan Press, 1997.
[10] M. Ming, M. Friedman, and A. Kandel, General fuzzy least squares, Fuzzy Sets and Systems 88 (1997), no. 1, 107–118.
[11] D. Pierpaolo, Linear regression analysis for fuzzy/crisp input and fuzzy/crisp output data, Comput. Statist. and Data Anal. 42 (2003), no. 1-2, 47–72.
[12] D. Savic and W. Pedryzc, Evaluation of fuzzy linear regression models, Fuzzy Sets and Systems 39 (1991), no. 1, 51–63.
[13] H. Tanaka, Fuzzy data analysis by possibilistic linear models, Fuzzy Sets and Systems 24 (1987), no. 3, 363–375.
[14] H. Tanaka, I. Hayashi, and J. Watada, Possibilistic linear regression analysis for fuzzy data, European J. Oper. Res. 40 (1989), no. 3, 389–396.
[15] H. Tanaka, S. Uejima, and K. Asai, Fuzzy linear regression model, International Congress on Applied Systems and Cybernetics 4 (1980), 2933–2938.
[16] , Linear regression analysis with fuzzy model, IEEE Trans. Systems Man Cybernet 12 (1982), 903–907.
[17] J. Tobin, Estimation of relationships for limited dependent variables, Economet- rica 26 (1958), 24–36.
[18] H. J. Zimmermann, Fuzzy set theory-and its applications, Kluwer Academic Pub- lishers, 1996.