Korean Circulation Journal
Introduction
Arterial stiffness (AS) is an early manifestation of adverse
structural and functional changes in the vessel wall, which are related to a wide spectrum of major clinical endpoints including atherosclerosis, hypertension (HT), diabetes mellitus (DM), chronic renal disease, valvular heart disease, hypertrophic cardiomyopathy, congenital heart disease, and connective tissue disorders.
1)Increased arterial stiffness is known to be associated with several cardiovascular risk factors such as hypercholesterolemia, HT, DM, metabolic syndrome, and obesity.
1)AS has been reported as an important predictor of cardiovascular (CV) morbidity and mortality in both the general population and in people with the obstructive sleep apnea syndrome (OSAS).
2)Numerous ultrasonographic parameters—
including pulse wave velocity (PWV), carotid artery intima-media thickness (CIMT), and flow-mediated dilatation (FMD)—can be used to identify arterial stiffness at an early stage.
3)OSAS is a condition characterized by repetitive episodes of
Print ISSN 1738-5520 • On-line ISSN 1738-5555
A Novel Echocardiographic Method for Assessing Arterial Stiffness in Obstructive Sleep Apnea Syndrome
Serkan Akdag, MD
1, Aytac Akyol, MD
1, Huseyin Altug Cakmak, MD
2, Hulya Gunbatar, MD
3, Muntecep Asker, MD
1, Naci Babat, MD
1, Aydin Rodi Tosu, MD
4, Mehmet Yaman, MD
5, and Hasan Ali Gumrukcuoglu, MD
11
Department of Cardiology, Yuzuncu Yil University Medical Faculty, Van,
2Department of Cardiology, Rize Kackar Government Hospital, Rize,
3Department of Pulmonary Diseas, Yuzuncu Yil University Medical Faculty, Van,
4Department of Cardiology, Mehmet Akif Ersoy Thoracic and Cardiovascular Surgery Education and Training Hospital, Istanbul,
5
Department of Cardiology, Samsun Education and Training Hospital, Samsun, Turkey
Background and Objectives: Obstructive sleep apnea syndrome (OSAS) is associated with increased arterial stiffness and cardiovascular complications. The objective of this study was to assess whether the color M-mode-derived propagation velocity of the descending thoracic aorta (aortic velocity propagation, AVP) was an echocardiographic marker for arterial stiffness in OSAS.
Subjects and Methods: : The study population included 116 patients with OSAS and 90 age and gender-matched control subjects. The patients with OSAS were categorized according to their apnea hypopnea index (AHI) as follows: mild to moderate degree (AHI 5-30) and severe degree (AHI≥30). Aortofemoral pulse wave velocity (PWV), carotid intima-media thickness (CIMT), brachial artery flow-mediated dilatation (FMD), and AVP were measured to assess arterial stiffness.
Results: AVP and FMD were significantly decreased in patients with OSAS compared to controls (p<0.001). PWV and CIMT were increased in the OSAS group compared to controls (p<0.001). Moreover, AVP and FMD were significantly decreased in the severe OSAS group compared to the mild to moderate OSAS group (p<0.001). PWV and CIMT were significantly increased in the severe group compared to the mild to moderate group (p<0.001). AVP was significantly positively correlated with FMD (r=0.564, p<0.001). However, it was found to be significantly inversely related to PWV (r=-0.580, p<0.001) and CIMT (r=-0.251, p<0.001).
Conclusion: The measurement of AVP is a novel and practical echocardiographic method, which may be used to identify arterial stiffness in OSAS. (Korean Circ J 2015;45(6):500-509)
KEY WORDS: Aortic velocity propagation; Obstructive sleep apnea; Vascular stiffness; Pulse wave analysis; Echocardiography.
Received: February 20, 2015 Revision Received: March 31, 2015 Accepted: June 2, 2015
Correspondence: Serkan Akdag, MD, Department of Cardiology, Yuzuncu Yil University Medical Faculty, Van 65100, Turkey
Tel: 90-5546-983126, Fax: 90-4322-167325 E-mail: [email protected]
• The authors have no financial conflicts of interest.
This is an Open Access article distributed under the terms of the Creative Commons Attribution Non-Commercial License (http://creativecommons.
org/licenses/ by-nc/3.0) which permits unrestricted non-commercial use,
distribution, and reproduction in any medium, provided the original work
is properly cited.
complete or partial obstruction of the upper airway during sleep.
The important role of OSAS in the initiation and progression of atherosclerosis and increased arterial stiffness has been reported in a recent study.
4)OSAS is also related to major adverse outcomes in various cardiovascular diseases. This is because these episodes of obstruction cause a reduction in the supply of oxygen to vital organs and also irregularity in cardiovascular rhythms.
5)In previous studies, aortic stiffness has been associated with both the presence and the severity of OSAS.
6)It has recently been reported that color M-mode-derived propagation velocity measured along the origin of the descending thoracic aorta (aortic velocity propagation, AVP) is associated with atherosclerosis, coronary artery disease, coronary slow flow, and type 2 diabetes mellitus.
7)8)9)In the atherosclerotic vessel walls, increased aortic resistance secondary to atherosclerosis may be reflected in a decrease in the flow propagation speed within the arterial lumen.
The aims of the present study were to investigate the relationship between AVP and atherosclerosis, the association of AVP with PWV, CIMT, and FMD, and to investigate whether AVP can be used as a parameter of AS in patients with OSAS.
Subjects and Methods
Patient selection
This is a cross-sectional observational study. A total of 150 patients, who were admitted to outpatient clinics of the university hospital with a diagnosis of OSAS between March and October 2014 consecutively, and 120 age and gender-matched control subjects were included in this study. The diagnosis of OSAS, in this case, had been based on the defined criteria specific to this study.
10)The control group composed of consecutive subjects, based on a clinical referral, suspected of having OSA admitted to the sleep laboratory at the university hospital, for overnight sleep observation (polysomnography) between March and October 2014.
The exclusion criteria for the present study were as follows:
moderate to severe renal or hepatic diseases (n=5), advanced coronary artery disease (n=9), aortic aneurysm or aortic tortuousity (n=3), uncontrolled hypertension (n=8), valvular heart disease (n=7), hemodynamically significant ventricular arrhythmias (n=3), atrial fibrillation (n=4), malignancies (n=2), acute or chronic inflammatory disease (n=5), hematologic disorders or blood viscosity problems (n=2), inadequate echocardiographic image quality (n=12) and patients with uncontrolled respiration during procedure (n=4). After applying this exclusion criterion, 116 patients with OSAS and 90 control subjects were enrolled into the study. The patients with OSAS were also categorized according to their apnea-hypopnea
index (AHI) as follows: mild to moderate degree (AHI 5-30) and severe degree (AHI≥30).
Demographic and clinical characteristics of the study groups included age, gender, neck circumference, waist circumference, and body mass index (BMI). Also, their medical histories for well known risk factors for atherosclerosis such as hypertension, diabetes mellitus, and smoking were collected. Other determinant factors that were considered included medicationsthat used for hypertension and diabetes, Epworth sleepiness scale scores, and a collection of medical histories regarding sleep habits from the patient records.
Posteroanterior chest x-rays, respiratory function tests, and electrocardiography, which were performed before polysomnography (PSG), were assessed. Arterial stiffness was evaluated by a two dimensional transthoracic echocardiography . The eligible patients, who were between 18 and 80 years, were all able to provide a written informed consent as a prerequisite for enrollment. This study complies with the Declaration of Helsinki, and the trial protocol was approved by the local ethics committee.
Polysomnography
An overnight polysomnography procedure was performed with the 16-channel Embla (Medcare Inc., Reykjavik, Iceland) and continuous technical monitoring of sleep. The system had 2 channels of electrooculography, 4 channels of electroencephalography (EEG) (with electrode placements at C4-A1, C3-A2, O2-A1, and O1- A2), sub-mental electromyelography (EMG), tibial EMG, oro-nasal air flow, pulse oximeter oxygen saturation, thoracic and abdominal movements, body position detector, tracheal sound, and electrocardiogram. Apnea was defined as the complete cessation of airflow lasting more than 10 seconds. Hypopnea was defined as a reduction>30% in airflow lasting more than 10 seconds accompanied by >4% desaturation and/or arousal. The average number of episodes of apnea and hypopnea per hour of sleep were measured according to the AHI. The OSAS diagnosis was made on the basis of AHI>5. Sleep stages were scored following standard criteria with 30-second epochs and were reviewed and verified by a certified sleep physician.
Transthoracic echocardiographic examination
The two-dimensional transthoracic echocardiographic
examination was performed at rest and according to established
standards. This method was preferable because of its non-
invasiveness, high accuracy, and speediness in assessing the overall
condition of the heart. The factors evaluated include the strength of
the heart, the condition of the endocardium, heart valves, and the
aorta. The examination was intended to diagnose a variety of other
findings – hypertrophy, cardiac tumors, diastolic function, ventricular dyssynchrony, etc. – that would be of relevance to this study. The examination was performed using a commercially available echocardiographic device (Vivid 3, General Electric, Chicago, IL, USA) with a 3.0-MHz transducer and with the patient in the left lateral decubitus position. The echocardiogram was performed by two experienced cardiologists who were totally unaware of the clinical data and ongoing medical therapy.
Aortic velocity propagation
AVP measurement was performed using a commercially available echocardiographic device (Vivid 3, General Electric, Chicago, IL, USA) with a 3.0-MHz transducer. From a suprasternal window and in a supine position, color M-mode Doppler recordings (Vivid 3, General Electric, Chicago, IL, USA) were obtained with the cursor parallel to the main flow of direction in the descending aorta. The color Doppler Nyquist limit was adapted to 30–50 cm/s, switching to the M-mode with a recorder sweep rate of 200 mm/s. An M-mode spatiotemporal velocity map in the shape of a flame is displayed (Fig. 1). If the slope of the flame was unclear, baseline shifting was used to change the aliasing velocity until a clear delineation of the velocity slope was seen. The aortic flow propagation velocity was then calculated by dividing the distance between points corresponding to the beginning and end of the propagation slope by the duration between corresponding time points. Thus, AVP corresponds to the velocity at which the flow is propagating down the artery. The mean of at least three consecutive measurements was recorded as the AVP value. The AVP was chosen because of its simplicity, feasibility, reproducibility, sensitivity, and acceptable specificity. This examination was also found to be handy in cardiovascular risk estimation and selection of high-risk candidates who needed additional exams. The AVP is also a non-invasive examination,
making it suitable for the volunteering subjects of this study.
Pulse wave velocity
PWV was measured non-invasively by using the commercially available device (VP-2000, Colins, Kyoto, Japan). PWV measurements were performed by a single well-trained clinical technician at the supine position in a quiet and temperature controlled room after at least 10 minutes of rest. Pulsed-wave Doppler recordings (VP-2000, Colins, Kyoto, Japan) were acquired from the descending thoracic artery at the origin of the subclavian artery and the left common femoral artery in the supine position. Wave front arrival at each location was defined by extrapolation of the ascending Doppler flow profile to the baseline using the electrocardiographic R-wave (Marquette Case, Hellige Medical System, Cardiosmart, Hellige Instrument Company, Freiburg, Germany) as a time reference. The descending aortofemoral PWV was determined by dividing the distance (measured on the body surface using a tape measure) by the time delay between two points. The mean of five successive readings to cover a complete respiratory cycle was used in the analysis.
Carotid artery intima-media thickness measurements
Intima-media thickness (IMT) of the subjects’ bilateral common carotid arteries was measured longitudinally with a 7-MHz transducer attached to an available machine (Vivid 3, GE Medical Systems, Horten, Norway). The bulb dilation served as a landmark to indicate the border between the distal common carotid artery and the carotid bulb. Images were obtained from the distal portion of the common carotid artery, 1–2 cm proximal to the carotid bulb. The two bright echogenic lines in the arterial wall were identified as the tunica intima and tunica media lines. The intima-media thickness was measured as the distance from the main edge of the first to
Fig. 1. Measurement of descending aorta propagation velocity: in a patient with the obstructive sleep apnea syndrome (A) and a subject in the control group (B). The aortic flow propagation velocity was calculated by dividing the distance between points corresponding to the beginning and end of the propagation slope by the duration between corresponding time points. DR: deceleration rate, CFM: color-flow mapping, PRF: pulse repetition frequency, LVR: left ventricular remodeling.
A B
the main edge of the second echogenic line. Only the far wall intima-media thickness of the distal 1 cm portion of the common carotid artery, just before bifurcation, was measured at the end- diastole (peak of the R-wave of ECG). Images showing the maximum intima-media thickness were stored in a digitized fashion, and CIMT measurements were made offline. Each measurement was
repeated three times, and the mean of the left and right common carotid arteries was used for analysis. Plaques (defined as ≥50%
localized thickening of the intima compared to the rest of the wall or as an endoluminal protrusion of the arterial lumen of ≥0.5 mm) were not included in the measurement of CIMT.
Table 1. Demographic, clinical, echocardiographic and laboratory characteristics of patient and control groups OSAS group
(n=116) Control group
(n=90) p
Age (years) 52.6±12.1 49.3±10.9 0.550
Male 68 (58.6) 50 (55.6) 0.660
Hypertension 48(41.4) 35 (38.9) 0.718
Diabetes 23 (19.8) 14 (15.6) 0.429
Smoking 34 (29.3) 23 (25.6) 0.551
Antihypertensive drugs 42 (36.2) 29 (32) 0.553
ACE inhibitors/ARBs 28 (24.1) 20 (22.2) 0.748
Calcium channel blockers 15 (12.9) 10 (11.1) 0.693
Diuretics 16 (13.8) 11 (12.2) 0.742
Beta-blockers 11 (9.5) 8 (8.9) 0.885
Alpha-blockers 4 (3.4) 3 (3.3) 0.964
Insulin 4 (3.4) 2 (2.2) 0.606
Oral antidiabetics 11 (9.5) 7 (7.8) 0.669
BMI (kg/m
2) 30.0±3.0 27.6±3.7 0.220
Neck circumference (cm) 41.2±2.7 40.5±2.2 0.084
Waist circumference (cm) 101.2±10.4 97.7±9.8 0.034
Waist to hip ratio 0.9±0.1 0.9±0.1 0.073
Systolic BP (mmHg) 135.4±8.3 133.8±7.5 0.254
Diastolic BP (mmHg) 85.1±10.3 83.9±9.1 0.328
Heart rate (beats/min) 75.2±9.2 73.8±11.4 0.241
Total cholesterol (mg/dL) 208.5±48.9 201.4±51.4 0.314
Tryglyceride (mg/dL) 192.6±82.5 186.8±44.5 0.446
LDL-C (mg/dL) 131.7±37.3 124.6±50.9 0.245
HDL-C (mg/dL) 38.2±5.8 39.5±5.7 0.127
LVEF (%) 63.1±2.7 64.1±2.5 0.199
DT (msec) 216.5±30.5 205.3±27.7 0.073
IVRT (ms) 104.4±15.5 99.9±17.8 0.053
Left atrial diameter (mm) 39.4±3.8 38.1±3.4 0.012
Left ventricular mass (g) 244.4±79.3 227.5±52.7 0.023
E/A ratio 1.05±0.3 1.12±0.4 0.013
AHI (per hour) 31.3±16.9 2.3±1.5 <0.001
SO
2min (%) 79.8±9.3 91.1±2.7 <0.001
SO
2mean (%) 89.7±2.7 94.2±1.8 <0.001
Data are expressed as mean±standard deviation or number (%). OSAS: obstructive sleep apnea syndrome, ACE: angiotensin-converting enzyme, ARB:
angiotensin receptor blocker, BMI: body mass index, BP: blood pressure, LDL-C: low density lipoprotein-cholesterol, HDL-C: high density lipoprotein-cho-
lesterol, LVEF: left-ventricular ejection fraction, DT: deceleration time, IVRT: isovolumic relaxation time, E/A: an early transmitral flow to a late flow with
atrial contraction, AHI: apne/hypopnea index, SO
2min: minimal oxygen saturation, SO
2mean: mean oxygen saturation
Assessment of the brachial artery flow-mediated dilatation The flow-mediated dilatation of the brachial artery was measured to assess endothelial function. FMD was measured using ultrasound unit electronic calipers (VIVID 7, General Electric, Waukesha, WI, USA) and a 10-MHz linear array transducer. All groups were abstained from caffeine-containing drinks for at least 12 hours.
They were kept in a supine position at a stable room temperature between 20 and 25°C during the ultrasonographic examination. To best visualize the brachial artery, the arm was comfortably immobilized in the extended position, and the brachial artery was scanned in a longitudinal section 3–5 cm above the antecubital fossa. After optimal transducer positioning, the skin was marked for reference for later measurements, and the arm was kept in the same position throughout the study. All measurements of the brachial artery lumen diameter were assessed at the end-diastole (timed by the QRS complex) and were calculated as the average of the measurements obtained during three consecutive cardiac cycles.
After recording baseline measurements, the cuff was inflated to 200 mmHg (or 50 mmHg higher than systolic blood pressure) for 5 minutes to create a transient forearm ischemia. Subsequently, the cuff was deflated, and the arterial diameter was measured at 30, 60, 90, and 180 seconds after deflation. The maximum diameter in each of these measurements was used in the calculation of FMD according to the following formula: (maximum diameter during reactive hyperemia−diameter at baseline)×100/(diameter at baseline).
Sixty patients were randomly included and Pearson correlation analysis was performed to assess intra- and interobserver variability.
Intraobserver variability for AVP, FMD, PWV and CIMT were 3.4±2.9% (r=0.89), 3.8±3.4% (r=0.87), 2.8±2.3% (r=0.88) and 1.9±0.8% (r=0.89) respectively (all p>0.05). Moreover, interobserver variability for AVP, FMD, PWV and CIMT were 3.6±3.5% (r=0.88), 4.1±3.7% (r=0.86), 3.1±2.9% (r=0.87) and 2.1±1.1% (r=0.91) respectively (all p>0.05).
Statistical analysis
Quantitative variables are expressed as mean±standard deviation
and qualitative variables as numbers and percentages. Differences between independent groups were assessed by Student’s t-test for normally distributed quantitative variables, Mann-Whitney’s U-test for variables without a normal distribution, and the chi-square test for qualitative variables. Pearson’s correlation analysis was used to assess the correlations between variables. All tests were performed with SPSS for Windows, version 10.0 (SPSS Inc., Chicago, IL, USA).
All results were considered statistically significant at the level of p<0.05.
Results
A total of 206 patients (116 patients with OSAS and 90 control subjects) were included in the present study. Baseline demographic, clinical, echocardiographic, and laboratory characteristics of the study groups were presented in Table 1. As we expected, waist circumferences were found to be significantly higher in the OSAS group compared to controls (p=0.034). AHI was found to be higher in the OSAS group compared to controls (31.3±16.9 vs. 2.34±1.52, p<0.001), while the rate of minimal and mean oxygen saturations were found to be decreased in patients with OSAS compared to control group (79.8±9.3 vs. 91.1±2.7, p<0.001 and 89.7±2.7 vs.
94.2±1.8, p<0.001 respectively). Moreover, left atrial diameter (p=0.012) and left ventricular mass (p=0.023) were significantly higher in the OSAS group compared to controls. The E/A ratio was significantly lower in the OSAS group compared to controls (p=0.013). There was no difference between the two groups in terms of other baseline characteristics. In the subgroup analysis of OSAS patients, waist circumference, left atrial diameter, left ventricular mass and E/A ratio were demonstrated significantly higher in the severe OSAS group compared to the mild to moderate group (p=0.048, p=0.032, p=0.036, and p=0.027 respectively).
Furthermore, AVP was found to be significantly lower in the severe OSAS group compared to the mild to moderate OSAS group (36.2±11.8 vs. 46±12.3; p<0.001). FMD was also lower in the severe group compared to the mild to moderate group (7.9±3.8 vs.
10.3±4.3; p<0.001). In addition, PWV was significantly higher in the
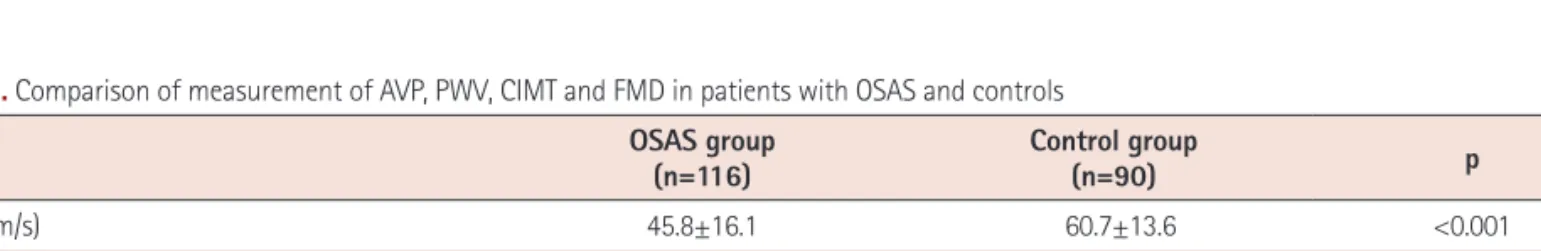
Table 2. Comparison of measurement of AVP, PWV, CIMT and FMD in patients with OSAS and controls OSAS group
(n=116) Control group
(n=90) p
AVP (cm/s) 45.8±16.1 60.7±13.6 <0.001
PWV (m/s) 10.3±2.2 8.5±2.0 <0.001
CIMT (mm) 0.8±0.1 0.7±0.1 <0.001
FMD (%) 8.7±3.3 14.6±4.6 <0.001
Data are expressed as mean±standard deviation or number (%). AVP: aortic velocity propagation, PWV: pulse wave velocity, CIMT: carotid intima‐me-
dia thickness, FMD: flow‐mediated dilatation, OSAS: obstructive sleep apnea syndrome
severe OSAS group compared to the mild to moderate group (11.4±2.2 vs.8.8±2.0; p<0.001). CIMT was also found to be significantly increased in the severe OSAS group compared to the mild to moderate OSAS group (0.89±0.18 vs. 0.77±0.16; p<0.005).
Patients with OSAS had significantly lower AVP (45.8±16.1 vs.
60.7±13.6 cm/s, p<0.001) (Fig. 2) and FMD (8.7±3.3 vs. 14.6±4.6 %,
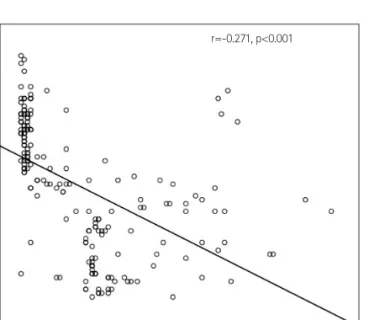
p<0.001) and higher PWV (10.3±2.2 vs. 8.5±2.0 m/s, p<0.001) and CIMT (0.83±0.14 vs. 0.66±0.15 mm, p<0.001) than the control subjects (Table 2). When the association between AVP and AHI was investigated, a significant inverse relation was found between them (r=-0.271, p<0.001) (Fig. 3). Moreover, AVP was found to be significantly positively correlated with FMD (r=0.564, p<0.001) (Fig.
4A). However, it was significantly inversely correlated with PWV (r=- 0.580, p<0.001) (Fig. 4B) and CIMT (r=-0.251, p<0.001) (Fig. 4C).
Furthermore, AVP was found to be significantly inversely correlated with age (r=-0.125; p<0.001). When the relationship between AVP and parameters of diastolic dysfunction was investigated; it was found to be significantly positively correlated with E/A (r=0.073;
p<0.001) and negatively correlated with deceleration time (r=-0.189;
p<0.001) and isovolumetric relaxation time (r=-0.217; p<0.001).
Discussion
OSAS is reported to be associated with various cardiovascular diseases, including hypertension, coronary artery disease, atrial fibrillation, cerebrovascular disease, and heart failure.
11)Recent studies have reported an important effects of OSAS, which is accompanied by recurrent hypoxia, arousals from sleep and generation of raised intrathoracic pressure, on cardiovascular system via several pathways such as sympathetic activation, inflammation, oxidative stress, endothelial dysfunction, and arterial stiffness.
12)Arterial stiffness, a biomarker of vascular aging, is an important risk factor for the development of atherosclerosis and other cardiovascular diseases. Furthermore, arterial stiffness has been reported to be associated with cardiovascular risk factors such as smoking, obesity, hypertension, hypercholesterolemia, diabetes, and advanced age.
10)11)12)Arterial stiffness is an independent predictor of fatal and non-fatal cardiovascular events in patients with OSAS.
13)A noninvasive assessment of AS with many different parameters has been reported in a previous study.
14)PWV measurement between the carotid and femoral artery is the gold standard method for the evaluation of arterial stiffness.
15)It is measured using pressure or volume pulse wave analysis with a transducer.
14)PWV was reported to be an important independent risk factor for coronary and peripheral atherosclerosis.
16)Moreover, there is marked evidence to indicate that PWV is a strong predictor of cardiovascular events in patients with OSAS.
13)A recent study has demonstrated the association of increased PWV with OSAS.
6)CIMT is a strong marker of subclinical atherosclerosis. Increased CIMT is a marker of structural vascular damage in arterial stiffness.
Increased CIMT has been found to be related to many cardiovascular risk factors, the severity of coronary atherosclerosis, and major
Groups
Mean±2 SE AVP (cm/s)
Control OSAS 65
60
55
50
45
40
Fig. 2. The error bar of AVP in patients with and without the obstructive sleep apne syndrome, AVP: aortic velocity propagation; OSAS: obstructive sleep apnea syndrome; SE: Standard error.
AHI (per hour)
AVP (cm/s)
0.00 15.00 30.00 45.00 60.00 75.00 90.00 105.00 r=-0.271, p<0.001
80.00
60.00
40.00
20.00
Fig. 3. Scatter plot of AVP for AHI. AVP: aortic velocity propagation, AHI:
apnea hypopnea index.
adverse cardiovascular events.
17)A few studies have focused on structural and functional modifications to the large arteries in OSAS, with the majority of them reporting increases in CIMT and PWV.
18)19)An important direct effect of OSAS on CIMT has been revealed by the studies of Silvestrini et al.
18)and Schulz et al.
19)In our study, CIMT and PWV values were demonstrated to be increased in patients with OSAS compared with age and gender-matched control subjects. Similarly, CIMT and PWV were also found to be significantly increased in the severe OSAS group compared to the mild to moderate OSAS group.
Brachial artery FMD has recently begun to be frequently used in a study of arterial physiology.
20)An impaired FMD response may reflect
a vascular phenotype prone to atherosclerosis. The usefulness of FMD in predicting the risk of atherosclerosis of OSAS patients has been evaluated in a few studies.
21)22)However, the defined procedures for the measurement of AS including carotid femoral or aortofemoral PWV, FMD, and CIMT are time consuming and not practical in daily practice.
Endothelial dysfunction is considered the first stage in the development of atherosclerosis. It has been shown that endothelial dysfunction might be affected by nocturnal hypoxemia in OSAS patients.
21)Many recent studies have also reported that decreased O
2saturation is a significant predictor for endothelial dysfunction.
21)22)On the other hand, FMD of the brachial artery is a Fig. 4. Scatter plot of AVP for FMD (A), AVP for PWV (B), AVP for CIMT (C). AVP: aortic velocity propagation, FMD: flow-mediated dilatation, PWV: pulse wave velocity, CIMT: carotid intima-media thickness.
FMD (%)
CIMT (mm)
PWV (m/s) 0.00 10.00 20.00 30.00
0.40 0.60 0.80 1.00 1.20 1.40
5.00 10.00 15.00 20.00 25.00
AVP (cm/s)AVP (cm/s) AVP (cm/s)
80.00
60.00
40.00
20.00
80.00
60.00
40.00
20.00
80.00
60.00
40.00
20.00 r=0.564, p<0.001
r=-0.251, p<0.001
r=-0.580, p<0.001