pISSN 2383-5702
ⓒCopyright 2016 by the Korean Society for Legal Medicine
Introduction
It has been generally accepted that blood serum and plasma are free of cellular components. Although the precise quality and quantity of DNA needed for reliable identification analysis is unknown [1,2], the cell debris and molecules released by cells during apoptosis are known to provide sufficient amounts of DNA for genetic analysis [1,3-6].
In real-time situations, serum/plasma samples can play a crucial role in personal identification. For
instance, if patient samples prepared for testing are mixed up in-hospital for any reason, the consequences can be critical. In such cases, the serum/plasma DNA can be extracted from the patient’s sample and can be used to conduct a search for the identification of its rightful owner.
Materials and Methods
Experiments were divided into time-temperature groups for serum and plasma with anticoagulant agents.
http://dx.doi.org/10.7580/kjlm.2016.40.3.78
Factors Affecting DNA Yields from Serum and Plasma Samples Used for Personal Identification Testing
Ji Hyun Lee
1*, Boram Kim
1*, Sohee Cho
2, Hee Jin Seo
1, Soong Deok Lee
1,21
Department of Forensic Medicine, Seoul National University College of Medicine, Seoul, Korea,
2Institute of Forensic Science, Seoul National University College of Medicine, Seoul, Korea
*These authors contributed equally to this work.
Serum or plasma is free of cellular components. As DNA is in the nucleus or mitochondria of a cell, it can be presumed that serum/plasma is DNA free.
However, there are cases wherein serum/plasma is the only resource available for identification analysis, yet no sufficient data are available regarding whether reliable DNA testing can be applied to such cases, and what the influencing factors are when testing is a valid course of action. The aim of this study is to illustrate the factors that can be used in the genetic testing of serum/plasma when identifying an individual. The results showed that the concentration of serum DNA significantly increased over time in 4°C storage, and the DNA yields from samples stored in heparin tubes were overall higher than from samples stored in ethylenediaminetetraacetic acid tubes. We observed that the concentration of DNA in serum successfully matched 100% to the short tandem repeat data of blood DNA.
Key Words: Serum; Plasma; DNA fingerprinting; Identification Received: July 26, 2016
Revised: August 22, 2016 Accepted: August 26, 2016 Correspondence to Soong Deok Lee
Department of Forensic Medicine, Seoul National University College of Medicine, 103 Daehak-ro, Jongno-gu, Seoul 03080, Korea
Tel: +82-2-740-8359
Fax: +82-2-764-8340
E-mail: [email protected]
Blood was collected twice from 15 healthy individuals (10 men and 5 women), and once from another 14 healthy individuals (9 men and 5 women, excluding one subject who withdrew from the first experiment).
The collection of samples for this study was conducted in accordance with the guidelines and approval of the Institutional Review Board of Seoul National University Hospital, Korea.
In order to set a parameter that affects the quantity and quality of DNA in a situation similar to that of a hospital, sample storage at room temperature and at 4°C was considered. Similarly, timeframe experiments were carried out assuming that the samples would be used within 48 hours, in accordance with the screening tests in a hospital, and that the results would be reported within 10 days. In the first experiment, samples stored for 0 hour, 1 hour, 2 hours, 4 hours, 8 hours, 12 hours, 1 day, and 2 days were analyzed; in the second experiment, those stored for 0, 1, 2, 3, 4, 5, 6, 7, 8, 9, and 10 days were analyzed.
For the anticoagulant experiment, with heparin and
ethylenediaminetetraacetic acid (EDTA), the samples were analyzed separately with storage time points of 0, 1, 3, and 7 hours. Blood samples were centrifuged at 3,000 ×g and dispensed into heparin and EDTA tubes at specific time points, taking great care not to mix the buffy coat or blood clots.
DNA was extracted from plasma and serum samples using a QIAamp Blood Kit (Qiagen, Valencia, CA, USA) according to the manufacturer’s recommendations.
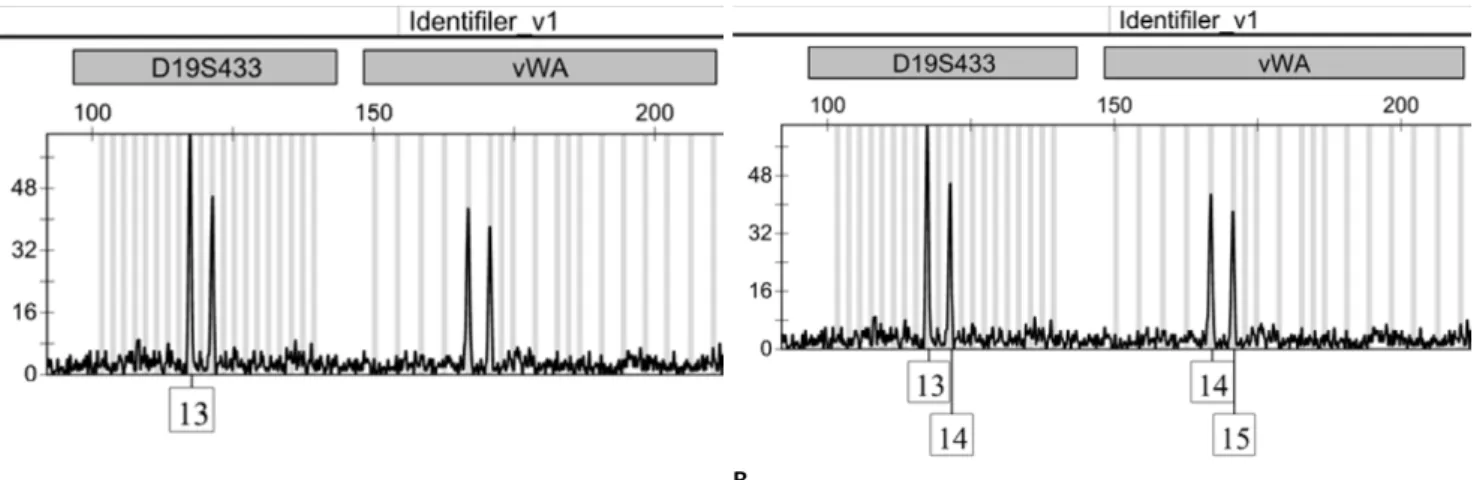
The quantity of DNA was determined using an Applied Biosystems Quantifiler Human DNA quantification Kit (Life Technologies, Carlsbad, CA, USA) on an Applied Biosystems 7000 sequence detection system (Life Technologies). The DNA was amplified using a AmpFLSTR Identifiler PCR Amplification Kit (Applied Biosystems, Foster City, CA, USA), and amplification was performed in a GeneAmp PCR 9700 thermocycler (Applied Biosystems) following the manufacturer’s guidelines. The polymerase chain reaction (PCR) products were analyzed using a 3130XL Genetic Analyzer (Life Technologies).
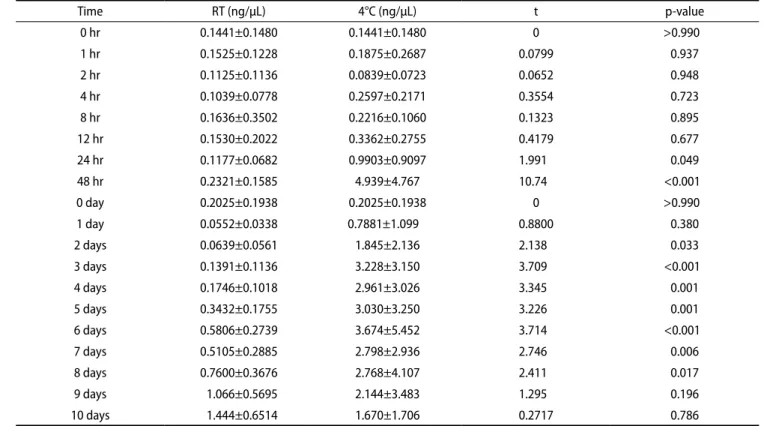
Table 1. Amount of DNA recovered from donors (15 and 14) with time-temperature differences by two-way ANOVA
Time RT (ng/μL) 4°C (ng/μL) t p-value
0 hr 0.1441±0.1480 0.1441±0.1480 0 >0.990
1 hr 0.1525±0.1228 0.1875±0.2687 0.0799 0.937
2 hr 0.1125±0.1136 0.0839±0.0723 0.0652 0.948
4 hr 0.1039±0.0778 0.2597±0.2171 0.3554 0.723
8 hr 0.1636±0.3502 0.2216±0.1060 0.1323 0.895
12 hr 0.1530±0.2022 0.3362±0.2755 0.4179 0.677
24 hr 0.1177±0.0682 0.9903±0.9097 1.991 0.049
48 hr 0.2321±0.1585 4.939±4.767 10.74 <0.001
0 day 0.2025±0.1938 0.2025±0.1938 0 >0.990
1 day 0.0552±0.0338 0.7881±1.099 0.8800 0.380
2 days 0.0639±0.0561 1.845±2.136 2.138 0.033
3 days 0.1391±0.1136 3.228±3.150 3.709 <0.001
4 days 0.1746±0.1018 2.961±3.026 3.345 0.001
5 days 0.3432±0.1755 3.030±3.250 3.226 0.001
6 days 0.5806±0.2739 3.674±5.452 3.714 <0.001
7 days 0.5105±0.2885 2.798±2.936 2.746 0.006
8 days 0.7600±0.3676 2.768±4.107 2.411 0.017
9 days 1.066±0.5695 2.144±3.483 1.295 0.196
10 days 1.444±0.6514 1.670±1.706 0.2717 0.786
Values are presented as mean±standard deviation.
RT, room temperature.
Results
Quantitative results are presented as the mean±standard deviation. Differences between groups were tested using a one-way analysis of variance (ANOVA); for repeated measures, a two-tailed unpaired t test (p-value) was used. Data analysis was performed using GraphPad Prism V6.0 software (Graphpad Software, San Diego, CA, USA) and Microsoft Excel 2007. A p<0.05 was considered statistically significant.
There was no statistically significant difference among the median cell-free DNA yields from blood samples stored at room temperature for various periods
(p>0.05, paired t test). However, in the case of samples stored at 4°C, we found a significant difference between the amount of cell-free DNA extracted immediately and that of cell-free DNA extracted 8, 12, 24, and 48 hours after venesection (p=0.010, p=0.004, p=0.003, p=0.001, paired t test).
Data from two-way ANOVA of the amount of DNA extracted from serum are presented in Table 1. A comparison analysis of the DNA yields by time points, from serum samples stored at room temperature and 4°C is demonstrated in Fig. 1A and B. The differences were observed depending on the time point, revealing an overall trend of the amount of DNA increasing over
Fig. 1. Box plots of DNA concentrations in serum (A, B) and plasma (C).
RT, room temperature; EDTA, ethylenediaminetetraacetic acid.
B
Time (day) A
Time (hr)
0 1 2 4 8 12 24 48
C
Time (hr)
0 1 3 7