Received: May 31, 2016 Revised: August 11, 2016 Accepted: September 1, 2016
Correspondence to: Jun Yong Choi, Department of Internal Medicine, Yonsei University College of Medicine, 50-1 Yonsei- ro, Seodaemun-gu, Seoul 03722, Korea
Tel: 02-2228-1974, Fax: 02-393-6884 E-mail: seran@yuhs.ac
*This study was supported by a grant of year 2014-2015 from the Korea Centers for Disease Control and Prevention.
전국의료관련감염감시체계 중환자실 부문 결과 보고:
2014년 7월부터 2015년 6월
곽이경1ㆍ최준용2ㆍ유현미3ㆍ이상오4ㆍ김홍빈5ㆍ한수하6ㆍ최희정7ㆍ김효열8ㆍ김성란9ㆍ김태형10 이혁민11ㆍ천희경12ㆍ김재석13ㆍ은병욱14ㆍ구현숙15ㆍ조은희15ㆍ어 영16ㆍ이경원11
인제대학교 의과대학 일산백병원 내과1, 연세대학교 의과대학 내과2, 인제대학교 상계백병원 감염관리실3, 울산대학교 의과대학 서울아산병원 감염내과4, 분당서울대학교병원 감염내과5, 순천향대학교 부천병원 감염관리실6,
이화여자대학교 의학전문대학원 내과7, 원주세브란스기독병원 내과8, 고려대학교 구로병원 감염관리실9, 순천향대학교 서울병원 내과10, 연세대학교 의과대학 진단검사의학과11, 경희대학교병원 감염관리실12, 한림대학교 의과대학 진단검사의학과13, 을지대학교 을지병원 소아과14, 질병관리본부 감염병감시과15,
원주세브란스기독병원 진단검사의학과16
Korean National Healthcare-associated Infections Surveillance System, Intensive Care Unit Module Report: Summary of Data from July 2014
through June 2015
Yee Gyung Kwak
1, Jun Yong Choi
2, Hyeonmi Yoo
3, Sang-Oh Lee
4, Hong Bin Kim
5, Su Ha Han
6, Hee Jung Choi
7, Hyo Youl Kim
8, Sung Ran Kim
9, Tae Hyong Kim
10, Hyukmin Lee
11, Hee Kyung Chun
12,
Jae-Seok Kim
13, Byung Wook Eun
14, Hyun-Sook Koo
15, En-Hi Cho
15, Young Uh
16, Kyungwon Lee
11Department of Internal Medicine, Inje University Ilsan Paik Hospital
1, Goyang, Department of Internal Medicine, Yonsei University College of Medicine
2, Infection Control Office, Inje University Sanggye Paik Hospital
3, Department of Infectious Diseases, Asan Medical Center, University of
Ulsan College of Medicine
4, Seoul, Department of Infectious Diseases, Seoul National University Bundang Hospital
5, Seongnam, Department of Infection Prevention and Control, Soonchunhyang University Bucheon Hospital
6, Bucheon, Department of Internal Medicine, Ewha Womans University School of Medicine
7, Seoul, Department of Internal Medicine, Wonju Severance Christian Hospital
8, Wonju, Infection Control Office, Korea University Guro Hospital
9, Department of Internal Medicine, Soonchunhyang University Seoul Hospital
10, Department of Laboratory Medicine, Yonsei University College of Medicine
11, Department of Infection Control, Kyunghee University Hospital
12, Seoul, Department of Laboratory Medicine, Hallym University College of Medicine
13, Chuncheon, Department of Pediatrics, Eulji University School of Medicine, Eulji General Hospital
14, Seoul,
Division of Infectious Disease Control, Korea Centers for Disease Control and Prevention
15, Osong, Department of Laboratory Medicine, Wonju Severance Christian Hospital
16, Wonju, Korea
Background: In this report, we present annual data of the intensive care unit (ICU) module of the Korean National Healthcare-associated Infections Surveillance System (KONIS) from July 2014 through June 2015.
Methods: We performed prospective surveillance of nosocomial urinary tract infection (UTI), bloodstream infection (BSI), and pneumonia (PNEU) cases at 169 ICUs in 96 hospitals using the KONIS surveillance system. Nosocomial infection (NI) rates were calculated as the numbers of infections per 1,000 patient-days or device-days.
Results: A total of 2,524 NIs were found during the study period: 699 UTIs (675 cases were urinary catheter-associated),
1,090 BSIs (932 were central line-associated), and 735 PNEUs (443 were ventilator-associated). The rate of urinary
catheter-associated UTIs (CAUTI) was 0.91 cases per 1,000 device-days (95% confidence interval, 0.84-0.98), and the
urinary catheter utilization ratio was 0.84 (0.839-0.841). The rate of central line-associated BSIs (CLABSI) was 2.04 (1.91-2.17), and the utilization ratio was 0.52 (0.519-0.521). The rate of ventilator-associated PNEUs was 1.23 (1.12-1.35), and the utilization ratio was 0.41 (0.409-0.411). The urinary catheter utilization ratio was lower; however, CAUTIs were more common in the ICUs of hospitals with 300-699 beds than in the ICUs of hospitals with more than 900 beds.
Conclusion: BSIs were the most commonly reported NIs. The rates of CAUTI and CLABSI were lower in this study period than during the previous period (July 2013 through June 2014).
Keywords: Intensive care unit, KONIS, Korean Nosocomial Infections Surveillance System, Nosocomial infection
Introduction
전국의료관련감염감시체계(Korean National Healthcare-associated Infections Surveillance System, KONIS)는 2006년도에 대한의료관련감염관리학회 와 질병관리본부가 운영하기 시작한 우리나라의 대표적인 의료관련감염 감시체계이다[1,2]. KONIS 는 전국에서 자발적으로 참여하는 병원들에 의해 이루어지며 표준화된 방법으로 각 병원의 중환자 실에서 발생하는 요로감염(urinary tract infection), 혈류감염(bloodstream infection)과 폐렴(pneumonia) 에 대한 감시를 수행하고 있다. 본 연구에서는 KONIS 중환자실 부문 2014년 7월부터 2015년 6월 까지의 연간 자료 결과를 분석하고 이를 토대로 과 거 KONIS 연간 자료들과 비교함으로써 KONIS의 기구일수 감염률과 기구사용률, 항생제 내성률의 추이를 알아보고자 한다.
Materials and Methods
2014년 7월부터 2015년 6월까지 300병상 이상 총 96개 병원에서 각 참여병원의 성인 중환자실 중 대표적인 내과계와 외과계 중환자실 또는 통 합중환자실을 대상으로 하여 총 169개 중환자실 이 참여하였다. 자료수집 방법은 전년도 KONIS 결과 보고와 동일하였다[3]. 연구 기간 동안 각 참여 중환자실에서 요로감염(urinary tract infec- tion), 혈류감염(bloodstream infection)과 폐렴(pneu- monia)에 대한 의료관련감염 감시를 수행하였다.
중환자실 의료관련감염과 요로감염, 혈류감염, 폐렴의 정의는 미국 질병관리본부(Center for
Disease Control and Prevention, CDC)의 정의에 근 거하였다[4]. 요로감염은 ‘증상이 있는 요로감염 (symptomatic urinary tract infection, SUTI)’과 ‘무 증상 균혈증 요로감염: asymptomatic bacteremic urinary tract infection, ABUTI)’을 포함하였고 혈 류감염은 ‘원인균 확인 혈류감염(laboratory-con- firmed bloodstream infection)’을 감시대상으로 하 였다. 폐렴은 ‘임상적 폐렴(clinically defined pneu- monia, PNEU1)’, ‘원인균 확인 폐렴(pneumonia with specific laboratory findings, PNEU2)’과 ‘면역 저하자 폐렴(pneumonia in immunocompromised patients, PNEU3)’으로 분류하였다[5]. 요로감염, 혈류감염과 폐렴에서 각각 요로카테터, 중심정맥 관 또는 인공호흡기와의 관련 여부를 구분하였 다. 항생제 감수성 결과가 있는 주요 세균을 대 상으로 항생제에 대한 내성률을 조사하였고 중 등도 내성은 내성에 포함시켜 분석하였다. KONIS 의료관련감염감시가 기구일수 감염률에 미친 영 향을 분석하기 위해 2014년 7월-2015년 6월 기간 의 기구일수 감염률 자료를 2010년 7월-2014년 6 월 사이 4년간의 연간자료와 비교하였다[3,6-8].
95% 신뢰구간이 겹치지 않는 경우 유의한 차이
가 있는 것으로 판단하였다. 또한, KONIS 연간
자료가 처음으로 보고되기 시작한 2007년 7월 이
후 8년 간의 연간자료를 이용하여 항생제 내성균
의 빈도와 중심정맥관 관련 혈류감염 및 인공호
흡기 관련 폐렴의 감염률의 변화를 살펴보았다
[3,6-8]. 2011년 10월부터 무증상 세균뇨(asympto-
matic bacteriuria)가 감시대상에서 제외되어 연도
별 비교 분석이 제한적인 요로감염은 제외하였다.
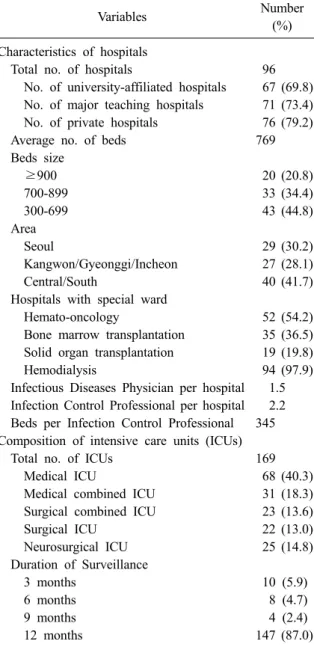
Table 1. Characteristics of hospitals and intensive care units participated in KONIS from July 2014 through June 2015
Variables Number
(%) Characteristics of hospitals
Total no. of hospitals 96
No. of university-affiliated hospitals 67 (69.8) No. of major teaching hospitals 71 (73.4) No. of private hospitals 76 (79.2)
Average no. of beds 769
Beds size
≥900 20 (20.8)
700-899 33 (34.4)
300-699 43 (44.8)
Area
Seoul 29 (30.2)
Kangwon/Gyeonggi/Incheon 27 (28.1)
Central/South 40 (41.7)
Hospitals with special ward
Hemato-oncology 52 (54.2)
Bone marrow transplantation 35 (36.5) Solid organ transplantation 19 (19.8)
Hemodialysis 94 (97.9)
Infectious Diseases Physician per hospital 1.5 Infection Control Professional per hospital 2.2 Beds per Infection Control Professional 345 Composition of intensive care units (ICUs)
Total no. of ICUs 169
Medical ICU 68 (40.3)
Medical combined ICU 31 (18.3) Surgical combined ICU 23 (13.6)
Surgical ICU 22 (13.0)
Neurosurgical ICU 25 (14.8)
Duration of Surveillance
3 months 10 (5.9)
6 months 8 (4.7)
9 months 4 (2.4)
12 months 147 (87.0)
Results
1. KONIS 참여병원과 참여중환자실의 특성 2014년 7월부터 2015년 6월까지 KONIS 중환 자실 부문에 참여한 병원과 중환자실의 특성은 Table 1과 같다. 총 96개의 참여병원 중 대학병원 은 67개(69.8%)이었고 주교육병원은 71개(73.4%) 였다. 병상 규모별로는 300-699병상 병원이 43개 (44.8%), 700-899병상 병원이 33개(34.4%), 900병 상 이상 병원이 20개(20.8%)이었고, 평균 병상 수
는 769개이었다. 지역별로는 서울에 위치한 병원 이 29개(30.2%), 강원/경기/인천 지역 병원이 27 개(28.1%), 중남부권역 지역의 참여병원이 40개 (41.7%)였다. 한 병원 당 감염관리전담자 2.2명이 근무하였고 이들은 1인당 평균 345병상을 담당 하고 있었다. 총 169개의 참여중환자실은 종류별 로 내과계 중환자실 68개(40.3%), 내과 중심의 혼 합 중환자실 31개(18.3%), 외과 중심의 혼합 중환 자실 23개(13.6%), 외과계 중환자실 22개(13.0%), 신경외과계 중환자실이 25개(14.8%)이었다. 3개 월과 6개월 동안 감시에 참여한 중환자실이 각각 10개(5.9%), 8개(4.7%)이었고, 12개월 동안 지속 적으로 감시를 수행한 중환자실은 147개(87.0%) 이었다.
2. 의료관련감염 건수와 재원일수 감염률 연구 기간 동안 총 2,524건의 의료관련감염이 보고되었다. 이 중 요로감염이 699건(27.7%), 혈 류감염이 1,090건(43.2%), 폐렴이 735건(29.1%)이 었다. 참여중환자실의 총 재원일수는 883,138일 이었다. 전체 의료관련감염(요로감염, 혈류감염 과 폐렴)의 1,000 재원일수 당 의료관련감염 건수 는 2.86 (95% 신뢰구간[CI], 2.75-2.97)이었다. 요 로감염의 1,000 재원일수 당 의료관련감염 건수 는 0.79 (95% CI, 0.73-0.85), 혈류감염은 1.23 (95% CI, 1.16-1.31), 폐렴은 0.83 (95% CI, 0.77- 0.89)이었다(Table 2).
3. 기구일수 감염률과 기구사용률
요로감염 699건 중 675건(96.6%)이 요로카테터
와 관련이 있었다. 전체 요로카테터 기구일수는
745,767일이었고, 요로카테터 관련 요로감염(uri-
nary catheter-associated UTI)의 1,000 기구일수 당
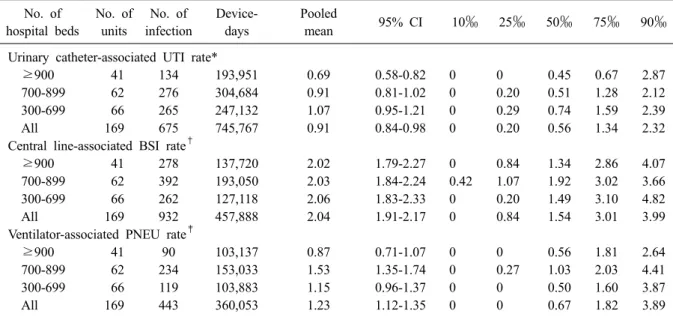
의료관련감염 건수는 0.91 (95% CI, 0.84-0.98)이
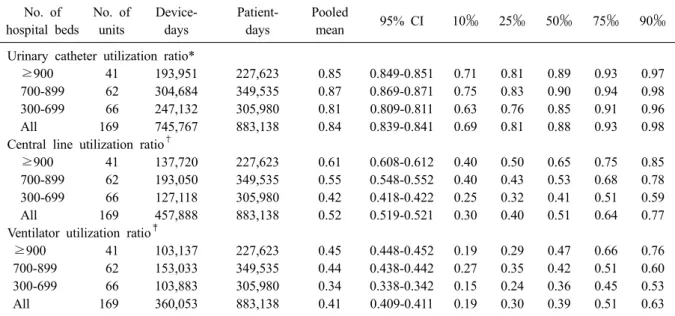
었다(Table 3). 요로카테터의 기구사용률은 0.84
(95% CI, 0.839-0.841)이었다(Table 4). 혈류감염
1,090건 중 932건(85.5%)이 중심정맥관과 관련된
것이었다. 전체 중심정맥관 기구일수는 457,888
일이었고, 중심정맥관 관련 혈류감염(central line-
associated BSI)의 1,000 기구일수 당 의료관련감
염 건수는 2.04 (95% CI, 1.91-2.17)이었다. 중심정
맥관의 기구사용률은 0.52 (95% CI, 0.519-0.521)
Table 3. Pooled means and percentiles of the device-associated infection rates, by number of hospital beds, July 2014 through June 2015
No. of hospital beds
No. of units
No. of infection
Device- days
Pooled
mean 95% CI 10‰ 25‰ 50‰ 75‰ 90‰
Urinary catheter-associated UTI rate*
≥900 41 134 193,951 0.69 0.58-0.82 0 0 0.45 0.67 2.87
700-899 62 276 304,684 0.91 0.81-1.02 0 0.20 0.51 1.28 2.12
300-699 66 265 247,132 1.07 0.95-1.21 0 0.29 0.74 1.59 2.39
All 169 675 745,767 0.91 0.84-0.98 0 0.20 0.56 1.34 2.32
Central line-associated BSI rate
†≥900 41 278 137,720 2.02 1.79-2.27 0 0.84 1.34 2.86 4.07
700-899 62 392 193,050 2.03 1.84-2.24 0.42 1.07 1.92 3.02 3.66
300-699 66 262 127,118 2.06 1.83-2.33 0 0.20 1.49 3.10 4.82
All 169 932 457,888 2.04 1.91-2.17 0 0.84 1.54 3.01 3.99
Ventilator-associated PNEU rate
‡≥900 41 90 103,137 0.87 0.71-1.07 0 0 0.56 1.81 2.64
700-899 62 234 153,033 1.53 1.35-1.74 0 0.27 1.03 2.03 4.41
300-699 66 119 103,883 1.15 0.96-1.37 0 0 0.50 1.60 3.87
All 169 443 360,053 1.23 1.12-1.35 0 0 0.67 1.82 3.89
*(No. of urinary catheter-associated UTIs/No. of urinary catheter-days)×1,000;
†(No. of central line-associated BSIs/No.
of central line-days)×1,000;
‡(No. of ventilator-associated PNEUs/No. of ventilator-days)×1,000.
Abbreviations: UTI, urinary tract infection; BSI, bloodstream infection; PNEU, pneumonia; CI, confidence interval.
Table 2. Pooled means of nosocomial infection rates, by number of hospital beds, July 2014 through June 2015
Nosocomial infection rate No. of hospital beds
≥900 700-899 300-699 All
No. of units 41 62 66 169
Patient-days 227,623 349,535 305,980 883,138
Infection rate*
No. of infections 594 1,090 840 2,524
Pooled mean 2.61 3.12 2.75 2.86
95% CI 2.41-2.83 2.94-3.31 2.57-2.94 2.75-2.97
UTI rate
†No. of UTI 140 283 276 699
Pooled mean 0.62 0.81 0.90 0.79
95% CI 0.52-0.73 0.72-0.91 0.80-1.01 0.73-0.85
BSI rate
‡No. of BSI 310 459 321 1,090
Pooled mean 1.36 1.31 1.05 1.23
95% CI 1.22-1.52 1.20-1.44 0.94-1.17 1.16-1.31
PNEU rate
§No. of PNEU 144 348 243 735
Pooled mean 0.63 1.00 0.79 0.83
95% CI 0.54-0.74 0.90-1.11 0.70-0.90 0.77-0.89
*(No. of UTIs, BSIs, or PNEUs/No. of patient-days)×1,000;
†(No. of UTIs/No. of patient-days)×1,000;
‡(No. of BSIs/
No. of patient-days)×1,000;
§(No. of PNEUs/No. of patient-days)×1,000.
Abbreviations: UTI, urinary tract infection; BSI, bloodstream infection; PNEU, pneumonia; CI, confidence interval.
Table 4. Pooled means and percentiles of the distribution of device- utilization ratios, by number of hospital beds, July 2014 through June 2015
No. of hospital beds
No. of units
Device- days
Patient- days
Pooled
mean 95% CI 10‰ 25‰ 50‰ 75‰ 90‰
Urinary catheter utilization ratio*
≥900 41 193,951 227,623 0.85 0.849-0.851 0.71 0.81 0.89 0.93 0.97
700-899 62 304,684 349,535 0.87 0.869-0.871 0.75 0.83 0.90 0.94 0.98
300-699 66 247,132 305,980 0.81 0.809-0.811 0.63 0.76 0.85 0.91 0.96
All 169 745,767 883,138 0.84 0.839-0.841 0.69 0.81 0.88 0.93 0.98
Central line utilization ratio
†≥900 41 137,720 227,623 0.61 0.608-0.612 0.40 0.50 0.65 0.75 0.85
700-899 62 193,050 349,535 0.55 0.548-0.552 0.40 0.43 0.53 0.68 0.78
300-699 66 127,118 305,980 0.42 0.418-0.422 0.25 0.32 0.41 0.51 0.59
All 169 457,888 883,138 0.52 0.519-0.521 0.30 0.40 0.51 0.64 0.77
Ventilator utilization ratio
‡≥900 41 103,137 227,623 0.45 0.448-0.452 0.19 0.29 0.47 0.66 0.76
700-899 62 153,033 349,535 0.44 0.438-0.442 0.27 0.35 0.42 0.51 0.60
300-699 66 103,883 305,980 0.34 0.338-0.342 0.15 0.24 0.36 0.45 0.53
All 169 360,053 883,138 0.41 0.409-0.411 0.19 0.30 0.39 0.51 0.63
*(No. of urinary catheter-days/No. of patient-days);
†(No. of central line-days/No. of patient-days);
‡(No. of ventilator- days/No. of patient-days).
Abbreviations: UTI, urinary tract infection; BSI, bloodstream infection; PNEU, pneumonia; CI, confidence interval.
이었다. 폐렴 735건 중 443건(60.3%)이 인공호흡 기와 관련된 것이었다. 전체 인공호흡기 기구일 수는 360,053일이었고, 인공호흡기 관련 폐렴의 1,000 기구일수 당 의료관련감염 건수는 1.23 (95%
CI, 1.12-1.35)이었다. 인공호흡기의 기구사용률은 0.41 (95% CI, 0.409-0.411)이었다.
4. 병상규모에 따른 기구일수 감염률과 기구 사용률의 비교
요로카테터의 기구사용률은 병상규모가 300- 699병상인 병원에서 가장 낮았으나(0.81 [95% CI, 0.809-0.811]) (Table 4), 요로카테터관련 요로감염 의 기구일수 감염률은 요로카테터 기구사용률이 낮았던 300-699병상인 병원에서 900병상 이상의 병원의 중환자실에 비해 유의하게 높았다(1.07 [95% CI, 0.95-1.21] vs. 0.69 [95% CI, 0.58-0.82]) (Table 3). 중심정맥관 기구사용률은 300-699병상, 700-899병상, 900병상 이상인 병원으로 갈수록 유의하게 높았으나(0.42 [95% CI, 0.418-0.422], 0.55 [95% CI, 0.548-0.552], 0.61 [95% CI, 0.608- 0.612]) 중심정맥관 관련 혈류감염의 기구일수 감 염률은 병상규모에 따라 유의한 차이는 없었다 (2.06 [95% CI, 1.83-2.33], 2.03 [95% CI, 1.84-
2.24], 2.02 [95% CI, 1.79-2.27]). 인공호흡기 사용 률 역시 병상규모가 커질수록 기구사용률이 유 의하게 높았다(0.34 [95% CI, 0.338-0.342], 0.44 [95% CI, 0.438-0.442], 0.45 [95% CI, 0.448- 0.452]). 그러나, 인공호흡기 관련 폐렴의 기구일 수 감염률은 인공호흡기 사용률이 낮았던 700- 899병상 규모의 병원이 900병상 이상인 병원에 비해 유의하게 높았다(1.53 [95% CI, 1.35-1.74]
vs. 0.87 [95% CI, 0.71-1.07]).
5. 중환자실 유형에 따른 기구일수 감염률과 기구사용률의 비교
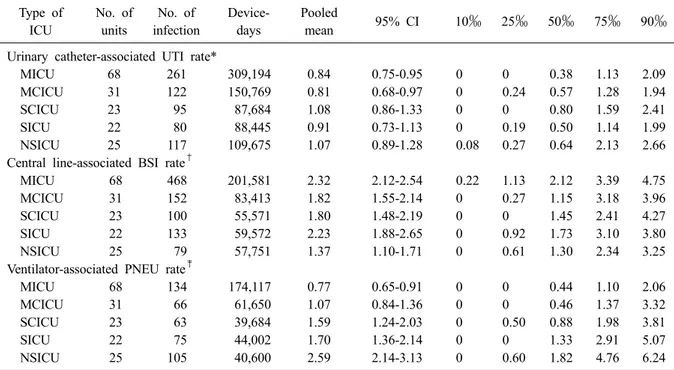
요로카테터 관련 요로감염은 외과계 혼합 중 환자실에서 감염률이 가장 높았고(1.08 [95% CI, 0.86-1.33]), 내과계 혼합 중환자실에서 가장 낮았 다(0.81 [95% CI, 0.68-0.97]). 중심정맥관 관련 혈 류감염은 신경외과계 중환자실에서 가장 낮았다 (1.37 [95% CI, 1.10-1.71]). 인공호흡기 관련 폐렴 은 신경외과계 중환자실에서 다른 중환자실에 비해 감염률이 유의하게 가장 높았고(2.59 [95%
CI, 2.14-3.13]) 내과계 중환자실에서 가장 낮았다
(0.77 [95% CI, 0.65-0.91]) (Table 5). 요로카테터
사용률은 내과계 중환자실에서 가장 낮았으며
Table 5. Pooled means and percentiles of the distribution of device- associated infection rates, by type of ICU, July 2014 through June 2015
Type of ICU
No. of units
No. of infection
Device- days
Pooled
mean 95% CI 10‰ 25‰ 50‰ 75‰ 90‰
Urinary catheter-associated UTI rate*
MICU 68 261 309,194 0.84 0.75-0.95 0 0 0.38 1.13 2.09
MCICU 31 122 150,769 0.81 0.68-0.97 0 0.24 0.57 1.28 1.94
SCICU 23 95 87,684 1.08 0.86-1.33 0 0 0.80 1.59 2.41
SICU 22 80 88,445 0.91 0.73-1.13 0 0.19 0.50 1.14 1.99
NSICU 25 117 109,675 1.07 0.89-1.28 0.08 0.27 0.64 2.13 2.66
Central line-associated BSI rate
†MICU 68 468 201,581 2.32 2.12-2.54 0.22 1.13 2.12 3.39 4.75
MCICU 31 152 83,413 1.82 1.55-2.14 0 0.27 1.15 3.18 3.96
SCICU 23 100 55,571 1.80 1.48-2.19 0 0 1.45 2.41 4.27
SICU 22 133 59,572 2.23 1.88-2.65 0 0.92 1.73 3.10 3.80
NSICU 25 79 57,751 1.37 1.10-1.71 0 0.61 1.30 2.34 3.25
Ventilator-associated PNEU rate
‡MICU 68 134 174,117 0.77 0.65-0.91 0 0 0.44 1.10 2.06
MCICU 31 66 61,650 1.07 0.84-1.36 0 0 0.46 1.37 3.32
SCICU 23 63 39,684 1.59 1.24-2.03 0 0.50 0.88 1.98 3.81
SICU 22 75 44,002 1.70 1.36-2.14 0 0 1.33 2.91 5.07
NSICU 25 105 40,600 2.59 2.14-3.13 0 0.60 1.82 4.76 6.24
*(No. of urinary catheter-associated UTIs/No. of urinary catheter-days)×1,000;
†(No. of central line-associated BSIs/No.
of central line-days)×1,000;
‡(No. of ventilator-associated PNEUs/No. of ventilator-days)×1,000.
Abbreviations: ICU, intensive care unit; MICU, medical ICU; MCICU, medical combined ICU; SCICU, surgical com- bined ICU; SICU, surgical ICU; NSICU, neurosurgical ICU; UTI, urinary tract infection; BSI, bloodstream infection;
PNEU, pneumonia; CI, confidence interval.
(0.82 [95% CI, 0.819-0.821]), 신경외과계 중환자 실에서 가장 높았다(0.89 [95% CI, 0.888-0.892]).
중심정맥관 사용률은 신경외과계 중환자실과 내 과계 혼합 중환자실에서 가장 낮았으며(0.47 [95% CI, 0.467-0.473], 0.47[95% CI, 0.468-0.472]), 외과계 중환자실에서 가장 높았다(0.58 [95% CI, 0.577-0.583]). 인공호흡기 사용률은 신경외과계 중환자실에서 가장 낮았고(0.33 [95% CI, 0.327- 0.333]), 내과계 중환자실에서 가장 높았다(0.46 [95% CI, 0.458-0.462]) (Table 6).
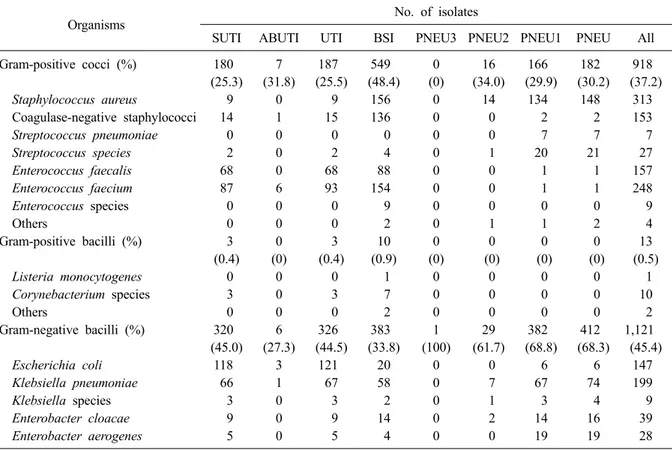
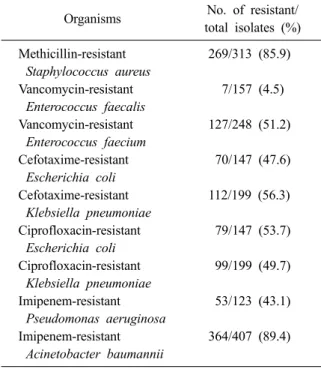
6. 원인미생물과 주요 미생물의 항생제 내성률 총 2,524건의 감염에서 2,470균주가 분리되었 다. 요로감염의 원인미생물은 그람음성막대균이 44.5%로 가장 많았고, 혈류감염에서는 그람양성 알균이 48.4%로 가장 흔하게 분리되었다. 폐렴의 원인미생물은 그람음성막대균이 68.3%로 가장 많았다. 감염병에 따른 원인미생물을 Table 7에 기술하였다. 주요 세균의 주요 항생제에 대한 내
성률은 Table 8에 제시하였다. Fig. 1은 KONIS 연 간자료가 처음 발표된 2007년 7월 이후 8년간 주 요 세균의 항생제 내성률의 추이를 나타낸 것이 다.
7. 2010-2015년도의 기구사용률과 기구일수 감염률 비교
2014년 7월부터 2015년 6월까지의 기구사용률과 기구일수 의료관련감염률을 이전 4년간의 KONIS 자료와 비교하였다(Table 9). 중심정맥관 기구사 용률과 중심정맥관 관련 혈류감염은 전년도에 비해 감소하였다. 요로카테터 기구사용률은 전년 도와 유의한 차이가 없었으나 요로카테터 관련 요로감염은 전년도에 비해 유의하게 감소하였다 (1.21 [95% CI, 1.13-1.29] vs. 0.91 [95% CI, 0.84- 0.98]). 인공호흡기 기구사용률과 인공호흡기 관 련 폐렴은 전년도에 비해 유의한 차이가 없었다.
최근 5년간의 자료를 볼 때 기구관련감염률은 감
소하는 경향을 보이고 있다. Fig. 2는 2007년 7월
Table 6. Pooled means and percentiles of the distribution of device- utilization ratios, by type of ICU, July 2014 through June 2015
Type of ICU
No. of units
Device- days
Patient- days
Pooled
mean 95% CI 10‰ 25‰ 50‰ 75‰ 90‰
Urinary catheter utilization ratio*
MICU 68 309,194 377,167 0.82 0.819-0.821 0.67 0.78 0.83 0.90 0.95
MCICU 31 150,769 176,191 0.86 0.858-0.862 0.73 0.83 0.87 0.92 0.96
SCICU 23 87,684 103,223 0.85 0.848-0.852 0.59 0.77 0.91 0.95 0.99
SICU 22 88,445 102,978 0.86 0.858-0.862 0.81 0.85 0.89 0.94 0.96
NSICU 25 109,675 123,579 0.89 0.888-0.892 0.72 0.86 0.93 0.98 0.99
Central line utilization ratio
†MICU 68 201,581 377,167 0.53 0.528-0.532 0.32 0.40 0.53 0.64 0.79
MCICU 31 83,413 176,191 0.47 0.468-0.472 0.26 0.34 0.45 0.53 0.77
SCICU 23 55,571 103,223 0.54 0.537-0.543 0.31 0.43 0.53 0.66 0.75
SICU 22 59,572 102,978 0.58 0.577-0.583 0.28 0.45 0.63 0.73 0.83
NSICU 25 57,751 123,579 0.47 0.467-0.473 0.35 0.41 0.45 0.52 0.66
Ventilator utilization ratio
‡MICU 68 174,117 377,167 0.46 0.458-0.462 0.28 0.37 0.45 0.58 0.69
MCICU 31 61,650 176,191 0.35 0.348-0.352 0.10 0.20 0.41 0.47 0.55
SCICU 23 39,684 103,223 0.38 0.377-0.383 0.21 0.28 0.37 0.42 0.55
SICU 22 44,002 102,978 0.43 0.427-0.433 0.16 0.28 0.38 0.48 0.67
NSICU 25 40,600 123,579 0.33 0.327-0.333 0.14 0.21 0.31 0.44 0.60
*(No. of urinary catheter-days/No. of patient-days);
†(No. of central line-days/No. of patient-days);
‡(No. of ventilator- days/No. of patient-days).
Abbreviations: ICU, intensive care unit; MICU, medical ICU; MCICU, medical combined ICU; SCICU, surgical com- bined ICU; SICU, surgical ICU; NSICU, neurosurgical ICU; UTI, urinary tract infection; BSI, bloodstream infection;
PNEU, pneumonia; CI, confidence interval.
Table 7. Number (%) of microorganisms isolated from clinical specimens of patients with nosocomial infections
Organisms No. of isolates
SUTI ABUTI UTI BSI PNEU3 PNEU2 PNEU1 PNEU All
Gram-positive cocci (%) 180 (25.3)
7 (31.8)
187 (25.5)
549 (48.4)
0 (0)
16 (34.0)
166 (29.9)
182 (30.2)
918 (37.2)
Staphylococcus aureus 9 0 9 156 0 14 134 148 313
Coagulase-negative staphylococci 14 1 15 136 0 0 2 2 153
Streptococcus pneumoniae 0 0 0 0 0 0 7 7 7
Streptococcus species 2 0 2 4 0 1 20 21 27
Enterococcus faecalis 68 0 68 88 0 0 1 1 157
Enterococcus faecium 87 6 93 154 0 0 1 1 248
Enterococcus species 0 0 0 9 0 0 0 0 9
Others 0 0 0 2 0 1 1 2 4
Gram-positive bacilli (%) 3 (0.4)
0 (0)
3 (0.4)
10 (0.9)
0 (0)
0 (0)
0 (0)
0 (0)
13 (0.5)
Listeria monocytogenes 0 0 0 1 0 0 0 0 1
Corynebacterium species 3 0 3 7 0 0 0 0 10
Others 0 0 0 2 0 0 0 0 2
Gram-negative bacilli (%) 320 (45.0)
6 (27.3)
326 (44.5)
383 (33.8)
1 (100)
29 (61.7)
382 (68.8)
412 (68.3)
1,121 (45.4)
Escherichia coli 118 3 121 20 0 0 6 6 147
Klebsiella pneumoniae 66 1 67 58 0 7 67 74 199
Klebsiella species 3 0 3 2 0 1 3 4 9
Enterobacter cloacae 9 0 9 14 0 2 14 16 39
Enterobacter aerogenes 5 0 5 4 0 0 19 19 28
Table 7. Continued
Organisms No. of isolates
SUTI ABUTI UTI BSI PNEU3 PNEU2 PNEU1 PNEU All
Enterobacter species 0 0 0 0 0 0 1 1 1
Serratia marcescens 9 0 9 15 0 0 5 5 29
Serratia species 0 0 0 0 0 0 1 1 1
Proteus mirabilis 16 0 16 4 0 0 1 1 21
Proteus species 3 1 4 0 0 0 0 0 4
Citrobacter freundii 1 0 1 0 0 0 2 2 3
Citrobacter species 3 0 3 1 0 0 1 1 5
Morganella morganii 2 0 2 1 0 0 0 0 3
Pseudomonas aeruginosa 55 1 56 23 0 0 44 44 123
Pseudomonas species 0 0 0 0 0 0 1 1 1
Acinetobacter baumannii 25 0 25 163 1 19 199 219 407
Acinetobacter species 1 0 1 9 0 0 2 2 12
Burkholderia cepacia 2 0 2 16 0 0 2 2 20
Burkholderia species 0 0 0 2 0 0 0 0 2
Stenotrophomonas maltophilia 1 0 1 32 0 0 13 13 46
Sphingomonas species 0 0 0 3 0 0 0 0 3
Chryseobacterium species 0 0 0 11 0 0 0 0 11
Others 1 0 1 5 0 0 1 1 7
Anaerobes (%) 0
(0) 0 (0)
0 (0)
11 (1.0)
0 (0)
0 (0)
0 (0)
0 (0)
11 (0.4)
Actinomyces species 0 0 0 2 0 0 0 0 2
Peptostreptococcus species 0 0 0 2 0 0 0 0 2
Prevotella species 0 0 0 2 0 0 0 0 2
Clostiridium species 0 0 0 3 0 0 0 0 3
Others 0 0 0 2 0 0 0 0 2
Fungi (%) 208
(29.3) 9 (40.9)
217 (29.6)
181 (15.9)
0 (0)
2 (4.3)
7 (1.3)
9 (1.5)
407 (16.5)
Candida albicans 93 4 97 61 0 2 3 5 163
Candida tropicalis 48 4 52 32 0 0 0 0 84
Candida glabrata 23 1 24 35 0 0 0 0 59
Candida parapsilosis 9 0 9 38 0 0 0 0 47
Candida species 26 0 26 10 0 0 1 1 37
Trichosporon asahii 4 0 4 3 0 0 0 0 7
Yeast 5 0 5 2 0 0 2 2 9
Aspergillus species 0 0 0 0 0 0 1 1 1
Total 711 22 733 1,134 1 47 555 603 2,470
Abbreviations: SUTI, symptomatic urinary tract infection; ABUTI, asymptomatic bacteremic urinary tract infection; UTI, urinary tract infection; BSI, bloodstream infection; PNEU, pneumonia.
첫 연간자료 발표 이후 8년간 중심정맥관 관련 혈류감염과 인공호흡기 관련 폐렴의 기구일수 감염률을 나타낸 것이다.
Discussion
KONIS 중환자실 부문은 2006년 7월부터 의료 관련감염 감시를 시작하여 2007년 7월부터 연간 자료를 발표하기 시작하였으며, 이번 결과보고는
여덟 번째 연간자료이다. KONIS에서는 각 병원
의 사정에 따라 참여 여부를 분기별로 선택하도
록 하고 있는데 2014년 3분기에는 94개 병원 165
개 중환자실, 4분기에는 91개 병원 159개 중환자
실, 2015년 1분기에는 88개 병원 153개 중환자실,
2분기에는 87개 병원 149개 중환자실이 참여하
였고 참여 병원과 중환자실은 분기별로 고르게
분포하였다. 특히 총 169개 중환자실 중에서
87.0%에 해당하는 147개 중환자실은 12개월 동
Fig. 1. Antimicrobial resistance rates of major pathogens isolated from patients with nosocomial infections during 8-year pe- riod (MRSA, methicillin-resistant Staphylococcus aureus; VREFA, vancomycin-resistant Enterococcus faecalis; VREFM, van- comycin-resistant Enterococcus faecium; CTX-R EC, cefotaxime-resistant Escherichia coli; CTX-R KP, cefotaxime-resistant Klebsiella pneumoniae; CIP-R EC, ciprofloxacin-resistant Escherichia coli; CIP-R KP, ciprofloxacin-resistant Klebsiella pneumoniae; IRAP, imiepenem-resistant Pseudomonas aeruginosa; IRAB, imipenem-resistant Acinetobacter baumannii).
Table 8. Susceptibilities of major pathogens isolated from patients with nosocomial infections
Organisms No. of resistant/
total isolates (%) Methicillin-resistant
Staphylococcus aureus
269/313 (85.9) Vancomycin-resistant
Enterococcus faecalis
7/157 (4.5) Vancomycin-resistant
Enterococcus faecium
127/248 (51.2) Cefotaxime-resistant
Escherichia coli
70/147 (47.6) Cefotaxime-resistant
Klebsiella pneumoniae
112/199 (56.3) Ciprofloxacin-resistant
Escherichia coli
79/147 (53.7) Ciprofloxacin-resistant
Klebsiella pneumoniae
99/199 (49.7) Imipenem-resistant
Pseudomonas aeruginosa
53/123 (43.1) Imipenem-resistant
Acinetobacter baumannii
364/407 (89.4) 안 지속적으로 참여하여 감시를 수행하였다.
참여병원의 특성을 병실 규모로 구분하여 보 았을 때 900병상 이상의 병원이 20개(20.8%), 700- 899병상 병원이 33개(34.%), 300-699병상 규모의 병원이 43개(43.6%)로 전년도와 유사한 분포를
보였고 KONIS 참여병원과 참여 중환자실은 KONIS 시작 이후 지속적으로 증가하고 있다.
KONIS 참여병원 수가 증가하고 특히 중소규모 의 병원에서 KONIS 참여가 확대되는 것은 감염 관리의 중요성과 의료관련감염 감시의 필요성에 대한 인식이 확대되고 KONIS가 전국적인 의료 관련감염 감시체계로 자리잡고 있는 것으로 볼 수 있다. 참여병원이 지속적으로 확대되고 있으 므로 감시 자료의 질을 일정 수준 이상 유지할 수 있도록 기존 참여 병원에 대해서는 인력 변동 등에 따른 자료의 질 변화가 없는지 확인하고 새 로 참여하는 병원에서도 정확도 높은 감염 발생 자료를 보고할 수 있도록 시스템을 강화하는 것 이 중요하겠다.
1년 동안 보고된 의료관련감염은 총 2,524건이
었으며 혈류감염(1,090건), 요로감염(699건), 폐렴
(735건)의 순으로 혈류감염이 가장 많았다. 이는
요로감염의 진단기준이 변경되어 2011년 4분기
부터 무증상 세균뇨가 제외된 이후 유사한 양상
이었다. 300-699병상인 병원에서 요로카테터 기
구사용률은 가장 낮았으나 요로카테터 관련 요
로감염의 기구일수 감염률은 900병상 이상 병원
에 비해 유의하게 높았다. 이는 최근 5년간 자료
에서 유사하게 나타나는 경향이다.
Fig. 2. Catheter-related bloodstream infection (CABSI) and ventilator-associated pneumonia (VAP) rate during 8-year period since 1
stKONIS annual report (error bars represent 95% confidence interval).
Table 9. Comparison of the device utilization ratios and the rates of device-associated infections from 2010 through 2015
Parameter July 2010-
June 2011
July 2011- June 2012
July 2012- June 2013
July 2013- June 2014
July 2014- June 2015
No. of hospitals 72 81 91 94 96
No. of units 130 143 161 166 169
Patient-days 585,325 698,595 867,683 832,428 883,138
Device-days
Urinary catheter-days 503,365 590,793 679,076 701,932 745,767
Central line-days 309,500 362,576 426,783 437,456 457,888
Ventilator-days 233,640 282,472 321,601 340,075 360,053
No. of infections
Urinary catheter-associated UTI 1,949 1,366 854 846 675
Central line-associated BSI 932 1,091 1,096 1,021 932
Ventilator-associated PNEU 410 481 526 498 443
Device utilization ratio (95% CI) [range*]
Urinary catheter 0.86
(0.859-0.861) [0.73-0.97]
0.85 (0.849-0.851)
[0.71-0.97]
0.78 (0.779-0.781)
[0.70-0.98]
0.84 (0.839-0.841)
[0.71-0.97]
0.84 (0.839-0.841)
[0.69-0.98]
Central line 0.53
(0.529-0.531) [0.31-0.81]
0.52 (0.519-0.521)
[0.30-0.79]
0.49 (0.489-0.491)
[0.29-0.80]
0.53 (0.529-0.531)
[0.29-0.79]
0.52 (0.519-0.521)
[0.30-0.77]
Ventilator 0.40
(0.399-0.401) [0.19-0.61]
0.40 (0.399-0.401)
[0.20-0.65]
0.37 (0.369-0.371)
[0.17-0.66]
0.41 (0.409-0.411)
[0.21-0.62]
0.41 (0.409-0.411)
[0.19-0.63]
Rate per 1,000 device-days (95% CI) [range*]
Urinary catheter-associated UTI 3.87 (3.70-4.05)
[0-8.80]
2.26 (2.14-2.39)
[0-5.61]
1.26 (1.18-1.34)
[0-4.08]
1.21 (1.13-1.29)
[0-2.71]
0.91 (0.84-0.98)
[0-2.32]
Central line-associated BSI 3.01 (2.82-3.21)
[0-6.92]
3.01 (2.84-3.19)
[0-6.64]
2.57 (2.42-2.72)
[0-7.35]
2.33 (2.20-2.48)
[0-5.08]
2.04 (1.91-2.17)
[0-3.99]
Ventilator-associated PNEU 1.75 (1.59-1.93)
[0-5.88]
1.70 (1.56-1.86)
[0-5.96]
1.64 (1.50-1.78)
[0-6.67]
1.46 (1.34-1.60)
[0-3.93]
1.23 (1.12-1.35)
[0-3.89]
*10th to 90th percentile range.
Abbreviations: ICU, intensive care unit; UTI, urinary tract infection; BSI, bloodstream infection; PNEU, pneumonia; CI, confidence interval.
카테터관련 요로감염과 중심정맥관 관련 혈류 감염은 전년도에 비해 감소하였으며 인공호흡기 관련 폐렴은 전년도와 유의한 차이는 없었다.
2006년부터 2012년까지 KONIS 기구일수 감염률
을 분석한 연구에 따르면 6년간 KONIS 인공호흡
기 관련 폐렴은 1,000 기구일수 당 3.48건에서
1.64건으로 유의하게 감소하였다(P<0.01) [9]. 또
한, 통계적으로 유의하지는 않았지만 중심정맥관
관련 혈류감염은 1,000 중심정맥관 기구일수당
3.4건에서 2.57 (P=0.12)건으로, 무증상 세균뇨를
제외한 요로카테터 관련 요로감염의 감염률은
1,000 기구일수당 1.85건에서 1.26건으로 감소하
는 경향을 보였다(P=0.07) [9]. 본 연구를 통해
2006년부터 2012년 사이의 기구일수 감염률 감 소 추세는 이후 2014-2015년까지 지속되는 경향 임을 알 수 있었다.
전국적인 의료관련감염 감시체계를 운영하는 것은 그 나라의 의료관련 감염률을 감소시키는 효과가 있다고 알려져 있다[10-12]. 따라서, KONIS 기구일수 감염률의 감소는 KONIS가 운영되어 오면서 감염관리에 대한 지속적인 관심과 노력 을 기울인 것이 영향을 미쳤을 가능성이 높다.
그러나, 한편으로 KONIS가 자발적인 감시체계인 점을 고려할 때 감시체계가 지속됨에 따라 감시 의 민감도가 떨어졌거나 참여 병원의 확대와 관 련된 감시의 정확도 변화가 있는 것은 아닌지에 대한 평가도 필요하다. KONIS에서는 2년마다 자 료 정확도 조사를 시행해 오고 있으며 2014년도 에 시행한 KONIS 자료 정확도 조사에서 요로감 염, 혈류감염, 폐렴에 대한 감시 민감도는 각각 85.3%, 74.0%, 66.7%이었다[13]. 2010년도의 KONIS 정확도 조사 결과와 비교할 때 요로감염의 민감 도는 유사하였으나(88.4% vs. 85.3%) 혈류감염의 민감도는 감소한 것으로 나타났다(90.2% vs. 74.0%).
2012년에는 폐렴에 대해서만 정확도 조사가 시 행되었는데 폐렴의 민감도는 2010년 55.6%, 2012 년 91.7%, 2014년 66.7%로 조사시기에 따라 차이 가 커서 이에 대해서는 지속적인 평가와 함께 감 시자료의 질 유지를 위한 방안 마련이 필요할 것 으로 사료된다[7].
본 연구에서는 주요 미생물의 항생제 내성률 변화에 대해 통계분석을 시행하지는 않았으나 2006년 7월부터 2014년 6월까지 8년간 KONIS 의 료관련감염의 원인미생물과 항생제 내성률 자료 를 poisson regression 모델을 이용하여 경향 분석 한 연구 결과에 따르면 S. aureus의 methicillin 내 성률은 95.0%에서 90.2%로 유의하게 감소하였고 (P<0.0001) A. baumannii의 imipenem 내성률은 52.9%에서 89.8%로 유의하게 증가하였다(P
<0.0001) [14]. 반면에 E. faecium의 vancomycin 내성률, E. coli, K. pneumoniae의 ciprofloxacin, ce- fotaxime 내성률, P. aeruginosa의 imipenem 내성 률 등은 연도에 따른 유의한 변화는 없었다[14].
이번 보고에서도 전년도 자료와 비교할 때
A.baumannii의 imipenem 내성률을 비롯하여 주요
