D I A B E T E S & M E T A B O L I S M J O U R N A L
This is an Open Access article distributed under the terms of the Creative Commons Attribution Non-Commercial License (http://creativecommons.org/licenses/by-nc/4.0/) which permits unrestricted non-commercial use, distribution, and reproduction in any medium, provided the original work is properly cited.
Predictors of Incident Type 2 Diabetes Mellitus in
Japanese Americans with Normal Fasting Glucose Level
You-Cheol Hwang1, Wilfred Y. Fujimoto2, Steven E. Kahn2,3, Donna L. Leonetti4, Edward J. Boyko5
1 Division of Endocrinology and Metabolism, Department of Medicine, Kyung Hee University Hospital at Gangdong, Kyung Hee University School of Medicine, Seoul, Korea,
2Division of Metabolism, Endocrinology and Nutrition, Department of Medicine, University of Washington School of Medicine, Seattle, WA,
3Hospital and Specialty Medicine Service, VA Puget Sound Health Care System, Seattle, WA,
4Department of Anthropology, University of Washington, Seattle, WA,
5Seattle Epidemiologic Research and Information Center, VA Puget Sound Health Care System, Seattle, WA, USA
Background: Little is known about the natural course of normal fasting glucose (NFG) in Asians and the risk factors for future diabetes.
Methods: A total of 370 Japanese Americans (163 men, 207 women) with NFG levels and no history of diabetes, aged 34 to 75 years, were enrolled. Oral glucose tolerance tests were performed at baseline, 2.5, 5, and 10 years after enrollment.
Results: During 10 years of follow-up, 16.1% of participants met criteria for diabetes diagnosis, and 39.6% of subjects still had NFG levels at the time of diabetes diagnosis. During 5 years of follow-up, age (odds ratio [OR], 1.05; 95% confidence interval [CI], 1.01 to 1.10; P=0.026) and family history of diabetes (OR, 3.24; 95% CI, 1.42 to 7.40; P=0.005) were independently associated with future diabetes diagnosis; however, fasting glucose level was not an independent predictor. During 10 years of follow-up, family history of diabetes (OR, 2.76; 95% CI, 1.37 to 5.54; P=0.004), fasting insulin level (OR, 1.01; 95% CI, 1.00 to 1.02;
P=0.037), and fasting glucose level (OR, 3.69; 95% CI, 1.13 to 12.01; P=0.030) were associated with diabetes diagnosis indepen- dent of conventional risk factors for diabetes.
Conclusion: A substantial number of subjects with NFG at baseline still remained in the NFG range at the time of diabetes diag- nosis. A family history of diabetes and fasting insulin and glucose levels were associated with diabetes diagnosis during 10 years of follow-up; however, fasting glucose level was not associated with diabetes risk within the relatively short-term follow-up period of 5 years in subjects with NFG.
Keywords: Asian Americans; Blood glucose; Diabetes mellitus, type 2; Epidemiology; Fasting; Glucose tolerance test
Corresponding author: You-Cheol Hwang https://orcid.org/0000-0003-4033-7874 Division of Endocrinology and Metabolism, Department of Medicine, Kyung Hee University Hospital at Gangdong, Kyung Hee University School of Medicine, 892 Dongnam-ro, Gangdong-gu, Seoul 05278, Korea
E-mail: [email protected]
INTRODUCTION
The upper limit value for normal fasting glucose (NFG) has been redefined twice over the past 20 years by the American Diabetes Association. In 1997, it was set at 6.1 mmol/L, with values above but below the diabetes threshold defined as im- paired fasting glucose (IFG). In 2003, the upper limit value for NFG was lowered from 6.1 to 5.6 mmol/L [1]. Following this revision, people with fasting plasma glucose (FPG) levels of 5.6
to 6.0 mmol/L have been additionally included as having IFG;
thereby, identifying more individuals who may be at increased risk of diabetes [2].
It has been suggested; however, that higher FPG levels with- in the normoglycemic range are independently associated with an increased risk for type 2 diabetes mellitus (T2DM), and the annual incidence of diabetes has been reported to be approxi- mately 0.3% to 0.6% [3-5]. For example, in a study performed with 13,163 young Israeli men with NFG, the risk for T2DM https://doi.org/10.4093/dmj.2017.0100
pISSN 2233-6079 · eISSN 2233-6087
increased progressively within the normoglycemic range dur- ing a mean follow-up period of 5.7 years. In addition, although the absolute risk of diabetes is very low, measurement of either the body mass index (BMI) or triglyceride levels along with FPG levels helped to identify apparently healthy men with NFG who were at increased risk for T2DM [3].
However, it has been suggested that fasting and postchal- lenge hyperglycemia may be phenotypes with distinct natural histories in the development of T2DM [6]. In addition, im- paired glucose tolerance (IGT) is a more common form of pre- diabetes than isolated IFG in Asians compared to Europeans [7,8]; thus, not measuring the 2-hour postload glucose (2PG) during an oral glucose tolerance test (OGTT) will therefore underestimate the prevalence of diabetes in Asians [9,10].
Therefore, the aims of this study were to determine (1) how many individuals with NFG already have abnormal glucose tolerance by OGTT, (2) how frequently individuals who have NFG develop T2DM, and (3) which demographic, lifestyle, clinical, and metabolic variables predict future diabetes diag- nosis in Japanese Americans with NFG at baseline.
METHODS
Study subjects
The study received approval from the University of Washing- ton Human Subjects Division and written informed consent was obtained from all subjects. The study population consisted of Japanese American men and women enrolled in the Japa- nese American Community Diabetes Study, a cohort of sec- ond- (Nisei) and third-generation (Sansei) Japanese Ameri- cans of 100% Japanese ancestry. A detailed description of the selection and recruitment of the study subjects has been pub- lished previously [11]. In brief, study participants were selected as volunteers from a community-wide comprehensive mailing list and telephone directory that included nearly 95% of the Japanese American population in King County, Washington.
Among the total of 658 subjects in the original cohort, 126 subjects were excluded for having a history of diabetes at base- line, and then 162 subjects with FPG ≥5.6 mmol/L were fur- ther excluded. Finally, a total of 370 subjects (163 men, 207 women) with NFG levels, aged 34 to 75 years, were enrolled in this study. Among these 370 subjects, seven had 2PG levels
≥11.1 mmol/L during the baseline OGTT; however, since we were interested in the subsequent OGTT category of all indi- viduals who would have been diagnosed as normal based sole-
ly upon a FPG measurement, they were included in the analy- sis of the occurrence of a future diabetes diagnosis. Subjects were followed up at 2.5 years (Nisei men only), 5 to 6 years, and 10 to 11 years after the baseline examination.
Clinical and laboratory examination
All evaluations were performed at the General Clinical Re- search Center, University of Washington. At baseline, a com- plete physical examination was performed, and personal medi- cal history and lifestyle factors including cigarette smoking, al- cohol consumption, and physical activity were determined through a standardized questionnaire. Two categories were used for the classification of smoking status (current smoker and past smoker or never smoker). A previous meta-analysis of prospective observational studies suggested that moderate alcohol consumption (6 to 48 g/day) reduces the risk of T2DM, so we used this criterion to define moderate alcohol consump- tion [12]. The Paffenbarger physical activity index question- naire was used to determine the physical activity level (usual kilocalories expended weekly) [13], and regular physical activ- ity was defined as that performed at a more than moderate in- tensity.
BMI was calculated as the weight in kilograms divided by the square of the height in meters. Waist circumference was measured at the level of the umbilicus. Blood pressure was measured with a mercury sphygmomanometer to the nearest 2 mm Hg with the subject in a recumbent position. Systolic blood pressure was determined by the first perception of sound, and diastolic blood pressure was determined at the dis- appearance of sounds (fifth-phase Korotkoff). Average blood pressure was calculated from the second and third of three consecutive measurements.
Biochemical measurements were performed on fresh sam- ples at the time of sample collection as reported previously [14]. All blood samples were obtained following an overnight fast of 10 hours. Plasma glucose was measured by the hexoki- nase method on an autoanalyzer (Department of Laboratory Medicine, University of Washington, Seattle, WA, USA). Plas- ma insulin was measured by a radioimmunoassay (Immuno- assay Core, Diabetes Research Center, University of Washing- ton, Seattle, WA, USA). The homeostasis model assessment of insulin resistance (HOMA-IR) was calculated as the product of the fasting insulin (μIU/mL) and FPG (mmol/L) concentra- tions, divided by 22.5. The homeostasis model assessment of β-cell function (HOMA-B%) was calculated as (20×fasting in-
sulin)/(FPG−3.5) and was used to represent β-cell function.
The insulinogenic index, a marker of early-phase insulin secre- tion, was calculated as the ratio of the increment in insulin to the increment in glucose above fasting during the first 30 min- utes of the OGTT [15]. Lipid and lipoprotein measurements were performed according to modified procedures of the Lipid Research Clinics (Northwest Lipid Research Laboratory, Seat- tle, WA, USA).
A 75-g OGTT was performed at baseline, 2.5 years (Nisei men only), 5 to 6 years, and 10 to 11 years after enrollment for the determination of diabetes status. In this study, T2DM was defined by the presence of one of the following: (1) fasting glu- cose level ≥7.0 mmol/L; (2) treatment involving oral hypogly- cemic agents or insulin therapy; or (3) 2PG ≥11.1 mmol/L [16]. Hypertension was defined as a systolic blood pressure
≥140 mm Hg, a diastolic blood pressure ≥90 mm Hg, or tak- ing antihypertensive medications. The presence of cardiovas- cular disease was diagnosed by a clinical history of one of the following: (1) coronary artery disease (acute myocardial in- farction, angina, coronary artery bypass graft, or coronary an- gioplasty); (2) cerebrovascular disease (transient ischemic at- tack, carotid endarterectomy, atherosclerotic stroke, or non- atherosclerotic stroke); (3) peripheral artery occlusive disease (claudication or bypass surgery in lower extremities); or (4) abdominal, thoracic, or other type of aortic aneurysm.
Statistical analyses
Data are expressed as mean±standard deviation for continu- ous measures or as proportions for categorical variables, except for skewed continuous variables, which are presented as the median (interquartile range). A variance inflation factor >3.0 was used as an indicator of multicollinearity. Multiple logistic regression analysis was used to identify independent associa- tions of clinical and biochemical variables with future diabetes risk. Odds ratios (ORs) with 95% confidence intervals (CIs) were calculated for the independent variables included in the logistic models, with a 1-SD increment used for OR calcula- tions for continuous measurements. The presence of interac- tion was assessed in multivariate models through evaluation of the significance of first-order interaction terms. The presence of nonlinearity was assessed via insertion of the quadratic transformation of FPG into models that contained the linear term. All statistical analyses were performed with PASW ver- sion 18.0 (SPSS, Chicago, IL, USA). A P<0.05 was considered significant.
RESULTS
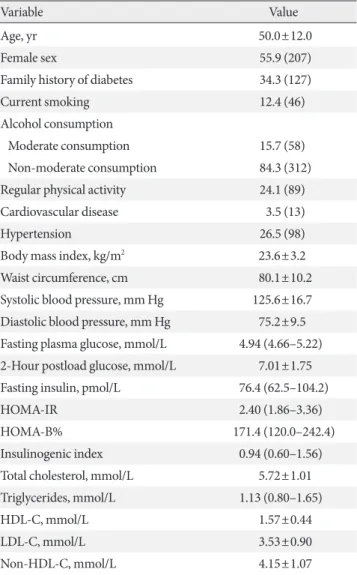
Tables 1 and 2 depict the baseline characteristics of the study subjects. The mean age was 50.0 years and 55.9% of the sub- jects were women. Approximately one-third of the study sub- jects had a family history of diabetes. In terms of personal his- tory, 15.7% and 12.4% of the subjects were moderate alcohol drinkers and current smokers, respectively, and 24.1% of the subjects performed regular physical activity at a more than
Table 1. Baseline characteristics
Variable Value
Age, yr 50.0±12.0
Female sex 55.9 (207)
Family history of diabetes 34.3 (127)
Current smoking 12.4 (46)
Alcohol consumption
Moderate consumption 15.7 (58)
Non-moderate consumption 84.3 (312)
Regular physical activity 24.1 (89)
Cardiovascular disease 3.5 (13)
Hypertension 26.5 (98)
Body mass index, kg/m2 23.6±3.2
Waist circumference, cm 80.1±10.2
Systolic blood pressure, mm Hg 125.6±16.7 Diastolic blood pressure, mm Hg 75.2±9.5 Fasting plasma glucose, mmol/L 4.94 (4.66–5.22) 2-Hour postload glucose, mmol/L 7.01±1.75 Fasting insulin, pmol/L 76.4 (62.5–104.2)
HOMA-IR 2.40 (1.86–3.36)
HOMA-B% 171.4 (120.0–242.4)
Insulinogenic index 0.94 (0.60–1.56)
Total cholesterol, mmol/L 5.72±1.01
Triglycerides, mmol/L 1.13 (0.80–1.65)
HDL-C, mmol/L 1.57±0.44
LDL-C, mmol/L 3.53±0.90
Non-HDL-C, mmol/L 4.15±1.07
Values are presented as mean±standard deviation, percentage (num- ber), or median (interquartile range). Moderate alcohol consumption was defined as consuming 6 to 48 g of alcohol daily.
HOMA-IR, homeostasis model assessment of insulin resistance;
HOMA-B%, homeostasis model assessment of β-cell function; HDL- C, high density lipoprotein cholesterol; LDL-C, low density lipopro- tein cholesterol.
moderate intensity. At baseline, the mean FPG and 2PG levels were 4.9 and 7.0 mmol/L, respectively.
Over 5 years of follow-up, the status of T2DM could be as- sessed in 334 subjects, among whom a total of 33 met criteria for diabetes, leading to a cumulative rate of 9.9%. Over 10 years of follow-up, the cumulative rate of diabetes was 16.1% (50/
310). Of the subjects diagnosed with diabetes over 5 years, two subjects were excluded from the classification of diabetes sub- types because they were already taking glucose-lowering med- ication at the time of the OGTT. Of the remaining 31 subjects with diabetes diagnosed during 5 years of follow-up, 17 sub- jects (54.8%) still had NFG levels with an elevated 2PG (≥11.1
mmol/L) at the time of diabetes diagnosis, while 10 subjects (32.3%) had IFG levels, and only four subjects (12.9%) were diagnosed with diabetes based on having FPG levels ≥7.0 mmol/L. Similarly, of the 48 subjects with diabetes diagnosed during 10 years of follow-up, 19 subjects (39.6%) had NFG at the time of diabetes diagnosis, 23 subjects (47.9%) had IFG levels, and only six subjects (12.5%) had FPG levels ≥7.0 mmol/L during 10 years of follow-up (Table 3).
To determine which variables were independently associated with diabetes diagnosis, multiple logistic regression models were used by considering all the variables shown in the univar- iate models with the following exceptions. Total cholesterol, Table 2. Baseline characteristics according to the development of diabetes
Characteristic
5 Years of follow-up 10 Years of follow-up
Diabetes (–)
(n=301) Diabetes (+)
(n=33) P value Diabetes (–)
(n=260) Diabetes (+)
(n=50) P value
Age, yr 49.1±11.6 57.2±10.9 <0.001 49.0±11.5 54.9±12.0 0.001
Female sex 53.8 (162) 63.6 (21) 0.282 55.0 (143) 60.0 (30) 0.514
Family history of diabetes 30.2 (91) 63.6 (21) <0.001 29.2 (76) 58.0 (29) <0.001
Current smoking 13.3 (40) 15.2 (5) 0.766 11.9 (31) 16.0 (8) 0.426
Moderate alcohol consumption 17.3 (33) 3.0 (1) 0.041 16.2 (42) 4.0 (2) 0.025
Regular physical activity 24.9 (75) 9.1 (3) 0.050 23.8 (62) 8.0 (9) 0.370
Cardiovascular disease 2.3 (7) 15.2 (5) <0.001 2.7 (7) 10.0 (5) 0.014
Hypertension 24.6 (74) 48.5 (16) 0.003 23.8 (62) 44.0 (22) 0.003
Body mass index, kg/m2 23.6±3.1 24.5±3.6 0.104 23.5±3.1 24.5±3.4 0.057
Waist circumference, cm 80.0±10.3 82.8±10.7 0.150 79.6±10.3 82.9±10.2 0.042
Systolic blood pressure, mm Hg 124.5±15.5 136.9±20.3 <0.001 124.5±15.4 134.6±19.2 <0.001
Diastolic blood pressure, mm Hg 75.0±9.3 79.0±9.3 0.019 74.9±9.3 79.3±9.0 0.002
Fasting plasma glucose, mmol/L 4.94 (4.66–5.22) 5.11 (4.83–5.33) 0.032 4.94 (4.66–5.22) 5.16 (4.86–5.33) 0.001 2-Hour postload glucose, mmol/L 6.73±1.57 9.65±1.45 <0.001 7.00±1.58 9.02±1.57 <0.001 Fasting insulin, pmol/L 76.4 (62.5–104.2) 97.2 (62.5–145.8) 0.056 76.4 (60.8–97.2) 97.2 (62.5–145.8) 0.008 HOMA-IR 2.41 (1.86–3.35) 2.90 (2.11–4.72) 0.022 2.40 (1.83–3.22) 3.32 (2.11–4.95) 0.001 HOMA-B% 170.3 (124.1–240.0) 187.8 (107.6–280.2) 0.512 166.6 (124.5–240.0) 188.6 (110.8–269.6) 0.321 Insulinogenic index 0.96 (0.61–1.58) 0.62 (0.44–1.26) 0.013 0.96 (0.61–1.54) 0.65 (0.47–1.59) 0.078
Total cholesterol, mmol/L 5.66±1.00 6.10±1.11 0.019 5.67±0.97 6.08±1.04 0.008
Triglycerides, mmol/L 1.13 (0.80–1.65) 1.46 (1.01–2.23) 0.007 1.10 (0.79–1.63) 1.45 (1.05–1.99) 0.001
HDL-C, mmol/L 1.57±0.44 1.46±0.39 0.208 1.58±0.45 1.45±0.36 0.053
LDL-C, mmol/L 3.50±0.91 3.68±0.94 0.296 3.49±0.88 3.78±0.92 0.041
Non-HDL-C, mmol/L 4.10±1.05 4.63±1.18 0.006 4.09±1.03 4.63±1.12 0.001
Values are presented as mean±standard deviation, percentage (number), or median (interquartile range). Moderate alcohol consumption was defined as consuming 6 to 48 g of alcohol daily.
HOMA-IR, homeostasis model assessment of insulin resistance; HOMA-B%, homeostasis model assessment of β-cell function; HDL-C, high density lipoprotein cholesterol; LDL-C, low density lipoprotein cholesterol.
Table 3. Number of diagnosed cases of diabetes by fasting plasma glucose and 2-hour postload glucose concentrations at 5 and 10 years follow-up assessments
Fasting plasma glucose, mmol/L 2-Hour postload glucose, mmol/L During 5 years (n=31) During 10 years (n=48)
<5.6 ≥11.1 17 (54.8) 19 (39.6)
5.6–6.9 ≥11.1 10 (32.3) 23 (47.9)
5.6–6.0 6 (19.4) 11 (22.9)
6.1–6.9 4 (12.9) 12 (25.0)
≥7.0 ≥11.1 3 (9.7) 5 (10.4)
≥7.0 7.8–11.0 1 (3.2) 1 (2.1)
≥7.0 <7.8 0 0
Values are presented as number (%).
Table 4. Risk of diabetes diagnosis during 5 years of follow-up among participants with normal fasting glucose at baseline (<5.6 mmol/L)
Variable Univariate Multivariate
OR (95% CI) P value OR (95% CI) P value
Age 1.06 (1.03–1.10) <0.001 1.05 (1.01–1.10) 0.026
Female sex 1.50 (0.71–3.16) 0.285 1.95 (0.72–5.29) 0.191
Family history of diabetes 4.04 (1.91–8.56) <0.001 3.24 (1.42–7.40) 0.005
Fasting plasma glucose 3.62 (1.20–10.86) 0.022 2.21 (0.56–8.82) 0.260
2-Hour postload glucose 3.27 (2.32–4.60) <0.001
Current smoking 1.17 (0.43–3.19) 0.766
Moderate alcohol consumption 0.15 (0.02–1.12) 0.064
Regular physical activity 0.30 (0.09–1.02) 0.053
Hypertension 2.89 (1.39–6.00) 0.004 0.69 (0.22–2.22) 0.537
Cardiovascular disease 7.50 (2.23–25.19) 0.001 3.99 (0.92–17.29) 0.064
Body mass index 1.09 (0.98–1.22) 0.105
Waist circumference 1.03 (0.99–1.06) 0.152
Systolic blood pressure 1.04 (1.02–1.06) <0.001 1.03 (0.99–1.07) 0.185
Diastolic blood pressure 1.05 (1.01–1.09) 0.021 0.99 (0.93–1.06) 0.770
Fasting insulin 1.01 (1.003–1.02) 0.003 1.01 (1.00–1.02) 0.064
HOMA-IR 1.31 (1.10–1.56) 0.003
HOMA-B% 1.00 (0.999–1.001) 0.957
Insulinogenic index 0.64 (0.38–1.08) 0.093
Total cholesterol 1.48 (1.06–2.06) 0.021
Triglycerides 1.41 (1.10–1.80) 0.007 1.29 (0.98–1.69) 0.070
HDL-C 0.56 (0.23–1.38) 0.208
LDL-C 1.22 (0.84–1.79) 0.296
Non-HDL-C 1.53 (1.12–2.08) 0.008 1.12 (0.75–1.68) 0.584
Moderate alcohol consumption was defined as consuming 6 to 48 g of alcohol daily. Blanks indicate variables not included in the multivariate model.
OR, odds ratio; CI, confidence interval; HOMA-IR, homeostasis model assessment of insulin resistance; HOMA-B%, homeostasis model as- sessment of β-cell function; HDL-C, high density lipoprotein cholesterol; LDL-C, low density lipoprotein cholesterol.
low density lipoprotein cholesterol, and non-high density lipo- protein cholesterol (non-HDL-C) were highly correlated with each other, but only non-HDL-C was included in the model due to its smaller P value in univariate analysis. Similarly, the inclusion of both HOMA-IR and fasting insulin in a model causes multicollinearity; thus, we selected fasting insulin. In univariate analysis, the 2PG level was the strongest predictor for the future diagnosis of T2DM. However, we did not include 2PG levels in the multivariate analysis because the OGTT is not performed routinely in real clinical practice. Age and fami- ly history of diabetes were independent predictors for diabetes diagnosis during 5 years of follow-up; however, FPG level was
not (Table 4). During 10 years of follow-up, a family history of diabetes and fasting glucose and insulin levels were indepen- dently associated with increased risk of diabetes (Table 5).
DISCUSSION
In the current prospective study performed on Japanese Amer- ican men and women with NFG at baseline, 16.1% of subjects were diagnosed with T2DM during 10 years of follow-up.
However, a substantial number of these subjects still showed NFG levels at the time of diagnosis of diabetes (54.8% during 5 years of follow-up and 39.6% during 10 years of follow-up). On Table 5. Risk of diabetes diagnosis during 10 years of follow-up among participants with normal fasting glucose at baseline (<5.6 mmol/L)
Variable Univariate Multivariate
OR (95% CI) P value OR (95% CI) P value
Age 1.04 (1.02–1.07) 0.002 1.03 (0.99–1.07) 0.167
Female 1.23 (0.66–2.27) 0.515 1.44 (0.54–3.83) 0.467
Family history of diabetes 3.34 (1.80–6.23) <0.001 2.76 (1.37–5.54) 0.004
Fasting plasma glucose 5.42 (2.09–14.08) 0.001 3.69 (1.13–12.01) 0.030
2-Hour postload glucose 2.41 (1.88–3.09) <0.001
Current smoking 1.41 (0.61–3.27) 0.428
Moderate alcohol consumption 0.22 (0.05–0.92) 0.039 0.22 (0.04–1.35) 0.102
Regular physical activity 0.70 (0.32–1.52) 0.370
Hypertension 2.51 (1.34–4.70) 0.004 0.71 (0.26–1.93) 0.500
Cardiovascular disease 4.02 (1.22–13.21) 0.022 1.92 (0.46–8.06) 0.373
Body mass index 1.09 (0.997–1.20) 0.059
Waist circumference 1.03 (1.001–1.06) 0.044 0.99 (0.94–1.03) 0.552
Systolic blood pressure 1.03 (1.02–1.05) <0.001 1.02 (0.99–1.06) 0.253
Diastolic blood pressure 1.05 (1.02–1.09) 0.003 1.01 (0.95–1.06) 0.850
Fasting insulin 1.01 (1.01–1.02) <0.001 1.01 (1.00–1.02) 0.037
HOMA-IR 1.48 (1.23–1.78) <0.001
HOMA-B% 1.00 (0.999–1.001) 0.926
Insulinogenic index 0.80 (0.57–1.13) 0.209
Total cholesterol 1.50 (1.11–2.03) 0.009
Triglycerides 1.35 (1.07–1.70) 0.012 1.23 (0.95–1.60) 0.114
HDL-C 0.47 (0.22–1.02) 0.055
LDL-C 1.41 (1.01–1.97) 0.042
Non-HDL-C 1.58 (1.20–2.09) 0.001 1.19 (0.82–1.71) 0.360
Moderate alcohol consumption was defined as consuming 6 to 48 g of alcohol daily. Blanks indicate variables not included in the multivariate model.
OR, odds ratio; CI, confidence interval; HOMA-IR, homeostasis model assessment of insulin resistance; HOMA-B%, homeostasis model as- sessment of β-cell function; HDL-C, high density lipoprotein cholesterol; LDL-C, low density lipoprotein cholesterol.
the other hand, only 12.5% of the diabetes cases were diag- nosed based on FPG levels ≥7.0 mmol/L. Age, family history of diabetes, and fasting insulin level were independently asso- ciated with future diagnosis of T2DM during 10 years of fol- low-up, but an independent association between FPG levels and diabetes diagnosis risk was not evident during the first 5 years of follow-up.
Previous studies performed in subjects with NFG have con- sistently demonstrated that higher FPG levels are associated with future diabetes risk even within the normoglycemic range, although the absolute risk of diabetes was relatively low, with an annual incidence of approximately 0.3% to 0.6% [3-5].
However, our results contradicted those of previous studies by demonstrating that FPG levels within the NFG range did not independently predict future diabetes diagnosis during a rela- tive short-term follow-up period of up to 5 years, but were a significant predictor for diabetes upon long-term follow-up (10 years). We do not know the reason for this discrepancy, but may offer the following explanations. First, T2DM in Asians has been suggested to differ from that in Caucasians [17].
T2DM is characterized by both deterioration of insulin sensi- tivity and β-cell dysfunction [18]. In many non-Asian individ- uals who have IGT, there is hyperinsulinemia to compensate for insulin resistance, but eventually insulin secretion becomes lower during the development of overt diabetes. Studies have shown that an inadequate insulin secretory capacity to com- pensate for insulin resistance is a key factor in the development of glucose intolerance in the Asians [19]. In a study of native Japanese, no compensatory hyperinsulinemia was observed, even in those with IGT status, and insulin levels declined rap- idly after the development of overt diabetes [20]. Based upon these observations, we have postulated that Japanese Ameri- cans are individuals with diminished β-cell reserve and that diabetes develops when insulin resistance is superimposed [21]. In addition, it was suggested that postchallenge hypergly- cemia is more common in Asians than in Caucasians [22,23], and isolated IGT or an isolated high 2PG level of ≥11.1 mmol/L is closely related to defective early-phase insulin secretion, which is commonly seen in Asians, and is related to a lesser ex- tent to insulin resistance [24]. Second, in previous studies [3-5]
on this subject, non-Asian populations were evaluated, OGTTs were not performed, and only FPG levels and/or medical re- cords were used to diagnose incident diabetes. Therefore, inci- dent diabetes cases with high 2PG levels of ≥11.1 mmol/L could not be identified, so the incidence of diabetes was un-
doubtedly underestimated [3-5]. In support of our finding, the annual rate of diabetes was 1.6% during the 10 years of follow- up, while previous studies reported an annual incidence of ap- proximately 0.3% to 0.6%.
Our study also has some limitations. First, the sample size was smaller than those of previous studies. Second, glycated hemoglobin levels were not available for the diagnosis of dia- betes. Glycated hemoglobin level may be an early indicator of diabetes, especially for patients in whom an NFG level is avail- able while OGTT is not, and thus the frequency of diabetes di- agnosis might have been underestimated. Lastly, although it was an acceptably low level, 16.2% of subjects were lost to fol- low-up over the 10 years of the study period. This study also has several clinical implications. In clinical practice, physicians should not view NFG as a benign condition with low risk for future diabetes diagnosis and thus be complacent regarding patients who have NFG levels. This may be especially true for Asian patients. Moreover, FPG levels may have limited clinical relevance in the assessment of the risk of future diabetes diag- nosis among subjects with NFG, at least within a short-term follow-up period. Instead, physicians should pay attention to age, degree of insulin resistance, and family history of diabetes when predicting future diabetes diagnosis in subjects with NFG levels. In addition, the value of the OGTT should not be underestimated as a way to detect diabetes earlier and thus provide an opportunity to institute measures to prevent dia- betic complications in subjects with NFG.
In summary, our results suggest that a substantial propor- tion of Japanese American subjects with NFG progress to T2DM diagnosis over 10 years of follow-up. However, the ac- tual level of FPG does not predict future diabetes diagnosis within a short-term follow-up period of 5 years. On the other hand, age, family history of diabetes, and fasting insulin level may be predictors of future diagnosis in subjects with NFG.
CONFLICTS OF INTEREST
No potential conflict of interest relevant to this article was re- ported.
ACKNOWLEDGMENTS
We are grateful to the King County Japanese-American com- munity for support and cooperation. VA Puget Sound Health Care System provided support for Drs. Boyko and Kahn’s in-
volvement in this research.
This work was supported by facilities and services provided by the Diabetes Research Center (DK-17047), Clinical Nutri- tion Research Unit (DK-35816), and the General Clinical Re- search Center (RR-00037) at the University of Washington.
Funding was through National Institutes of Health grants DK- 31170, HL-49293 and DK-017047. The funding entities had no role in the conduct of this study or interpretation of its results.
REFERENCES
1. Genuth S, Alberti KG, Bennett P, Buse J, Defronzo R, Kahn R, Kitzmiller J, Knowler WC, Lebovitz H, Lernmark A, Nathan D, Palmer J, Rizza R, Saudek C, Shaw J, Steffes M, Stern M, Tu- omilehto J, Zimmet P; Expert Committee on the Diagnosis and Classification of Diabetes Mellitus. Follow-up report on the diagnosis of diabetes mellitus. Diabetes Care 2003;26:3160- 7.
2. Tai ES, Goh SY, Lee JJ, Wong MS, Heng D, Hughes K, Chew SK, Cutter J, Chew W, Gu K, Chia KS, Tan CE. Lowering the criterion for impaired fasting glucose: impact on disease preva- lence and associated risk of diabetes and ischemic heart dis- ease. Diabetes Care 2004;27:1728-34.
3. Tirosh A, Shai I, Tekes-Manova D, Israeli E, Pereg D, Shochat T, Kochba I, Rudich A; Israeli Diabetes Research Group. Normal fasting plasma glucose levels and type 2 diabetes in young men.
N Engl J Med 2005;353:1454-62.
4. Nichols GA, Hillier TA, Brown JB. Normal fasting plasma glu- cose and risk of type 2 diabetes diagnosis. Am J Med 2008;121:
519-24.
5. Brambilla P, La Valle E, Falbo R, Limonta G, Signorini S, Cap- pellini F, Mocarelli P. Normal fasting plasma glucose and risk of type 2 diabetes. Diabetes Care 2011;34:1372-4.
6. Meigs JB, Muller DC, Nathan DM, Blake DR, Andres R; Balti- more Longitudinal Study of Aging. The natural history of pro- gression from normal glucose tolerance to type 2 diabetes in the Baltimore Longitudinal Study of Aging. Diabetes 2003;52:
1475-84.
7. Qiao Q, Hu G, Tuomilehto J, Nakagami T, Balkau B, Borch- Johnsen K, Ramachandran A, Mohan V, Iyer SR, Tominaga M, Kiyohara Y, Kato I, Okubo K, Nagai M, Shibazaki S, Yang Z, Tong Z, Fan Q, Wang B, Chew SK, Tan BY, Heng D, Emmanuel S, Tajima N, Iwamoto Y, Snehalatha C, Vijay V, Kapur A, Dong Y, Nan H, Gao W, Shi H, Fu F; DECODA Study Group. Age- and sex-specific prevalence of diabetes and impaired glucose
regulation in 11 Asian cohorts. Diabetes Care 2003;26:1770-80.
8. DECODE Study Group. Age- and sex-specific prevalences of diabetes and impaired glucose regulation in 13 European co- horts. Diabetes Care 2003;26:61-9.
9. Yang W, Lu J, Weng J, Jia W, Ji L, Xiao J, Shan Z, Liu J, Tian H, Ji Q, Zhu D, Ge J, Lin L, Chen L, Guo X, Zhao Z, Li Q, Zhou Z, Shan G, He J; China National Diabetes and Metabolic Disor- ders Study Group. Prevalence of diabetes among men and women in China. N Engl J Med 2010;362:1090-101.
10. Araneta MR, Kanaya AM, Hsu WC, Chang HK, Grandinetti A, Boyko EJ, Hayashi T, Kahn SE, Leonetti DL, McNeely MJ, Oni- shi Y, Sato KK, Fujimoto WY. Optimum BMI cut points to screen asian americans for type 2 diabetes. Diabetes Care 2015;
38:814-20.
11. Fujimoto WY, Leonetti DL, Kinyoun JL, Shuman WP, Stolov WC, Wahl PW. Prevalence of complications among second- generation Japanese-American men with diabetes, impaired glucose tolerance, or normal glucose tolerance. Diabetes 1987;
36:730-9.
12. Koppes LL, Dekker JM, Hendriks HF, Bouter LM, Heine RJ.
Moderate alcohol consumption lowers the risk of type 2 diabe- tes: a meta-analysis of prospective observational studies. Dia- betes Care 2005;28:719-25.
13. Paffenbarger RS Jr, Wing AL, Hyde RT. Physical activity as an index of heart attack risk in college alumni. Am J Epidemiol 1978;108:161-75.
14. Bergstrom RW, Leonetti DL, Newell-Morris LL, Shuman WP, Wahl PW, Fujimoto WY. Association of plasma triglyceride and C-peptide with coronary heart disease in Japanese-Ameri- can men with a high prevalence of glucose intolerance. Diabe- tologia 1990;33:489-96.
15. Matthews DR, Hosker JP, Rudenski AS, Naylor BA, Treacher DF, Turner RC. Homeostasis model assessment: insulin resis- tance and beta-cell function from fasting plasma glucose and insulin concentrations in man. Diabetologia 1985;28:412-9.
16. Report of the expert committee on the diagnosis and classifica- tion of diabetes mellitus. Diabetes Care 1997;20:1183-97.
17. Yoon KH, Lee JH, Kim JW, Cho JH, Choi YH, Ko SH, Zimmet P, Son HY. Epidemic obesity and type 2 diabetes in Asia. Lancet 2006;368:1681-8.
18. Kahn SE. The relative contributions of insulin resistance and beta-cell dysfunction to the pathophysiology of type 2 diabetes.
Diabetologia 2003;46:3-19.
19. Jensen CC, Cnop M, Hull RL, Fujimoto WY, Kahn SE; Ameri- can Diabetes Association GENNID Study Group. Beta-cell
function is a major contributor to oral glucose tolerance in high-risk relatives of four ethnic groups in the U.S. Diabetes 2002;51:2170-8.
20. Fukushima M, Suzuki H, Seino Y. Insulin secretion capacity in the development from normal glucose tolerance to type 2 dia- betes. Diabetes Res Clin Pract 2004;66 Suppl 1:S37-43.
21. Fujimoto WY, Boyko EJ, Hayashi T, Kahn SE, Leonetti DL, McNeely MJ, Shuman WP. Risk factors for type 2 diabetes: les- sons learned from Japanese Americans in Seattle. J Diabetes Investig 2012;3:212-24.
22. DECODA Study Group; International Diabetes Epidemiology Group. Cardiovascular risk profile assessment in glucose-intol- erant Asian individuals: an evaluation of the World Health Or-
ganization two-step strategy. The DECODA Study (Diabetes Epidemiology: Collaborative Analysis of Diagnostic Criteria in Asia). Diabet Med 2002;19:549-57.
23. DECODE Study Group on behalf of the European Diabetes Epidemiology Study Group. Will new diagnostic criteria for diabetes mellitus change phenotype of patients with diabetes?
Reanalysis of European epidemiological data. BMJ 1998;317:
371-5.
24. Suzuki H, Fukushima M, Usami M, Ikeda M, Taniguchi A, Na- kai Y, Matsuura T, Kuroe A, Yasuda K, Kurose T, Seino Y, Ya- mada Y. Factors responsible for development from normal glu- cose tolerance to isolated postchallenge hyperglycemia. Diabe- tes Care 2003;26:1211-5.