Copyright © 2016 The Korean Society for Bone and Mineral Research
This is an Open Access article distributed under the terms of the Creative Commons Attribution Non-Commercial Li- cense (http://creativecommons.org/licenses/by-nc/3.0/) which permits unrestricted non-commercial use, distribu- tion, and reproduction in any medium, provided the original work is properly cited.
pISSN 2287-6375 eISSN 2287-7029
Osteoporotic Fracture Risk Assessment Using Bone Mineral Density in Korean: A Community-based Cohort Study
Eun Jin Jang1, Young-Kyun Lee2, Hyung Jin Choi3, Yong-Chan Ha4, Sunmee Jang5, Chan Soo Shin6, Nam Han Cho7
1Department of Information Statistics, Andong National University, Andong;
2Department of Orthopaedic Surgery, Seoul National University Bundang Hospital, Seongnam;
3Department of Anatomy, Seoul National University College of Medicine, Seoul;
4Department of Orthopaedic Surgery, School of Medicine, Chung-Ang University College of Medicine, Seoul;
5College of Pharmacy, Gachon University, Incheon;
6Department of Internal Medicine, Seoul National University College of Medicine, Seoul;
7Department of Preventive Medicine, Ajou University School of Medicine, Suwon, Korea
Background: Fracture-risk assessment tool (FRAX) using just clinical risk factors of os- teoporosis has been developed to estimate individual risk of osteoporotic fractures. We developed prediction model of fracture risk using bone mineral density (BMD) as well as clinical risk factors in Korean, and assessed the validity of the final model. Methods: To develop and validate an osteoporotic FRAX, a total of 768 Korean men and women aged 50 to 90 years were followed for 7 years in a community-based cohort study. BMD as well as clinical risk factors for osteoporotic fracture including age, sex, body mass index, history of fragility fracture, family history of fracture, smoking status, alcohol intake, use of oral glucocorticoid, rheumatoid arthritis, and other causes of secondary osteoporosis were assessed biannually. Results: During the follow-up period, 86 osteoporotic frac- tures identified (36 in men and 50 in women). The developed prediction models showed high discriminatory power and had goodness of fit. Conclusions: The developed a Kore- an specific prediction model for osteoporotic fractures can be easily used as a screening tool to identify individual with high risk of osteoporotic fracture. Further studies for vali- dation are required to confirm the clinical feasibility in general Korean population.
Key Words: Bone density, Korea, Osteoporotic fractures, Risk assessment
INTRODUCTION
Osteoporosis is characterized as skeletal condition with low bone mass, micro- architectural deterioration of bone, and reduced bone strength.[1] Osteoporosis increases the risk of fragile osteoporotic fractures. Osteoporotic fractures have be- come a major health and economic burden worldwide, because it is associated with high morbidity and mortality.[2-4] In Korea, 12.3% of women aged 50 years experience a hip fracture in their life. In addition, 59.5% have osteoporotic frac- tures during their lifetime.[5] The socioeconomic burden of osteoporotic fractures will increase dramatically in the future, because the elderly population will increase in Korea.[3] Therefore, early detection of individuals with high risk of fracture would be helpful to reduce burden caus ed by osteoporotic fractures.
Low bone mineral density (BMD) is a strong predictor of osteoporotic fracture Corresponding authors
Yong-Chan Ha
Department of Orthopaedic Surgery, School of Medicine, Chung- Ang University College of Medicine, 102 Heukseok-ro, Dongjak- gu, Seoul 06973, Korea
Tel: +82-2-6299-1577, Fax: +82-2-822-1710 E-mail: [email protected] Sunmee Jang
College of Pharmacy, Gachon University, 1342 Seongnam- daero, Sujeong-gu, Seongnam 13120, Korea Tel: +82-32-820-4827, Fax: +82-32-820-4829 E-mail: [email protected] Chan Soo Shin
Department of Internal Medicine, Seoul National University College of Medicine, 101 Daehak-ro, Jongno-gu, Seoul 03080, Korea
Tel: +82-2-2072-3734, Fax: +82-2-765-3734 E-mail: [email protected]
Nam Han Cho
Department of Preventive Medicine, Ajou University School of Medicine, 164 Worldcup-ro, Yeongtong-gu, Suwon 16499, Korea
Tel:+82-31-219-4217, Fax; 031-219-5084 E-mail:[email protected]
Eun Jin Jang and Young-Kyun Lee contributed equally to this work and should be considered co-first authors.
Yong-Chan Ha, Sunmee Jang, Chan Soo Shin, and Nam Han Cho contributed equally to this work and should be considered co-corresponding authors.
Received: February 11, 2016 Revised: February 17, 2016 Accepted: February 18, 2016
No potential conflict of interest relevant to this article was reported.
National Health Insurance Database was provided by the National Health Insurance Service (NHIS) of Korea. The authors would like to thank the National Health Insurance Service for cooperation. This research was supported by a grant of the Korea Health Technology R&D Project through the Korea Health Industry Development Institute (KHIDI), funded by the Ministry of Health & Welfare, Korea (grant number: HI13C1522).
This study was provided with biospecimens and data from the Korean Genome Analysis Project (4845-301), the Korean Genome and Epidemiology Study (4851-302), and Korea Biobank project (4851-307, KBP-2014-25) that were supported by the Korea Center for Disease Control and Prevention, Republic of Korea.
Original Article
risk,[6] and dual energy X-ray absorptiometry (DXA; Lunar Prodigy, GE Medical Systems, Madison, WI, USA) is the most widely accepted method to diagnose osteoporosis. How- ever, DXA has been limited to use for postmenopausal wo- men aged 65 years or older, and younger adults with known risk factors.[7] DXA is not recommended as a routine screen- ing test for the general population. Several fracture-risk as- sessment tools (FRAXs) have been developed from some clinical variables. However, most of tools have been devel- oped for the Western population.[8-11] The risk and inci- dence of osteoporotic fractures varies widely between pop- ulations.[12] Thus, population-specific data are required to predict the risk of fracture in each population. However, few studies have developed assessment model from the clinical risk factors of osteoporotic fractures in Korean pop- ulation.
Our purpose was to develop and validate an osteoporot- ic FRAX to identify high-risk Korean, based on community- based cohort dataset.
METHDOS
1. Study population
The study population consisted of 363 men and 405 wo- men from a prospective community-based cohort (Ansung cohort).
The Ansung cohort was established for Korean Health and Genome Study (KHGS) in 2001 to investigate the prev- alence and determinants of chronic diseases in Korea. The Ansung cohort participants include rural residents, and the farming community of Ansung had a population of 123,906 in 2000.[13] Details of this cohort have been previously de- scribed.[14] Eligibility criteria of the Ansung cohort were residents of 5 randomly selected governing rural regions (Myons) (7,192 subjects) from a total of 11 (123,906 sub- jects), age between 40 and 69 at year 2001 and available to participate clinical examinations. Total of 5,018 subjects (2,240 men and 2,778 women) were surveyed among 7,192 eligible subjects (response rate 70%), and followed up for clinical examination, anthropometric measurements, blood sampling and a questionnaire biennially. Among these 5,018 subjects of Ansung cohort, 1,547 male and 1,991 fe- male underwent BMD measurements during 2006 to 2007.
Among them, 768 subjects (363 men and 405 women), who did not have a history of anti-osteoporotic drug, were
included in this study.
Information on potentially significant risk factors for os- teoporotic fractures was obtained from self-administered questionnaires. The questionnaire included asked about age, history of fracture, family history of osteoporotic frac- ture, smoking status, alcohol consumption, use of oral glu- cocorticoid, rheumatoid arthritis, and secondary osteopo- rosis. A positive history of fracture was defined as any type of fracture of and at any age. A positive family history of osteoporotic fracture was defined as a history of physician diagnosed osteoporotic fracture in the first-degree relatives.
Smoking status was evaluated by using daily amount of cigarettes. Total alcohol intake was measured by the num- ber of glasses of “Soju” consumed. One glass of Soju con- tains about one unit of ethanol. In this study, three or more units of alcohol intake were considered high alcohol intake.
Use of an oral glucocorticoid was defined if prescribed >30 days in the 1 year. All data were collected by trained staff using standardized questionnaire and the face-to-face in- terview method.
2. Measurements of anthropometric parameters and BMD
Height and body weight were measured with subjects wearing light clothes. The BMD (g/cm2) measurements of central skeletal sites (lumbar spine, femoral neck and total hip) were obtained using DXA. For lumbar spine BMD, L1-4 value was chosen for analyses, and when L1-4 was not suit- able for analysis due to compression fracture or severe scle- rotic change, L2-4 or L1-3 was used.
Our primary outcome was an osteoporotic fracture (hip, vertebral, upper arm, or wrist).
3. Model development and validation
The osteoporotic fracture predictive models for men and women were developed separately. Baseline characteris- tics are summarized mean and standard deviation for con- tinuous variables and frequencies and percentages for cat- egorical variables, respectively. The following variables were initially identified from the literature as traditional risk fac- tors for osteoporotic fracture: age, height, weight, prior fracture, current smoking status, high alcohol intake, use of steroids, rheumatoid arthritis, and BMD. These covari- ates were screened with a significance level of P=0.05. The predictive models were estimated using logistic regression
model in the modeling set, because the date of fracture could not be exactly identified. We followed each patient from the examination date in 2006 until the fracture or De- cember 2012. The logistic regression model with k risk fac- tors for time t (t=7) was estimated for each sex using the following equation:
P =
where f(x,M)=β1(x1 - M1) + β2(x2 - M2) + ··· + βk (xk - Mk). Here, β1, β2, ···, βk are the regression coefficients; x1, x2, ···, xk are the risk factors for each individual; and M1, M2, ···, Mk are the mean values for each risk factor in the cohort.
The predictive accuracy for the occurrence of a fracture within a 7-year period was assessed for discrimination and validation. Discrimination or the ability to distinguish be- tween those who experienced the event and those who did not was assessed using c-statistics.[15]
When c-statistics become closer to 1.0, it means that the discriminatory power is higher.
To test goodness of fit for logistic regression models, Hos- mer-Lemeshow test was used.
Statistical analyses were performed using SAS version 9.3 (SAS Institute, Cary, NC, USA), P-values <0.05 were considered significant. Study protocols were in accordance with institutional guidelines and approved by an Institu- tional Review Board. Informed consent was obtained from the study participants.
RESULTS
Total number of participants was 768. There were 363 men (47.3%) and 405 women (52.7%). Table 1 showed the baseline characteristics. Osteoporotic fracture occurred in 36 men (9.9%) and in 50 women (12.3%).
The major risk factor of osteoporotic fracture was BMD in men, and the risk of osteoporotic fracture decreased 58%
in men, when one unit of BMD increased. Regression coef- ficient of each variable in the final multiple regression mod- el are shown in Table 2. FRAX for Korean men was devel- oped as follows;
f(x) with BMD=-2.5346 +0.013×(age-61.30) -0.8725× (BMD +0.39) -0.0271×(BMI-23.57) +0.6007×(history of osteoporotic fracture -0.0275) +0.00537×(daily smoking- 1+exp(f(x))
exp(f(x))
Table 1. Baseline characteristic of study population
(n=363)Men Women (n=405)
Age 61.30±7.14 61.14±7.12
BMD -0.39±0.97 -0.88±1.04
BMI 23.57±2.97 25.25±3.48
History of osteoporotic fracture 10 (2.75%) 9 (2.22%) Parents’ history of osteoporotic fracture 23 (6.34%) 35 (8.64%) Daily amount of cigarette 15.34±12.90 0.18±1.16 Alcohol drinking (over 3 units) 68 (18.73%) 3 (0.74%)
Oral glucocorticoid 1 (0.28%) 0 (0.00%)
Rheumatoid arthritis 5 (1.38%) 23 (5.68%)
Secondary osteoporosis 0 (0.00%) 11 (2.72%) BMD, bone mineral density; BMI, body mass index.
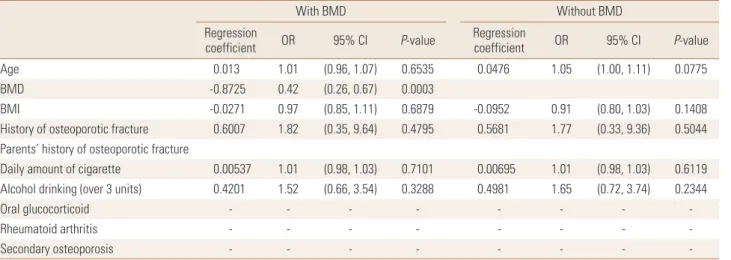
Table 2. Regression coefficient in the final multiple regression model for men
With BMD Without BMD
Regression
coefficient OR 95% CI P-value Regression
coefficient OR 95% CI P-value
Age 0.013 1.01 (0.96, 1.07) 0.6535 0.0476 1.05 (1.00, 1.11) 0.0775
BMD -0.8725 0.42 (0.26, 0.67) 0.0003
BMI -0.0271 0.97 (0.85, 1.11) 0.6879 -0.0952 0.91 (0.80, 1.03) 0.1408
History of osteoporotic fracture 0.6007 1.82 (0.35, 9.64) 0.4795 0.5681 1.77 (0.33, 9.36) 0.5044 Parents’ history of osteoporotic fracture
Daily amount of cigarette 0.00537 1.01 (0.98, 1.03) 0.7101 0.00695 1.01 (0.98, 1.03) 0.6119 Alcohol drinking (over 3 units) 0.4201 1.52 (0.66, 3.54) 0.3288 0.4981 1.65 (0.72, 3.74) 0.2344
Oral glucocorticoid - - - - - - - -
Rheumatoid arthritis - - - - - - - -
Secondary osteoporosis - - - - - - - -
BMD, bone mineral density; OR, odds ratio; CI, confidence interval; BMI, body mass index.
15.34)+0.4201×(alcohol-0.1873)
f(x) without BMD=-2.3166+0.0476×(age-61.30)-0.0952
×(BMI -23.57) +0.5681×(history of osteoporotic fracture - 0.0275)+0.00695×(daily smoking-15.34)+0.4201×(alco- hol-0.1873)
Model including BMD and model without BMD showed same c-statistics of 0.739 in men, indicating that the discri- minatory power is high. Hosmer-Lemeshow test showed that both models had goodness of fit.
The major risk factor of osteoporotic fracture was also BMD in women, and the risk of osteoporotic fracture de- creased 47% in women, when one unit of BMD increased.
In model without BMD, the risk of osteoporotic fracture in- creased 6% in women, when age of women increased 1.
Regression coefficient of each variable in the final multiple regression model are shown in Table 3. FRAX for Korean women was developed as follows;
f(x) with BMD=-2.1858 +0.019×(age -61.14) -0.6452× (BMD +0.88) -0.00089×(BMI -25.25) -0.00038×(history of osteoporotic fracture -0.0222) +0.7017×(family history of fractures-0.0864)+0.0824×(daily smoking-0.18)+0.7042× (RA-0.0568)+0.8684×(secondary osteoporosis-0.0272)
f(x) without BMD=-2.0808+0.062×(age-61.14)-0.0492× (BMI-25.25)+0.0341×(history of osteoporotic fracture-0.0222)
+0.758×(family history of fractures-0.0864)+0.0961×(daily smoking-0.18)+0.6364×(RA-0.0568)+0.5739×(secondary
osteoporos is-0.0272)
Model including BMD showed c-statistics of 0.718 in wo- men, and model without BMD showed c-statistics of 0.73 in women, indicating that the discriminatory power of each model is high. Hosmer-Lemeshow test showed that both models had goodness of fit.
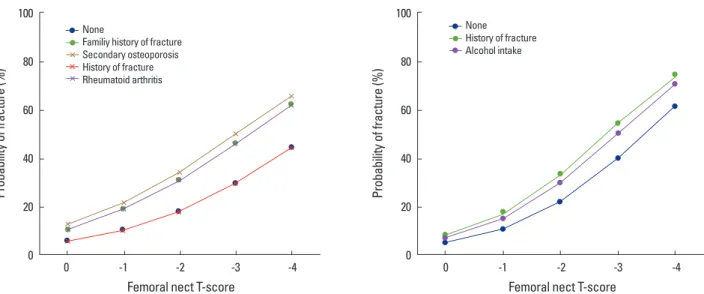
Figure 1 showed the probability of 7-year fracture risk according to T-score of BMD in 65-year old non-smoking Korean men and women with body mass index (BMI) of 25.
DISCUSSION
In this study, osteoporotic FRAX for Korean was devel- oped and validated in Korean population based on com- munity-based cohort.
To develop this model, we included simple variables, which have been identified in the literature as traditional risk fac- tors for osteoporotic fracture; age, height, weight, prior fracture, current smoking status, high alcohol intake, use of steroids, rheumatoid arthritis, and BMD. Moreover, we presented the assessment model even without BMD. This means that the estimation can be easily used for primary care setting to decide whether to evaluate BMD as well as for self-screening purposes in the general population.
Major risk factor for osteoporotic fracture identified in this study was BMD, and this confirmed results of previous studies showing that higher BMD decreases the risk of os- teoporotic fracture.[16-19] Adding BMD to the risk factor assessment could improve the prediction for osteoporotic
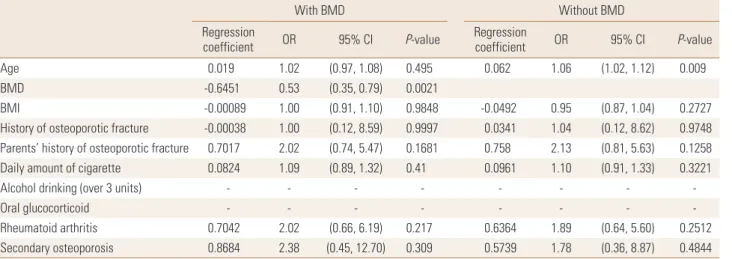
Table 3. Regression coefficient in the final multiple regression model for women
With BMD Without BMD
Regression
coefficient OR 95% CI P-value Regression
coefficient OR 95% CI P-value
Age 0.019 1.02 (0.97, 1.08) 0.495 0.062 1.06 (1.02, 1.12) 0.009
BMD -0.6451 0.53 (0.35, 0.79) 0.0021
BMI -0.00089 1.00 (0.91, 1.10) 0.9848 -0.0492 0.95 (0.87, 1.04) 0.2727
History of osteoporotic fracture -0.00038 1.00 (0.12, 8.59) 0.9997 0.0341 1.04 (0.12, 8.62) 0.9748 Parents’ history of osteoporotic fracture 0.7017 2.02 (0.74, 5.47) 0.1681 0.758 2.13 (0.81, 5.63) 0.1258
Daily amount of cigarette 0.0824 1.09 (0.89, 1.32) 0.41 0.0961 1.10 (0.91, 1.33) 0.3221
Alcohol drinking (over 3 units) - - - - - - - -
Oral glucocorticoid - - - - - - - -
Rheumatoid arthritis 0.7042 2.02 (0.66, 6.19) 0.217 0.6364 1.89 (0.64, 5.60) 0.2512
Secondary osteoporosis 0.8684 2.38 (0.45, 12.70) 0.309 0.5739 1.78 (0.36, 8.87) 0.4844
BMD, bone mineral density; OR, odds ratio; CI, confidence interval; BMI, body mass index.
fracture. However, in the some situation, which is limited to access DXA due to high cost or primary care, prediction model without BMD could be also helpful to determine whether to evaluate BMD.
There are some limitations in this study. First, we evalu- ated our main outcome, osteoporotic fracture, by using self-administration questionnaire. This might result in re- call bias. Second, this model has not been validated in an independent population. There might be selection bias during developing cohort. Therefore, validation study is needed in an independent population or with other FRAXs, such as FRAX.[20,21]
However, this study is the first study of community-based cohort to develop estimation model of osteoporotic frac- ture risk. This study presented that prediction model is use- ful in primary care setting and in self-screening for osteo- porosis in Korean population.
REFERENCES
1. Peck WA, Burckhardt P, Christiansen C, et al. Consensus de- velopment conference: diagnosis, prophylaxis, and treat- ment of osteoporosis. Am J Med 1993;94:646-50.
2. Kang BJ, Lee YK, Lee KW, et al. Mortality after hip fractures in nonagenarians. J Bone Metab 2012;19:83-6.
3. Yoon HK, Park C, Jang S, et al. Incidence and mortality fol- lowing hip fracture in Korea. J Korean Med Sci 2011;26:
1087-92.
Fig. 1. The probability of 7-year fracture risk according to T-score of bone mineral density in 65-year-old non-smoking Korean men and women with body mass index of 25.
100
80 60 40
20 0
Probability of fracture (%)
0 -1 -2 -3 -4
Femoral nect T-score
None
Familiy history of fracture Secondary osteoporosis History of fracture Rheumatoid arthritis
100
80 60 40
20 0
Probability of fracture (%)
0 -1 -2 -3 -4
Femoral nect T-score
None History of fracture Alcohol intake
4. Lee YK, Jang S, Jang S, et al. Mortality after vertebral frac- ture in Korea: analysis of the National Claim Registry. Os- teoporos Int 2012;23:1859-65.
5. Park C, Ha YC, Jang S, et al. The incidence and residual life- time risk of osteoporosis-related fractures in Korea. J Bone Miner Metab 2011;29:744-51.
6. Johnell O, Kanis JA, Oden A, et al. Predictive value of BMD for hip and other fractures. J Bone Miner Res 2005;20:1185- 94.
7. Lim LS, Hoeksema LJ, Sherin K, et al. Screening for osteo- porosis in the adult U.S. population: ACPM position state- ment on preventive practice. Am J Prev Med 2009;36:366- 75.
8. Cadarette SM, Jaglal SB, Kreiger N, et al. Development and validation of the Osteoporosis Risk Assessment Instrument to facilitate selection of women for bone densitometry.
CMAJ 2000;162:1289-94.
9. Salaffi F, Silveri F, Stancati A, et al. Development and vali- dation of the osteoporosis prescreening risk assessment (OPERA) tool to facilitate identification of women likely to have low bone density. Clin Rheumatol 2005;24:203-11.
10. Middleton RG, Shabani F, Uzoigwe CE, et al. FRAX and the assessment of the risk of developing a fragility fracture. J Bone Joint Surg Br 2012;94:1313-20.
11. Min YK, Lee DY, Park YS, et al. A FRAX Experience in Korea:
fracture risk probabilities with a country-specific versus a surrogate model. J Bone Metab 2015;22:113-8.
12. Barrett-Connor E, Siris ES, Wehren LE, et al. Osteoporosis
and fracture risk in women of different ethnic groups. J Bone Miner Res 2005;20:185-94.
13. STAT-Korea. Census 2000. 2001 [cited by 2016 Feb 26]. Avail- able from: http://www.kosis.kr
14. Shin C, Abbott RD, Lee H, et al. Prevalence and correlates of orthostatic hypotension in middle-aged men and wom- en in Korea: the Korean Health and Genome Study. J Hum Hypertens 2004;18:717-23.
15. Han JH, Park HS, Kim JA, et al. Apolipoprotein B is a better marker than non-HDL-cholesterol for the metabolic syn- drome in Koreans. Atherosclerosis 2008;197:333-8.
16. Hung LK, Wu HT, Leung PC, et al. Low BMD is a risk factor for low-energy Colles’ fractures in women before and after menopause. Clin Orthop Relat Res 2005:219-25.
17. Siris ES, Miller PD, Barrett-Connor E, et al. Identification and fracture outcomes of undiagnosed low bone mineral
density in postmenopausal women: results from the Na- tional Osteoporosis Risk Assessment. JAMA 2001;286:2815- 22.
18. Cawthon PM, Ewing SK, Mackey DC, et al. Change in hip bone mineral density and risk of subsequent fractures in older men. J Bone Miner Res 2012;27:2179-88.
19. Lau EM, Woo J, Leung PC, et al. Low bone mineral density, grip strength and skinfold thickness are important risk factors for hip fracture in Hong Kong Chinese. Osteoporos Int 1993;3:66-70.
20. Kanis JA, Johnell O, De Laet C, et al. International variations in hip fracture probabilities: implications for risk assess- ment. J Bone Miner Res 2002;17:1237-44.
21. Kanis JA, Odén A, McCloskey EV, et al. A systematic review of hip fracture incidence and probability of fracture world- wide. Osteoporos Int 2012;23:2239-56.