Received February 13, 2014, Revised June 5, 2014, Accepted June 10, 2014 Corresponding author: Yong-Heum Lee
The Eastern & Western Biomedical System Lab, Department of Biomedical Engineering, College of Health Science, Yonsei University, Wonju 220-710, Korea Tel: +82-33-760-2863, Fax: +82-33-760-1953, E-mail: [email protected]
This study was supported by a grant of the Korean Health Technology R&D Project, Ministry of Health & Welfare, Republic of Korea(HI10C2017(A102062)).
CCThis is an open access article distributed under the terms of the Creative Commons Attribution Non-Commercial License (http://creativecommons.org/licenses/ by-nc/3.0) which permits unrestricted non-commercial use, distribution, and reproduction in any medium, provided the original work is properly cited.
Body Composition Factor Comparisons of the Intracellular Fluid(ICW), Extracellular Fluid(ECW)
and Cell Membrane at Acupuncture Points and Non-Acupuncture Points by
Inducing Multiple Ionic Changes
Soo-Byeong Kim1, Kyung-Yul Chung1, Mi-Seon Jeon1, Tae-Min Shin2, Yong-Heum Lee3
1Wellness Technology R&D Center, Human and Culture Convergence Technology R&D Group,
Korea Institute of Industrial Technology, 2Medical Computer System Laboratory, Dept of Biomedical Engineering, College of Health Science, Yonsei University, 3Eastern & Western Biomedical System Laboratory,
Dept of Biomedical Engineering, College of Health Science, Yonsei University
생체이온 변화 유발 후 경혈과 비경혈에서의 생체 구조 성분 분석 및 비교를 통한 경혈 특이성 고찰
김수병1ㆍ정경렬1ㆍ전미선1ㆍ신태민2ㆍ이용흠3
1한국생산기술연구원, 휴먼문화융합연구실용화그룹 웰니스 R&D 센터, 2연세대학교 보건과학대학 의공학부, 의용컴퓨터시스템연구실,
3연세대학교 보건과학대학 의공학부, 동서의료시스템연구실
Objectives : The specificity of acupuncture point has been a highly controversial subject. Existing researches said that ion- distribution differences are observed on the acupuncture point. This study was conducted under the assumption that multiple ionic changes induced by muscle fatigue would be different between the acupuncture point with non-acupuncture point. Methods : To induce the identical fatigue, twenty subjects performed the knee extension/flexion exercise using the Biodex System 3. ST32 and ST33 as well as adjacent non-acupuncture points were selected. We measured blood lactate and analyzed the median fre- quency(MF) and peak torque. To obtain the information on the extracellular fluid(ECW), intracellular fluid(ICW) and cell mem- brane indirectly, we used the multi-frequency bioelectrical impedance analysis(MF-BIA) method. Results : MF, peak torque and blood lactate level of all measurement sites were gradually returned to normal. Re resistance of ST32 had a stronger response, but a non-acupuncture point adjacent to ST33 had a larger response up to 20 minutes post exercise. Ri resistances were similar for both acupoints and non-acupoints. The Cm capacitance of ST32 had a stronger response after inducing fatigue, but ST33 had a smaller response than a non-acupuncture point adjacent to it. Conclusions : In comparison with before and after inducing fatigue, the specificity of acupuncture points was not clearly observed. Hence, we concluded that the body composition factors extraction method had the limitation as a method of finding the specificity of acupuncture points by inducing fatigue.
Key words : acupuncture point, multi-frequency bioelectrical impedance analysis(MF-BIA), extracellular fluid(ECW), intracellular fluid(ICW), body composition
Introduction
Acupuncture is an important aspect of Traditional Chinese Medicine(TCM). Numerous studies have evaluated acupun- cture point characteristics to determine the significance of therapeutic or diagnostic points. A representative study re- ported that Ca2+ levels were higher at acupuncture points than at non-acupuncture points1). A similar study that used synchrotron x-ray fluorescence(SXRF) analysis indicated that there were high levels of metallic cations such as Ca2+, Fe3+, Cu2+, and Zn2+ at acupuncture points2). Since Ca2+ helps con- trol motion, metabolism and chemical reactions among cells, research has demonstrated that acupuncture points are signi- ficant and important points. Many studies that have shown important acupuncture point characteristics have indicated that these points are in close proximity to lymph vessels, capillaries, nerves and connective tissue structures2,3). Acu- puncture point positions anatomically correspond to trigger point positions, which induce pain or referred pain4). Several studies which examined the electrical characteristic differen- ces between acupuncture points and non-acupuncture points indicated that acupuncture points had lower impedance and higher conductivity than non-acupuncture points5-8). More- over, it was reported that an acupuncture point was more effective than a non-acupuncture point when a manual acu- puncture needle was inserted9). Based on these results, acu- puncture points have been considered as important points that transduce electromagnetic signals. On the other hand, some studies have argued that acupuncture point charac- teristics do not make a significant difference. For example, it was reported that a very small difference exists between the spectra characteristics of infrared energy radiation at acu- puncture points and non-acupuncture points10). Since milli- ons of biochemical reactions emit continuous infrared pho- tons, the human body emits a continuous infrared spectrum, which ranges from 1 to 30 mm. Infrared energy transmission is also closely associated with the energy channel11). Thus, the validity of significant therapeutic points remains contro- versial. Therefore, it is necessary to approach the new resear- ch method to confirm the difference between acupuncture
points and non-acupuncture points. This study conducted a comparative experiment on body composition at both acu- puncture points and non-acupuncture points upon inducing fatigue. When fatigue occurs, the blood lactate is strongly affected by multiple ionic changes generated across the sar- colemma, transverse(t-) and tubular membranes. Specifically, the blood lactate level is closely related to multiple ionic changes in K+, Na+, Ca2+, Cl-, H+, HCO3-
, Mg2+, H2PO4-
and PCr2-12,13)
. Since body composition factors(intracellular fluid (ICW), extracellular fluid(ECW)), and the cell membrane are also influenced by multiple ionic changes, body composition factors respond to fatigue. Provided that an acupuncture point responds more quickly and dramatically than a non- acupuncture point, a stronger correlation between changes in body composition factors and blood lactate levels should be observed at an acupuncture point than at a non-acu- puncture point. Thus, this study sought to distinguish the differences between acupuncture points and non-acupunc- ture points.
Materials and Methods
1. Body composition detection principles
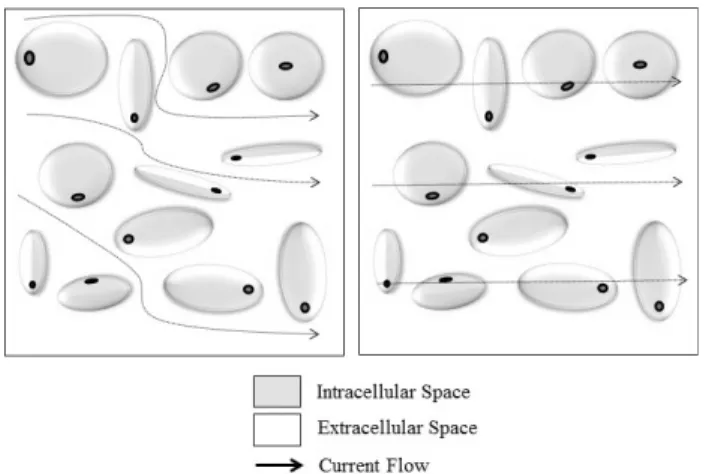
Many methods have been used to assess body composition such as magnetic resonance imaging, computed tomography and isotope dilution analysis. However, these methods are problematic because they are expensive and require skilled professionals to perform14). Therefore, we selected the multi- frequency bioelectrical impedance analysis(MF-BIA) method that penetrates the human body with an alternating current of 800μA, using a frequency band range that varied from 1 kHz to 1 MHz. Fig. 1 illustrates a current flow in tissue de- pending on frequency band. Most electrolytes exist in both the ICW and ECW and are separated by the cell membrane, which functions as an insulator. It has been reported that 800 μA with a 50 kHz frequency can penetrate the cell mem- brane, which acts as a capacitor that divides the ICW and ECW. Frequency bands from 1 kHz to 20 kHz have been used to estimate the ECW because these bands can only pass
Fig. 1. Current flow with frequency band.
Left: low frequency, Right: high frequency.
Fig. 2. Cole-cole electrical model.
lim
→∞
×
×
∞ lim
→∞
lim
→∞
through the ECW and do not penetrate the cell membrane.
It has also been reported that high frequency bands from 100 kHz to 200 kHz allow for the assessment of both the ICW and ECW by disrupting the cell membrane insulation properties. In this study, we used a frequency band of 5 kHz to assess the ECW, 50 kHz to assess the cell membrane, and 200 kHz to assess the amount of ICW and ECW. Fig. 2 shows the equivalent circuit with two resistors, Ri resistance and Re
resistance, which represent the ECW and ICW, respectively, and Cm, which corresponds to the cell membrane15-18).
Equation(1.1) defines the Re resistance, Ri resistance and impedance, Z(jω), which varied according to the frequency (ω). Equations(1.2) and(1.3) were applied to solve the equation for the parallel circuit. The current penetrates the ECW because it does not pass through the cell membrane, which has high impedance Z(jω) and low frequency(ω→0).
The cell membrane changes to low impedance Z(jω) at high frequency(ω→∞); hence, the capacitor loses its insulation property and behaves as a parallel closed loop circuit as shown in equation(1.3), and can be calculated from equa- tion(1.4)19).
Equation(1.1)
Equation(1.2)
Equation(1.3)
Equation(1.4)
2. Participants
Twenty males(ages: 23±5.3 years, height: 174±8.7 cm, weight: 76±10.6 kg) participated in this experiment. The participants completed questionnaires on self-reported mus- culoskeletal conditions. After confirming their medical his- tory, we selected participants to voluntarily participate in the experiment. Each participant gave written informed consent before participation. To reduce the error by experiment environment the following condition reported by previous researchers were taken into consideration and were limited in the participants.
1. Urination within the previous 30 minutes 2. Fluid or food intake within the last 4 hours 3. Exercise within the past 12 hours
4. Alcohol intake within the previous 48 hours 5. Diuretic administration in the past 7 days
3. Experimental procedure for inducing fatigue, EMG analysis and blood lactate measurements The rectus femoris was selected as the target muscle for fatigue generation. We monitored an EMG(electromyogram) in real time in order to generate identical amounts of fatigue.
The surface EMG measurement of the rectus muscle was
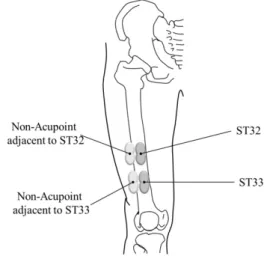
Fig. 3. Measurement sites.
recorded during the knee extension/flexion exercise. Two circular Ag/AgCl surface electrodes(Electrode #272, diameter:
14 mm, interval distance: 18 mm, Noraxon, USA) were attached and a ground electrode was placed on the lateral fibular head. The inter-electrode distance was set at 2.5 cm.
Twenty participants participated in six consecutive testing sessions. In the first session, twenty participants performed the knee extension/flexion exercise using the Biodex System 3(Biodex Medical Inc., Shirley, NY, USA) to familiarize the participants with the movement requirements. The pre- exercise was repeated for 10 sets to measure the maximal voluntary contraction(MVC). In the second session, all parti- cipants performed the knee extension/flexion exercise, whi- ch is a form of a full-range isokinetic exercise, at 115o S-1 and in a range of 30% of the measured MVC. This exercise was repeated 10 times in a set. In order to familiarize the participants with the fatigue generation protocol, there were three sets with 2 minutes of rest between each set. The third session measured the MVC after up to 2 sets with 2 minutes of rest between the sets. The measured MVC was considered to be the muscle condition at pre-exercise. In the fourth se- ssion, all participants repeated the exercise, which included five sets of 10 repetitions of the isokinetic movement at 115o S-1, in a range of 65% of the re-measured MVC, with 2 mi- nutes of rest between sets. Afterwards, all participants spent 20 minutes recovering from fatigue. The MVC was measured after 24 hours. Blood lactate was measured 4 times as foll- ows: first measurement at pre-exercise, second measurement immediately post-exercise, third measurement 20 minutes after exercise, and fourth measurement 24 hours after exer- cise. The EMG signal was filtered with a band-pass filter from 10 Hz to 500 Hz and amplified as a 1000 gain. The EMG signal converted the 12 bit resolution with a sampling fre- quency of 1 kHz. The digitized EMG signal was monitored and stored in the GUI by the Noraxon Myoresearch XP soft- ware(Noraxon, Inc., USA). The EMG power spectrum was analyzed to obtain the median frequency(MF) which was used to find the motor unit activity pattern related to fatigue20,21). Moreover, we analyzed the MVC to identify the peak torque which is commonly used to measure the maximal isometric
force at the monitored joint22).
4. Site selection and body composition measurement We selected two acupuncture points and two non-acu- puncture points. One of the acupuncture points was ST32 and a non-acupuncture point was adjacent to ST32 at a distance of 1.2 cm in the transverse direction as shown in Fig. 3. The other acupuncture point was ST33 and a corre- sponding non-acupuncture point was located adjacent to ST33 at a distance of 1.2 cm in the transverse direction. All measurement sites were located on the rectus femoris. We used two circular silver/silver chloride(Ag/AgCl) surface elec- trodes(Noraxon Inc., US) that had 18 mm of constant distance between the electrodes with a diameter of 14 mm. All measurement sites were placed between electrodes. The body composition was measured immediately before mea- suring blood lactate. One measurement was repeated 10 times.
5. Statistics
All the data was compiled and inputted the SPSS statistical program(IBM ctd, USA) for analysis. The contrast test based on the one-way repeated measures analysis of variance (ANOVA) was conducted with each dependent variable(MF, peak torque) obtained by EMG and blood lactate level to determine the recovery time. We also conducted the contrast
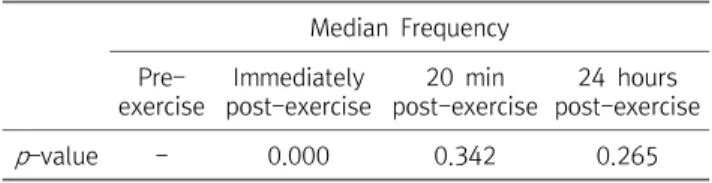
Fig. 4. The MF mean and standard error.
Median Frequency Pre-
exercise
Immediately post-exercise
20 min post-exercise
24 hours post-exercise
p-value - 0.000 0.342 0.265
Table 1. The MF Probability Analysis
Median Frequency Pre-
exercise
Immediately post-exercise
20 min post-exercise
24 hours post-exercise
p-value - 0.000 0.342 0.265
Table 2. The Peak Torque Probability Analysis Fig. 5. The peak torque mean and standard error.
Median Frequency Pre-
exercise
Immediately post-exercise
20 min post-exercise
24 hours post-exercise
p-value - 0.000 0.342 0.265
Table 3. The Blood Lactate Probability Analysis
test based on the one-way repeated measures analysis of variance(ANOVA) to assess the recovery time associated with each dependent variable(Ri, Re, Cm) at all acupuncture points and non-acupuncture points. The significance level of the statistical analysis was set at p<0.05.
Results
1. EMG analysis and blood lactate
As shown in Fig. 4, the MF decreased immediately post- exercise and increased up to 24 hours after exercise. The contrast test based on the one-way repeated measures ANOVA results(Table 1) indicated that the MF immediately post- exercise was significant different in MF in its level at pre-exercise(p=0.000). The MF at 20 minutes post-exercise had largely returned to the MF at pre-exercise(p=0.342).
Moreover, there were no significant difference between the MF at pre-exercise and the MF at 24 hours post-exer- cise(p=0.265).
As shown in Fig. 5, the peak torque decreased after the knee extension/flexion exercise. Table 2 indicated the results
of the contrast test based on the one-way repeated measures ANOVA on peak torque. We observed that the peak torque immediately post-exercise was significantly different(p=0.000).
Although there were no significant difference between the MF at pre-exercise and the MF at 20 minutes post-exercise, the peak torque did not fully recovered during this interval (p=0.002). However, the peak torque at 24 hours post- exercise had increased to the pre-exercise level(p=0.158).
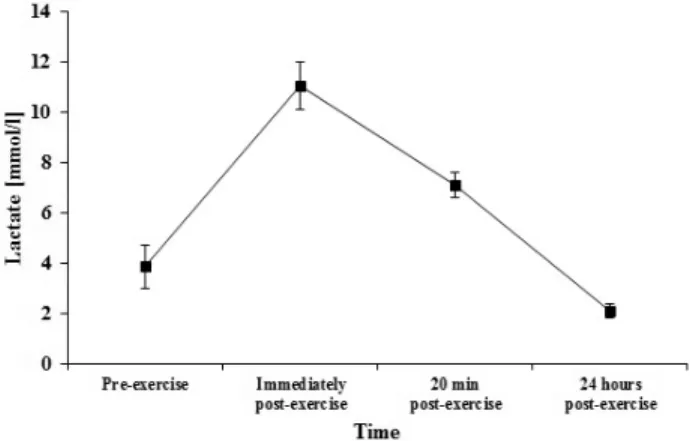
The contrast test results based on the one-way repeated measures ANOVA of the blood lactate(Table 3) indicated that the blood lactate level immediately post-exercise was signi- ficantly different from the blood lactate level pre-exer- cise(p=0.006). The blood lactate level at 20 minutes post- exercise had recovered to some degree, but remained signi- ficantly different(p=0.046). There were no significant diff- erences between the blood lactate level at pre-exercise and
Re resistance
Pre-exercise Immediately post-exercise
20 min post-exercise
24 hours post-exercise
ST32 - 0.000 0.000 0.365
ST33 - 0.000 0.000 0.179
Non-acupuncture point adjacent to ST32 - 0.020 0.002 0.137
Non-acupuncture point adjacent to ST33 - 0.000 0.000 0.000
Table 4. Re Resistance Probability Analysis Fig. 7. The mean Re resistance and standard error.
Fig. 6. The mean blood lactate level and standard error.
at 24 hours post-exercise(p=0.142)(Fig. 6).
2. Body composition analysis
Fig. 7 shows the changing Re resistance patterns on all measurement sites. Table 4 indicated the results of the con- trast test based on the one-way repeated measures ANOVA on Re resistances. The Re resistances on all measurement sites
had increased at 20 minutes post-exercise. There were significant differences between the Re resistances at pre- ex- ercise and immediately post-exercise(p<0.005). Moreover, significant recovery was not observed until 20 minutes post-exercise(p<0.005). Significant recovery was observed after 24 hours(p>0.005) except for a non-acupuncture point adjacent to ST33(p=0.000).
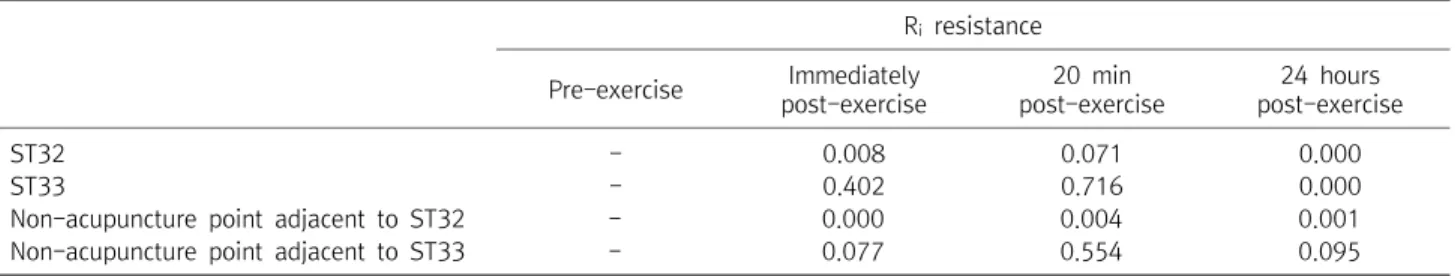
Fig. 8 shows the changing Ri resistance patterns on all mea- surement sites. The Ri resistances of all measurement sites decreased slightly until immediately post-exercise. Hence, the one-way repeated measures ANOVA results(Table 5) indicated that there were significant difference at the ST32 and a non- acupuncture point adjacent to ST32(p<0.05), but there were no significant differences at the other points(p> 0.05) after inducing fatigue. The Ri resistances of all mea- surement sites increased continuously up to 20 minutes post-exercise. There were no significant differences in the Ri
resistance of ST32(p>0.05), but the Ri resistance of a non- acupuncture point adjacent to ST32 was still significantly
Fig. 8. The mean Ri resistance and standard error.
Fig. 9. The mean Cm capacitance and standard error.
Ri resistance
Pre-exercise Immediately post-exercise
20 min post-exercise
24 hours post-exercise
ST32 - 0.008 0.071 0.000
ST33 - 0.402 0.716 0.000
Non-acupuncture point adjacent to ST32 - 0.000 0.004 0.001
Non-acupuncture point adjacent to ST33 - 0.077 0.554 0.095
Table 5. Ri Resistance Probability Analysis
different(p<0.05). The Ri resistances of all measurement sites increased drastically 24 hours post-exercise. Therefore, mea- surement sites were significantly different, with the exception of a non-acupuncture point adjacent to ST33(p>0.05).
Fig. 9 illustrates the change in the Cm capacitance patterns.
Table 6 indicated the results of the contrast test based on
the one-way repeated measures ANOVA on Cm capacitances.
The Cm capacitances of all measurement sites increased up to 20 minutes post-exercise and decreased drastically bet- ween 20 minutes and 24 hours post-exercise. Therefore, the Cm capacitances of all measurement sites were significantly different at up to 20 minutes post-exercise(p<0.05). After 24
Cm capacitance
Pre-exercise Immediately post-exercise
20 min post-exercise
24 hours post-exercise
ST32 - 0.000 0.000 0.708
ST33 - 0.000 0.000 0.000
Non-acupuncture point adjacent to ST32 - 0.017 0.002 0.845
Non-acupuncture point adjacent to ST33 - 0.000 0.000 0.000
Table 6. Cm Capacitance Probability Analysis
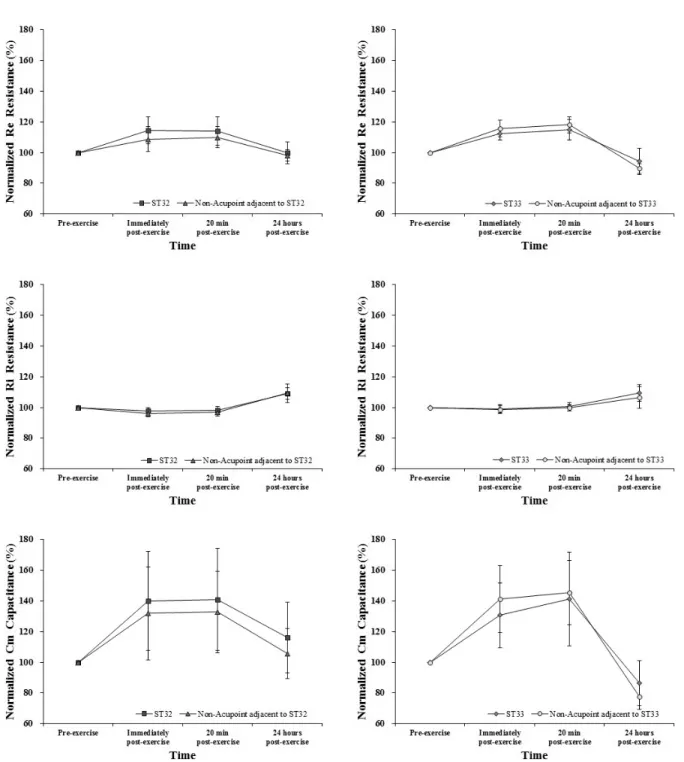
Fig. 10. The comparison analysis of bio-composition factors between an acupuncture point and an adjacent non-acupuncture point.
hours, there were no significant differences between the ST32 and a non-acupuncture point adjacent to ST32(p< 0.05), but the other points were significantly different(p< 0.05).
Fig. 10 illustrates the comparison results between acupun- cture points and adjacent non-acupuncture points. The Re
resistance of ST32 had a stronger degree of response when compared to a non-acupuncture point adjacent to it. Both Re resistance of ST32 and the adjacent non-acupuncture point level at 24 hours post-exercise had recovered to their pre-exercise. However, the Ri resistances showed less response than a non-acupuncture point adjacent to it. Both Ri resistances increased drastically up to 24 hours post- exercise such that the levels were higher than pre-exercise.
After the knee extension/flexion was performed, the Cm
capacitance of ST32 had a stronger response and maintained a slightly larger response than the adjacent non-acupuncture point at up to 20 minutes post-exercise. ST33 and a non- acupuncture point adjacent to ST33 showed opposite results.
After fatigue was generated, the Re resistance of a non- acupuncture point adjacent to ST33 had a stronger response than the ST33. Moreover, the Re resistance of a non- acupuncture point adjacent to ST33 was higher at up to 20 minutes post-exercise. In addition, between 20 minutes post- exercise and 24 hours post-exercise, both Re resistances decreased drastically. A rapid decrease at an adjacent non- acupuncture point instead of ST33 was observed. Both Ri
resistances were similar each other. Both Cm capacitances immediately post-exercise increased drastically and were similar to levels at 20 minutes post-exercise. The Cm capa- citance of a non-acupuncture point adjacent to ST32 was higher slightly. Finally, after 24 hours, both Cm capacitances decreased drastically, but were much lower than the pre- exercise levels.
Discussion
Electrical measurements of human skin are non-invasive and widely used for estimating the difference in charac-
teristics between acupuncture points and non-acupuncture points. Most studies were conducted based on the measure- ments of the direct current(DC) resistance of an acupuncture point. These studies reported the acupuncture points have lower electrical resistance or impedance than nearby surro- unding points23-26). The frequency dependence of the mea- sured impedances was used to confirm the electrical resis- tance and conductance. The frequency dependence of the measured impedances is described by the equivalence circuit of three parameters which is an extension of the Cole Model.
The three parameters consist of a capacitors(C'), a resistor(R), and another capacitor(C). The C' is serially connected with R, which is parallel in connection with C. These studies reported the acupuncture points have lower electrical resi- stance or impedance and high conductance compared to nearby surrounding points27-31). Pre-exercise, the Re resistan- ces of two acupuncture points were higher than the level of two non-acupuncture points. Moreover, Ri resistances of two acupuncture points at pre-exercise were lower than that of two adjacent non-acupuncture points. The results of Re
resistances affirmed the conflicting results of previous studies.
However, the results of Ri resistances of two acupuncture points showed low resistance or impedance and were iden- tical to outcomes of previous studies. Since the Cm capa- citances of two acupuncture points were higher than two adjacent non-acupuncture points, we confirmed that acu- puncture points had higher conductance than nearby surrou- nding points. Previous studies have described one type of resistance, but this paper expressed two resistances as follows: Re resistances and Ri resistance. It is impossible to convert Re resistances and Ri resistances to one resistance due to the varying impedance of cell membranes according to frequency. Hence, it is necessary to compare the total im- pedance of acupuncture points including the impedance of cell membranes with one resistance detected by the fre- quency dependence of the measured impedances.
Exercise-induced ion shifts, physicochemical reactions and metabolic processes bring about ion concentration changes in compartments proximal to the sarcolemma. Concentration changes of multiple ions in these compartments [K+, Na+,
Ca2+, Cl-, H+, HCO3-
, Mg2+, H2PO4-
, PCr2-
, lactate-] have been observed after intense exercise or electrical stimulation32). The elevated K+ gradient in the ECW is the primary mecha- nism for reducing the maximal muscle force and enhancing local blood flow12,33). This K+ gradient is influenced syner- gistically by a decrease in the Na+ gradient in the ECW34,35). The H+ gradient in both the ECW and ICW increases in order to restore the elevated K+ gradient in the ECW36,37). Addition- ally, the ICW Ca2+ gradient in amphibian muscles decreases during fatigue, which impairs muscle excitability38-40). We observed decreases in both the MF and the peak torque and an increase in blood lactate after performing the knee ex- tension/flexion exercise. These responses induced changes in multiple ionic compartments. Therefore, we also observed changes in the Re resistances, Ri resistances, and Cm capaci- tances of all measurement sites. There were no significant differences between the MF at pre-exercise, and the MF 20 minutes post-exercise(p=0.342); additionally, the peak tor- ques 24 hours after exercise increased up to pre-exercise levels(p=0.158). The blood lactate level at 24 hours post- exercise was not significantly different than the pre-exercise blood lactate level(p=0.142). Even though the MF, peak tor- que and blood lactate did recover fully until 24 hours post- exercise, we observed that the body composition factors of some measurement sites were not similar to its pre-exercise level. The Re resistance of all measurement sites(p>0.000), with the exception of a non-acupuncture point adjacent to ST33(p=0.000), were not significantly different after 24 hours.
There were no significant differences between the Ri resis- tances of all measurement sites 20 minutes post-exercise and pre-exercise(p>0.000), except for a non-acupuncture point adjacent to ST32. Due to continuous increase in Ri resistance up to 24 hours post-exercise, it was observed that the Ri
resistances of the all measurement sites, except for a non- acupuncture point adjacent to ST33, were significantly diffe- rent at 24 hours post-exercise compared to pre-exercise(p< 0.000). Moreover, the Cm capacitances at ST32 and a non- acupuncture point adjacent to ST32 were not significantly different between pre-exercise and 24 hours post-exercise.
Since the MF, peak torque and blood lactate level were
completely recovered completely, we determined that multi- ple ionic changes occurred for rapid recovery. Hence, the statistical results of body composition factors at some measu- rement sites indicated significant differences, but body com- position factors of all measurement sites recovered to its level at pre-exercise. By analyzing the body composition factors of all measurement sites according to time, Re resistance of ST32 had a stronger response, but a non-acupuncture point adjacent to ST33 had a larger response up to 20 minutes post exercise. Ri resistances were similar each other. The Cm capa- citance of ST32 had a stronger response after inducing fatigue, but ST33 had a smaller response than a non-acu- puncture point adjacent to it. In TCM, the 14 main meridians are associated with specific organs, and 361 acupuncture points are located on 14 meridians. ST meridians reflect stomach conditions and the LR meridian represents muscle conditions. While two acupuncture points were located on the rectus femoris, these acupuncture points can be greatly influenced by the digestive function of stomach. However, it has been reported that gastric secretion is inhibited and the gastric emptying of liquids is accelerated, delayed or unch- anged during exercise. Moreover, dramatic decreases in inte- stinal blood flow occur when exercising41-44). Hence, it is difficult to consider that the low response of ST33 relative to an adjacent non-acupuncture point was induced by not selecting acupuncture points on the meridian associated with muscle conditions.
Conclusion
The purpose of this study was to distinguish the difference between acupuncture points and non-acupuncture points in order to determine the therapeutic significance and appli- cation of acupuncture points. We generated muscle fatigue in the quadriceps after strenuous knee extension/flexion exercises to induce multiple ionic changes in gradients at acupuncture points or non-acupuncture point locations. EMG analysis and blood lactate were used to observe the state of the rectus femoris muscle. We selected ST32, ST33 and two
non-acupuncture points that were adjacent to each one. We used MF-BIA analysis to detect the following body com- position factors: Ri, Re and Cm. It was observed that body composition factors at all measurement sites changed according to the state of the rectus femoris muscle. We also found that the body composition factors at acupuncture points rather than the adjacent non-acupuncture point in two cases were either larger or smaller responses to the fatigue. Base on results of this study, we confirmed that acupuncture points do not have stronger reaction rates when compared with adjacent non-acupuncture points when inducing fatigue at rectus femoris. However because variouis acpoints and adjacent non-acupuncture points was not measured, it was difficult to conclude that the acupuncture points are not necessarily sensitive to changes of multiple ions. Hence, it is necessary to compare between various acupuncture points and adjacent non-acupuncture points or between an representative acupuncture point and an adja- cent non-acuoint at various muscle.
Acknowledgements
This study was supported by a grant of the Korean Health Technology R&D Project, Ministry of Health & Welfare, Republic of Korea(HI10C2017(A102062)).
References
1. Dang RS, Chen EY, Shen XY, Zhu WJ, Wang PJ, Fei L. The rela- tionship of acupuncture points and connective tissue structure of Lung Meridian of Hand-Taiyin[J]. Shanghai Zhen Jiu Za Zhi.
1997 ; 6(4) : 28-9.
2. Yan X, Zhang X, Liu C, Dang R, Huang Y, He W, et al. Do acu- puncture points exist? Phys Med Biol. 2009 ; 4(9) : N143-50.
3. Langevin HM, Yandow JA. Relationship of acupuncture points and meridians to connective tissue planes. Anat Rec. 2002 ; 269(6) : 257-65.
4. Fei L, Chen HS, Cai DH, Yang SX, Xu JR, Chen EY, Dang RS, Ding
GH, Shen XY, Tang Y. Study expectation and exploration on ba- sic materials and functions of meridians. Sci Forum. 1998 ; 43 : 658-72.
5. Dorsher PT, Fleckenstein J. Trigger Points and Classical Acu- puncture Points: Part 1: Qualitative and Quantitative Anatomic Correspondences. Deutsche Zeitschrift fur Akupunktur. 2008 ; 51(3) : 15-24.
6. Nakatani Y. Skin electric resistance and ryodoraku. J Autonomic Nerve. 1956 ; 6 : 52.
7. Vallette C, Niboyet JE, Imbert M, Dupont M, Roccia L. Trial of acupunctural anesthesia with electric stimulation in obstetrics.
Apropos of our 1st 2 cases. J Gynecol Obstet Biol Reprod. 1973 ; 2(5) : 567-72. [in French]
8. Chen KG. Electrical properties of meridians. Engineering in Medicine and Biology Magazine, IEEE. 1996 ; 15(3) : 58-63.
9. Lu WA, Tsuei JJ, Chen KG. Preferential direction and symmetry of electric conduction of human meridians. Bilaterally sym- metrical acupuncture points provide better conductance for a better "connection". IEEE Eng Med Biol Mag. 1999 ; 18(1) : 76-8.
10. Chen L, Tang J, White PF, Sloninsky A, Wender RH, Naruse R, et al. The effect of location of transcutaneous electrical nerve stimulation on postoperative opioid analgesic requirement:
acupuncture point versus nonacupuncture point stimulation.
Anesth Analg. 1998 ; 87(5) : 1129-34.
11. Ding G, Yao W, Chu J, Shen X, Huang Z, Cheng H, et al. Spectral characteristic of infrared radiations of some acupuncture point and non-acupuncture point areas in human arm surface.
Chinese Science Bulletin. 2001 ; 46(8) : 678-82.
12. Shen X. Physical basis of bio-system’s ultra-weak radiation, Physics in Life Science (eds. Gan ZC, Han NS, Zhang XQ).
Beijing: Peking University Press. 1996 : 49-69. [in Chinese]
13. Bouclin R, Charbonneau E, Renaud JM. Na+ and K+ effect on contractility of frog sartorius muscle: implication for the mech- anism of fatigue. Am J Physiol. ; 268(6 Pt 1) : C1528-36.
14. Broch-Lips M, Overgaard K, Praetorius HA, Nielsen OB. Effects of extracellular HCO3(-) on fatigue, pHi, and K+ efflux in rat skeletal muscles. J Appl Physiol (1985). 2007 ; 103(2) : 494-503.
15. Panotopoulos G, Ruiz JC, Guy-Grand B, Basdevant A. Dual x-ray absorptiometry, bioelectrical impedance, and near infra- red interactance in obese women. Med Sci Sports Exerc. 2001 ;
33(4) : 665-70.
16. Gomez T, Mole PA, Collins A. Dilution of body fluid electrolytes affects bioelectrical impedance measurements. Research in Sports Medicine: An International Journal. 1993 ; 4(4) : 291-8.
17. Deurenberg P, Weststrate JA, Paymans I, van der Kooy K.
Factors affecting bioelectrical impedance measurements in humans. Eur J Clin Nutr. 1988 ; 42(12) : 1017-22.
18. Brown BH, Karatzas T, Nakielny R, Clarke RG. Determination of upper arm muscle and fat areas using electrical impedance measurements. Clin Phys Physiol Meas. 1988 ; 9(1) : 47-55.
19. Heymsfield SB, Gallagher D, Grammes J, Nunez C, Wang Z, Pietrobelli A. Upper extremity skeletal muscle mass: potential of measurement with single frequency bioimpedance analysis.
Appl Radiat Isot. 1998 ; 49(5-6) : 473-4.
20. Goovaerts HG, Faes TJ, de Valk-de Roo GW, ten Bolscher M, Netelenbosch JC, van der Vijgh WJ, et al. Extra-cellular volume estimation by electrical impedance--phase measurement or curve fitting: a comparative study. Physiol Meas. 1998 ; 19(4) : 517-26.
21. De Luca CJ. Myoelectrical manifestations of localized muscular fatigue in humans. Crit Rev Biomed Eng. 1984 ; 11(4) : 251-79.
22. Merletti R, Sabbahi MA, De Luca CJ. Median frequency of the myoelectric signal. Effects of muscle ischemia and cooling. Eur J Appl Physiol Occup Physiol. 1984 ; 52(3) : 258-65.
23. De Luca CJ. The use of surface electromyography in biome- chanics. Journal of applied biomechanics. 1997 ; 13 : 135-63.
24. Nakatani Y. An aspect of the study of Ryodoraku. Clinic of Chinese Medicine 1956 ; 3(7) : 54.
25. Niboyet JEH, Bourdiol RJ, Regard PG. Traite d'acupuncture.
Maissonneuve. 1970.
26. Zhu ZX. Research advances in the electrical specificity of meri- dians and acupuncture points. Am J Acupunct. 1981 ; 9 : 203-16.
27. Voll R. Topographic positions of the measurement points in electroacupunture. Am J Acupunct. 1977 ; 5 : 97.
28. Cole KS. Membranes, ions, and impulses: a chapter of classical biophysics (Vol. 1). Univ of California Press 1968.
29. Woo EJ, Hua P, Webster JG, Tompkins WJ, Pallas-Areny R. Skin impedance measurements using simple and compound electrodes. Med Biol Eng Comput. 1992 ; 30(1) : 97-102.
30. Webster JG. Medical Instrumentation: Application and Design, 2nd ed. Boston, MA: Houghton Mifflin. 1998.
31. Rosell J, Colominas J, Riu P, Pallas-Areny R, Webster JG. Skin impedance from 1 Hz to 1 MHz. IEEE Trans Biomed Eng. 1988 ; 35(8) : 649-51.
32. Yamamoto Y, Nakamura T, Kusuhara T. Consideration of con- ditions required for multi-channel simultaneous bioimpedance measurement. In Instrumentation and Measurement Technolo- gy Conference, 1998. IMTC/98. Conference Proceedings. IEEE.
IEEE 1998 ; 1 : 231-4.
33. Cairns SP, Lindinger MI. Do multiple ionic interactions contrib- ute to skeletal muscle fatigue? J Physiol. 2008 ; 586(Pt 17) : 4039-54.
34. Cairns SP, Hing WA, Slack JR, Mills RG, Loiselle DS. Role of ex- tracellular [Ca2+] in fatigue of isolated mammalian skeletal muscle. J Appl Physiol (1985). 1998 ; 84(4) : 1395-406.
35. Quinonez M, Gonzalez F, Morgado-Valle C, DiFranco M. Effects of membrane depolarization and changes in extracellular [K(+)]
on the Ca (2+) transients of fast skeletal muscle fibers. Implicati- ons for muscle fatigue. J Muscle Res Cell Motil. 2010 ; 31(1) : 13-33.
36. Overgaard K, Nielsen OB, Clausen T. Effects of reduced electro- chemical Na+ gradient on contractility in skeletal muscle: role of the Na+-K+ pump. Pflugers Arch. 1997 ; 434(4) : 457-65.
37. Nielsen OB, de Paoli F, Overgaard K. Protective effects of lactic acid on force production in rat skeletal muscle. J Physiol. 2001 ; 536(Pt 1) : 161-6.
38. Pedersen TH, Nielsen OB, Lamb GD, Stephenson DG. Intracel- lular acidosis enhances the excitability of working muscle.
Science. 2004 ; 305(5687) : 1144-7.
39. Kristensen M, Albertsen J, Rentsch M, Juel C. Lactate and force production in skeletal muscle. J Physiol. 2005 ; 562(Pt 2) : 521-6.
40. Usher-Smith JA, Xu W, Fraser JA, Huang CL. Alterations in cal- cium homeostasis reduce membrane excitability in amphibian skeletal muscle. Pflugers Arch. 2006 ; 453(2) : 211-21.
41. Campbell JMH, Mitchell GO, Powell ATW. The influence of ex- ercise on digestion. Guy's Hosp Rep. 1928 ; 78 : 279-93.
42. Hellebrandt FA, Tepper RH. Studies on the influence of exercise on the digestive work of the stomach II. Its Effect on Emptying
Time. American Journal of Physiology--Legacy Content. 1934 ; 107(2) : 355-63.
43. Fordtran JS, Saltin B. Gastric emptying and intestinal absorption during prolonged severe exercise. J Appl Physiol. 1967 ; 23(3) : 331-5.
44. Read NW, Miles CA, Fisher D, Holgate AM, Kime ND, Mitchell MA, et al. Transit of a meal through the stomach, small intestine, and colon in normal subjects and its role in the pathogenesis of diarrhea. Gastroenterology. 1980 ; 79(6) : 1276-82.
국문초록
목적 : 경혈의 임피던스를 측정하여 경혈의 특이성을 확보하고자 다수 연구가 진행되어왔다. 직류전압과 교류전압을 자극하여 단순히 경혈이 위치한 피부 임피던스를 측정하는 방식이 아닌 Multi-Frequency Body Impedance analysis(MF BIA) 기법을 이용하여 생체 구조 성분(세포 외액, 세포내액의 저항성분 그리고 세포막의 용량성분)을 추출하는 방법을 이용하여 경혈의 특이성을 확보하고자 한다. 인체 내 생체 이온 변 화가 발생하였을 시, 경혈이 비경혈에 발생 전/후 높은 변화율이 관찰될 것이라는 가정을 하에, 생체 이온 변화를 유도하기 위하여 근피로를
유발하였으며, 유도 전/후의 생체 구조 성분을 비교ㆍ분석하였다. 방법: 대퇴직근에 근피로를 유도하기 위하여 건강한 대학생에게 Knee
extension/flexion의 등속도 운동을 통하였다. 생체 이온 변화를 확인하기 위하여 젖산을 측정하였으며, 피험자마다 동일한 근피로를 유발하 기 위하여 EMG(electromyogram) 분석을 통하여 peak torque와 median frequency를 분석하였다. 근피로 유발 24시간 이후까지 젖산과 peak torque와 median frequency을 측정하였으며, 각 단계마다 복토(ST32), 음시(ST33) 과 인접한 비경혈 2개에 대하여 생체 구조 성분 또한 측정하였다. 결과 : 젖산과 peak torque와 median frequency은 24시간 이후 근피로 유발 전으로 회복되었다. 세포외액 저항성분의 경우 비경혈에 비하여 복토(ST32)에서 생체 이온 변화에 따라 높은 변화율이 관찰되었으나, 음시(ST33) 에서는 비경혈에 비하여 낮은 변화율 이 관찰되었다. 세포내액 저항성분은 경혈과 비경혈 사이 유의한 차이가 관찰되지 않았다. 복토(ST32)에서 세포막의 용량성분이 높은 변화율
이 관찰되었지만, 음시(ST33)와 인접한 비경혈간의 뚜렷한 차이가 확인되지 않았다. 결론 : 생체 이온 변화에 따라 인접한 비경혈과 비교해보
았을 시, 경혈에서의 상대적으로 높고 낮은 혹은 유사한 변화율이 관찰되었다. 따라서 경혈의 특이성을 확보하지 못하였으며, 생체 구조 성분 추출을 통하여 세포 이온 변화에 따른 경혈의 특이성을 확보하기에는 한계점을 가지고 있다고 결론을 내렸다.