1/16 https://jkms.org
ABSTRACT
Background: Usually, high-flow nasal cannula (HFNC) therapy is indicated for de novo acute
hypoxemic respiratory failure (AHRF). Although only a few researches have examined the effectiveness of HFNC therapy for respiratory failure with hypercapnia, this therapy is often performed under such conditions for various reasons. We investigated the effectiveness of HFNC therapy for AHRF patients with hypercapnia compared to those without hypercapnia.
Methods: All consecutive patients receiving HFNC therapy between January 2012 and
June 2018 at a university hospital were enrolled and classified into nonhypercapnic and hypercapnic groups. We compared the outcomes of both groups and adjusted the outcomes with propensity score matching.
Results: A total of 862 patients were enrolled, of which 202 were included in the
hypercapnic group. HFNC weaning success rates were higher, and intensive care unit (ICU) and hospital mortality was lower in the hypercapnic group than in the nonhypercapnic group (all P < 0.05). However, no statistical differences in HFNC weaning success (adjusted P = 0.623, matched P = 0.593), ICU mortality (adjusted P = 0.463, matched P = 0.195), and hospital mortality (adjusted P = 0.602, matched P = 0.579) were noted from the propensity- adjusted and propensity-matched analyses. Additionally, in the propensity score-matched subgroup analysis (according to chronic lung diseases and causes of HFNC application), there was also no significant difference in outcomes between the two groups.
Conclusion: In AHRF with underlying conditions, HFNC therapy might be helpful for
patients with hypercapnia. Large prospective and randomized controlled trials are required for firm conclusions.
Keywords: Oxygen Inhalation Therapy; Respiratory Insufficiency; Noninvasive Ventilation;
Hypercapnia; Propensity Score
Original Article
Received: Oct 15, 2019 Accepted: Jan 20, 2020 Address for Correspondence:
Byung Ju Kang, MD, PhD
Department of Internal Medicine, Ulsan University Hospital, University of Ulsan College of Medicine, 877 Bangeojinsunhwando-ro, Dong-gu, Ulsan 44033, Republic of Korea.
E-mail: [email protected]
© 2020 The Korean Academy of Medical Sciences.
This is an Open Access article distributed under the terms of the Creative Commons Attribution Non-Commercial License (https://
creativecommons.org/licenses/by-nc/4.0/) which permits unrestricted non-commercial use, distribution, and reproduction in any medium, provided the original work is properly cited.
ORCID iDs SooHyun Bae
https://orcid.org/0000-0003-3589-0333 Minkyu Han
https://orcid.org/0000-0002-5639-3494 Changyoung Kim
https://orcid.org/0000-0002-6171-5056 Hyeji Lee
https://orcid.org/0000-0002-6584-1471 Jong-Joon Ahn
https://orcid.org/0000-0002-1395-0801 Jin Hyoung Kim
https://orcid.org/0000-0002-2229-2388 Byung Ju Kang
https://orcid.org/0000-0002-1396-7398
SooHyun Bae ,
1Minkyu Han ,
2Changyoung Kim ,
3Hyeji Lee ,
4Jong-Joon Ahn ,
5Jin Hyoung Kim ,
1and Byung Ju Kang
51Department of Internal Medicine, Ulsan University Hospital, Ulsan, Korea
2Department of Clinical Epidemiology and Biostatistics, Asan Medical Center, Seoul, Korea
3Medical Information Center of Ulsan University Hospital, Ulsan, Korea
4Department of Emergency Medicine, Ulsan University Hospital, Ulsan, Korea
5Department of Internal Medicine, Ulsan University Hospital, University of Ulsan College of Medicine, Ulsan, Korea
High-Flow Nasal Cannula Oxygen
Therapy Can Be Effective for Patients in Acute Hypoxemic Respiratory Failure with Hypercapnia: a Retrospective,
Propensity Score-Matched Cohort Study
Respiratory Diseases
Disclosure
The authors have no potential conflicts of interest to disclose.
Author Contributions
Conceptualization: Kang BJ, Ahn J. Data curation: Bae SH, Kim C, Lee H, Kim JH.
Formal analysis: Han M, Kang BJ. Investigation:
Kim JH, Lee H. Methodology: Kim C, Ahn J. Writing - original draft: Bae SH. Writing - review & editing: Han M, Kim C, Lee H, Ahn J, Kim JH, Kang BJ.
INTRODUCTION
Oxygen administration is an essential supportive treatment for maintaining proper tissue oxygenation and alleviating breathlessness in patients with respiratory failure (RF). However, the choice of an appropriate form of oxygen therapy is unclear. The high-flow nasal cannula (HFNC) is a high-flow oxygen supply device that is increasingly used in the treatment of RF in intensive care unit (ICU) patients.
1HFNC therapy is usually used to treat de novo acute hypoxemic respiratory failure (AHRF) without hypercapnia and reduces the need for tracheal intubation compared to conventional oxygen therapies.
2,3In addition, HFNC therapy is also helpful for post extubation respiratory failure and invasive airway procedure such as intubation and bronchoscopy.
4-6In some patients with chronic lung disease (CLD), high-flow oxygen supply can aggravate hypercapnia,
7,8and noninvasive ventilation (NIV) is strongly recommended in patients with hypercapnic RF
9; therefore, meticulous care is required in such cases when using an HFNC.
However, in clinical practice, physicians have been using HFNC therapy frequently not only in patients with de novo AHRF but also in patients with CLD. Several studies have reported that HFNC therapy might also be helpful in patients with underlying CLD,
10-13while others reported no significant increase in carbon dioxide (CO
2) levels and progression to NIV or mechanical ventilation in patients with hypercapnia compared to those without hypercapnia after HFNC therapy.
14-16We compared the effectiveness of HFNC therapy for patients with or without hypercapnia in AHRF using a risk stratification model that adjusts for potential differences between the two groups.
The primary outcome was the HFNC weaning success rate, and the secondary outcomes were ICU mortality, hospital mortality, length of ICU stay, length of hospital stay, and complications during ICU stay. We also compared vital signs, pH and partial pressure of CO
2(PCO
2) changes between the two groups to evaluate the short-term effects after HFNC application.
METHODS
Study design and subjects
We performed a retrospective observational study of critically ill patients older than 18 years who received HFNC therapy for a hypoxemic respiratory problem (ratio of partial pressure arterial oxygen [PO
2] and fraction of inspired oxygen [FiO
2] ≤ 200 mmHg) at the ICU of Ulsan University Hospital, Korea, between January 2012 and June 2018. Using the PCO
2in the arterial blood gas analysis (ABGA) just before HFNC therapy, we classified the study patients into nonhypercapnic and hypercapnic groups. We compared the outcomes of both groups and adjusted our model using propensity score analysis. Additionally, we performed further analyses of the outcomes in selected subgroups: patients without CLD, patients with CLD, patients who received HFNC therapy after extubation, and patients who received HFNC therapy for causes other than extubation.
HFNC device application
All study patients were treated with high-flow oxygen using an HFNC (Optiflow™ or AIRVO™
2; Fisher and Paykel Healthcare, Auckland, New Zealand). Each patient was kept under close
observation in the ICU and was continuously monitored until their conditions stabilized. We
routinely determined HFNC application based on the attending physician’s assessment and
consulted with the respiratory medicine specialists or critical care intensivists if necessary.
Definitions
We defined “hypercapnia” as PCO
2≥ 45 mmHg based on pre-HFNC ABGA. “HFNC weaning”
was defined as spontaneous breathing with an oxygen flow ≤ 6 L/min via a nasal cannula for
> 48 hours after stopping HFNC therapy. “Use of immunosuppressive agents” was defined as treatment with steroids, immunosuppressive medications, and/or chemotherapeutic agents within 6 months of HFNC therapy. “After extubation” was defined as a state of HFNC application within 6 hours after extubation. Acute physiology and chronic health evaluation (APACHE) II and sequential organ failure assessment (SOFA) scores were calculated using the worst variable within 24 hours of HFNC application. The study participants were classified into four groups using the modified classification criteria according to the causes of RF necessitating the use of HFNC
17: de novo acute RF, acute-on-CLD, septic shock for reasons other than respiratory infection, pulmonary edema, or after extubation. In cases of more than one cause of HFNC therapy in a patient, we included the major cause for HFNC indication. We assessed the short-term effectiveness of HFNC therapy by checking vital signs, pH and PCO
2values immediately before and after HFNC application within 2 hours.
Data collection
Clinical and laboratory findings were obtained from the clinical data warehouse appliance (uICE, Ulsan University Hospital Information of Clinical Ecosystem) in connection with the electronic medical records at the Ulsan University Hospital. One critical care intensivist (also specializing in respiratory medicine) reviewed all the patient records collected from the uICE and checked any faults by identifying the patient records directly.
Statistical analysis
The data are reported as means ± standard deviation, medians (interquartile range) or numbers (percentages). To investigate comparisons between nonhypercapnic and hypercapnic groups, the independent t-test was performed for continuous variables and the χ
2test was used for categorical variables.
In our study, patients were not randomly assigned to the nonhypercapnic and hypercapnic groups. To reduce the effect of selection bias based on hypercapnia and a potential confounding factor in the study, we performed careful adjustment for differences in baseline characteristics except ABGA using a propensity score analysis.
18Propensity scores were estimated by multiple logistic regression analysis, and all covariables previously described in Tables 1 except ABGA were included in the final model. To check multicollinearity, we also calculated the variance inflation factor using multiple linear regression analysis (Supplementary Table 1). The discrimination and calibration of the model were assessed by c-statistics (c = 0.701) and Hosmer-Lemeshow statistics (χ
2= 5.991, df = 8, P = 0.648), respectively. Additionally, we compared the standardized mean difference in both groups before and after propensity score matching. We also performed multiple logistic regression and multiple linear regression analyses to estimate the propensity scores and evaluate the variance inflation factors in each subgroup (Supplementary Tables 2–5).
To compare outcomes between nonhypercapnic and hypercapnic groups, we performed a logistic regression analysis (HFNC weaning, ICU mortality, and hospital mortality) and a Cox proportional regression analysis (90-day mortality). To achieve the propensity score-adjusted outcome, the individual propensity score was incorporated into each outcome model as a covariable. We also performed propensity score matching. After we had completed all of the propensity score matches, we compared the baseline covariables between the two intervention groups using the paired t-test for continuous variables and the McNemar test
3/16 https://jkms.org https://doi.org/10.3346/jkms.2020.35.e67
or marginal homogeneity test for categorical variables. For a logit link that accounted for the clustering of propensity score-matched pairs, the risks of clinical end points were analyzed using a generalized estimating equation logistic regression model (HFNC weaning, ICU mortality, and hospital mortality). Cox proportional regression analysis (90-day mortality) that stratified the matched pairs was also performed for each of the two matched samples.
To compare the vital signs, pH and PCO
2changes before and after HFNC application between nonhypercapnic and hypercapnic groups, we conducted generalized estimating equations
Table 1. Baseline characteristics in study patients who received HFNC therapyBaseline characteristics Nonhypercapnic group
(n = 660) Hypercapnic group
(n = 202) Standardized mean
difference P-valuea
Age, yr 66.1 ± 13.9 65.6 ± 14.6 0.0310 0.700
Gender, men 450/660 (68.2) 145/202 (71.8) 0.0946 0.333
Body mass index, kg/m2 23.8 ± 4.4 (n = 652) 23.9 ± 4.9 0.0162 0.841
Smoker 402/660 (60.9) 128/201 (63.7) 0.0651 0.479
Underlying diseases
Diabetes mellitus 256/660 (38.8) 76/202 (37.6) 0.0272 0.766
Hypertension 373/660 (56.5) 105/202 (52.0) 0.1008 0.256
Solid malignancies 182/660 (27.6) 84/202 (41.6) 0.3450 < 0.001b
Hematologic malignancies 35/660 (5.3) 4/202 (2.0) 0.5621 0.047b
Heart failure 105/660 (15.9) 30/202 (14.9) 0.0448 0.717
Ischemic heart disease 86/660 (13.0) 23/202 (11.4) 0.0847 0.538
Chronic kidney disease/dialysis 57/660 (8.6) 12/202 (5.9) 0.2223 0.217
Liver cirrhosis 49/660 (7.4) 17/202 (8.4) 0.0751 0.643
Use of immunosuppressive agents 146/660 (22.1) 49/202 (24.3) 0.0662 0.525
Underlying chronic lung diseases
Asthma 19/660 (2.9) 10/202 (5.0) 0.3108 0.153
Chronic obstructive pulmonary disease 135/660 (20.5) 55/202 (27.2) 0.2068 0.042b
Pulmonary tuberculosis history 84/660 (12.7) 30/202 (14.9) 0.0987 0.435
Bronchiectasis 78/660 (11.8) 48/202 (23.8) 0.4653 < 0.001b
Lung cancer 47/660 (7.1) 43/202 (21.3) 0.6950 < 0.001b
Interstitial lung disease 23/660 (3.5) 9/202 (4.5) 0.1410 0.523
ICU type, medical ICU 387/660 (58.6) 91/202 (45.0) 0.3019 0.001b
HFNC initial setting
FiO2, % 54.9 ± 14.4 51.7 ± 12.8 0.2271 < 0.001b
Flow, L/min 43.0 ± 8.4 41.9 ± 9.0 0.1291 0.110
PO2/FiO2 before HFNC application, mmHg 124.5 ± 39.2 135.7 ± 38.8 0.2857 < 0.001b
APACHE II score 20.9 ± 7.3 18.8 ± 7.9 0.2785 0.001b
SOFA score 8.2 ± 3.6 7.3 ± 3.5 0.2527 0.002b
Time differences between ABGA and HFNC application, min 42.0 (13.0–115) 23.5 (6.8–76.0) 0.0616 0.004b
Causes of HFNC application 0.4669 < 0.001b
De novo acute respiratory failure 168/660 (25.5) 28/202 (13.9)
Acute-on-chronic lung disease 143/660 (21.7) 32/202 (15.8)
Septic shock for reasons other than respiratory infection 52/660 (7.9) 8/202 (4.0)
Pulmonary edema 109/660 (16.5) 29/202 (14.4)
After extubation 188/660 (28.5) 105/202 (52.0)
ABGA results before HFNC application
pH 7.44 ± 0.07 7.35 ± 0.09 - < 0.001b
PCO2, mmHg 35.2 ± 5.6 52.1 ± 8.5 - < 0.001b
PO2, mmHg 67.1 ± 17.5 71.3 ± 18.7 - 0.003b
HCO3, mEq/L 24.1 ± 5.6 29.0 ± 5.5 - < 0.001b
SpO2, % 91.5 ± 6.7 90.7 ± 7.8 - 0.182
Lactate, mmol/L 1.6 (1.0–2.6) (n = 635) 1.5 (0.9–2.5) (n = 196) - 0.115
Data are presented as mean ± standard deviation or median (interquartile range) or number (%).
HFNC = high-flow nasal cannula, ICU = intensive care unit, FiO2 = fraction of inspired oxygen, PO2 = partial pressure of carbon dioxide, APACHE = acute physiology and chronic health evaluation, SOFA = sequential organ failure assessment, ABGA = arterial blood gas analysis, PCO2 = partial pressure of carbon dioxide, HCO3 = bicarbonate, SpO2 = oxygen saturation.
aStatistical comparisons of the data were performed by using the χ2 test for categorical variables and the independent t-test for continuous variables;
bStatistically significant P values.
using linear regression to account for the clustering nature of matched pairs. In addition, survival curves for two groups were analyzed using the Kaplan-Meier method and compared by log rank test. All analyses were performed using the Statistical Package for the Social Sciences (SPSS) Version 24.0 (IBM Corporation, Armonk, New York, USA), and differences with a P value < 0.05 was considered statistically significant.
Ethics statement
The present study was approved by the Institutional Review Board of Ulsan University Hospital (No.
2018-11-001), and the informed consent was waived because of the retrospective design of the study.
RESULTS
During the study period, there were 18,635 ICU admitted patients at Ulsan University Hospital. We excluded 16,868 patients who had not received HFNC therapy or were under 18 years of age. After the review of electronic medical records, we further excluded 905 patients who were not suitable for the evaluation of the effectiveness of HFNC therapy. Subsequently, the patients were classified into a nonhypercapnic group (n = 660) and a hypercapnic group (n = 202) based on their PCO
2values (Fig. 1).
5/16 https://jkms.org https://doi.org/10.3346/jkms.2020.35.e67
Retrospective electronic search of patients treated at the ICU of Ulsan University Hospital in Korea between January 2012 and June 2018 (n = 18,635)
- Not applied HFNC (n = 16,097) - Under 18 years of age (n = 771)
- Medical records error (n = 25)
- HFNC applied through T-cannula (n = 41)
- Transfer to other hospitals before outcome evaluation (n = 16) - Intubation because of surgery to manage the underlying disease (n = 23) - Not discharged from hospital (n = 3)
- HFNC application time < 1 hour (n = 58)
- Concomitant use of non-invasive ventilation (n = 83)
- No arterial blood gas result within 6 hours before HFNC application (n = 153) - The ratio of the partial pressure of oxygen in arterial blood to the inspired oxygen fraction more than 200 (n = 503)
Patients older than 18 years who received HFNC therapy because of hypoxemic respiratory failure at the ICU (n = 1,767)
Patients with PCO2 level below 45 mmHg before
HFNC application (n = 660), [Nonhypercapnic group] Patients with PCO2 level more than 45 mmHg before HFNC application (n = 202), [Hypercapnic group]
Aggravation &
intubation (n = 239) Aggravation & do-not intubation order (n = 32) HFNC weaning
success (n = 389) HFNC weaning
failure (n = 271) HFNC weaning
success (n = 145) HFNC weaning failure (n = 57)
Aggravation &
intubation (n = 46) Aggravation & do-not intubation order (n = 11) Fig. 1. Distribution of the study patients according to the presence of hypercapnia before high-flow nasal cannula.
ICU = intensive care unit, HFNC = high-flow nasal cannula, PCO2 = partial pressure of carbon dioxide.
Patient characteristics
The baseline characteristics of the study population are presented in Table 1. There were more solid malignancies and CLDs (chronic obstructive pulmonary disease [COPD],
bronchiectasis, and lung cancer) in the hypercapnic group than in the nonhypercapnic group.
The nonhypercapnic group also had a significantly higher oxygen requirements (FiO
2and PO
2/FiO
2), and severity indexes (APACHE II and SOFA scores) than the hypercapnic group.
The most common cause of HFNC application was “after extubation” in both groups. In the ABGA results, the hypercapnic group had lower pH and higher PCO
2, PO
2, and bicarbonate (HCO
3) than the nonhypercapnic group.
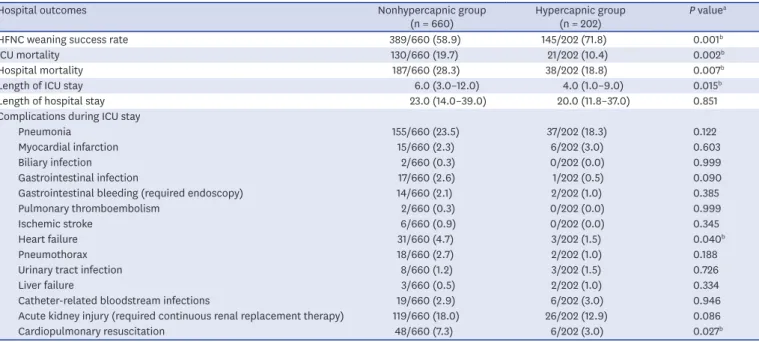
Hospital outcomes
The hospital outcomes of the hypercapnic group were mostly better than those of the nonhypercapnic group (Table 2). The hypercapnic group was significantly more likely to have better HFNC weaning success, lower ICU mortality, lower hospital mortality and a shorter length of ICU stay than the nonhypercapnic group. During the ICU stay, there were also fewer complications, such as heart failure and cardiopulmonary resuscitation in the hypercapnic group.
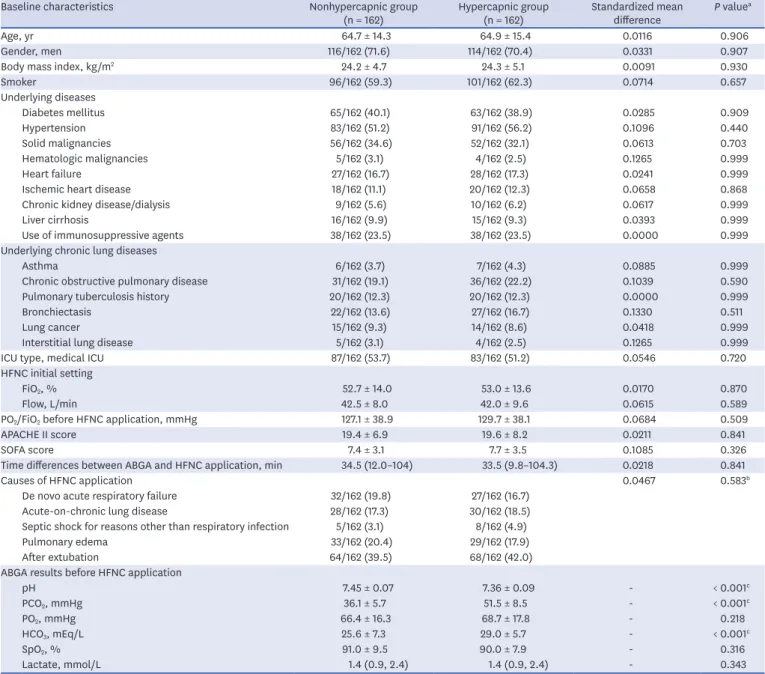
Propensity score-adjusted and score-matched outcomes
After propensity score matching, we selected 162 pairs of patients with similar baseline characteristics except pre-HFNC ABGA. From the ABGA results, the hypercapnic group had a lower pH and higher PCO
2and HCO
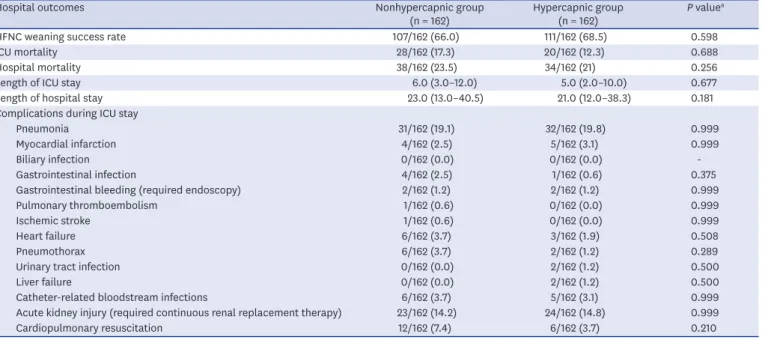
3than the nonhypercapnic group (Table 3). Unlike the results before the propensity score matching, there were no significant differences between both groups in terms of hospital outcomes and complications during ICU stay (Table 4). When we performed a propensity score-adjusted and score-matched analysis, no statistically significant differences were found in HFNC weaning success (adjusted P = 0.623, matched P = 0.593),
Table 2. Hospital outcomes in study patients who received HFNC therapy
Hospital outcomes Nonhypercapnic group
(n = 660) Hypercapnic group
(n = 202) P valuea
HFNC weaning success rate 389/660 (58.9) 145/202 (71.8) 0.001b
ICU mortality 130/660 (19.7) 21/202 (10.4) 0.002b
Hospital mortality 187/660 (28.3) 38/202 (18.8) 0.007b
Length of ICU stay 6.0 (3.0–12.0) 4.0 (1.0–9.0) 0.015b
Length of hospital stay 23.0 (14.0–39.0) 20.0 (11.8–37.0) 0.851
Complications during ICU stay
Pneumonia 155/660 (23.5) 37/202 (18.3) 0.122
Myocardial infarction 15/660 (2.3) 6/202 (3.0) 0.603
Biliary infection 2/660 (0.3) 0/202 (0.0) 0.999
Gastrointestinal infection 17/660 (2.6) 1/202 (0.5) 0.090
Gastrointestinal bleeding (required endoscopy) 14/660 (2.1) 2/202 (1.0) 0.385
Pulmonary thromboembolism 2/660 (0.3) 0/202 (0.0) 0.999
Ischemic stroke 6/660 (0.9) 0/202 (0.0) 0.345
Heart failure 31/660 (4.7) 3/202 (1.5) 0.040b
Pneumothorax 18/660 (2.7) 2/202 (1.0) 0.188
Urinary tract infection 8/660 (1.2) 3/202 (1.5) 0.726
Liver failure 3/660 (0.5) 2/202 (1.0) 0.334
Catheter-related bloodstream infections 19/660 (2.9) 6/202 (3.0) 0.946
Acute kidney injury (required continuous renal replacement therapy) 119/660 (18.0) 26/202 (12.9) 0.086
Cardiopulmonary resuscitation 48/660 (7.3) 6/202 (3.0) 0.027b
Data are presented as mean ± standard deviation or median (interquartile range) or number (%).
HFNC = high-flow nasal cannula, ICU = intensive care unit.
aStatistical comparisons of the data were performed by using the χ2 test for categorical variables and the independent t-test for continuous variables;
bStatistically significant P values.
ICU mortality (adjusted P = 0.463, matched P = 0.195), hospital mortality (adjusted P = 0.602, matched P = 0.579), and 90-day mortality (adjusted P = 0.758, matched P = 0.808) (Table 5).
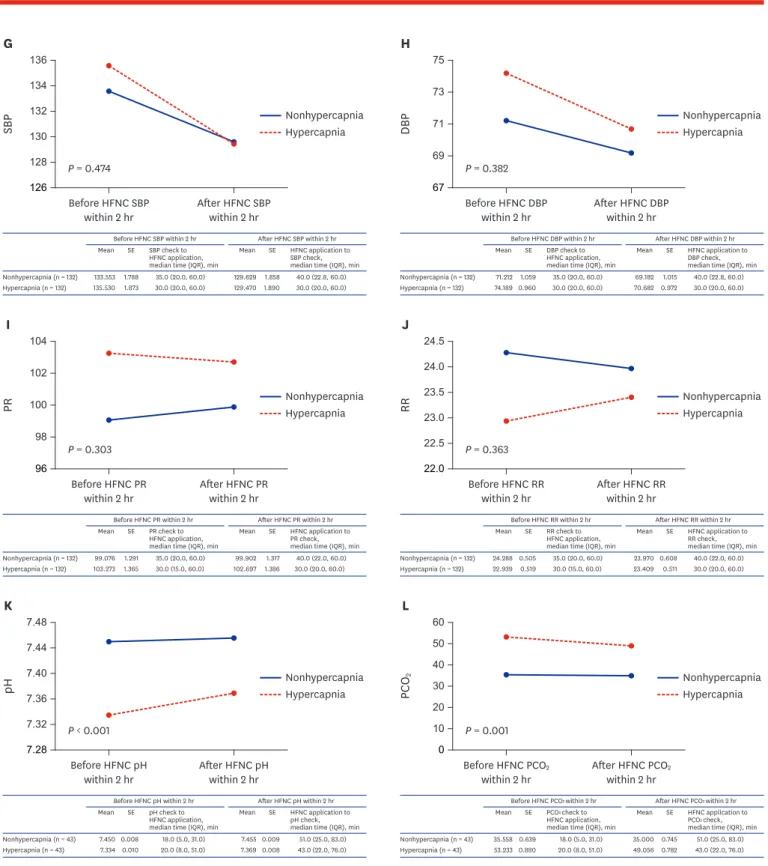
Fig. 2 presented the short-term effectiveness of HFNC therapy by using HFNC application
immediately before and after vital signs, pH and PCO
2values in before and after propensity score matching cohorts. There were no interactions associated with vital sign changes according to HFNC therapy between nonhypercapnic and hypercapnic groups in after propensity score matching cohort. However, there were interactions associated with pH
7/16 https://jkms.org https://doi.org/10.3346/jkms.2020.35.e67
Table 3. Baseline characteristics in study patients who received HFNC therapy after propensity matching
Baseline characteristics Nonhypercapnic group
(n = 162) Hypercapnic group
(n = 162) Standardized mean
difference P valuea
Age, yr 64.7 ± 14.3 64.9 ± 15.4 0.0116 0.906
Gender, men 116/162 (71.6) 114/162 (70.4) 0.0331 0.907
Body mass index, kg/m2 24.2 ± 4.7 24.3 ± 5.1 0.0091 0.930
Smoker 96/162 (59.3) 101/162 (62.3) 0.0714 0.657
Underlying diseases
Diabetes mellitus 65/162 (40.1) 63/162 (38.9) 0.0285 0.909
Hypertension 83/162 (51.2) 91/162 (56.2) 0.1096 0.440
Solid malignancies 56/162 (34.6) 52/162 (32.1) 0.0613 0.703
Hematologic malignancies 5/162 (3.1) 4/162 (2.5) 0.1265 0.999
Heart failure 27/162 (16.7) 28/162 (17.3) 0.0241 0.999
Ischemic heart disease 18/162 (11.1) 20/162 (12.3) 0.0658 0.868
Chronic kidney disease/dialysis 9/162 (5.6) 10/162 (6.2) 0.0617 0.999
Liver cirrhosis 16/162 (9.9) 15/162 (9.3) 0.0393 0.999
Use of immunosuppressive agents 38/162 (23.5) 38/162 (23.5) 0.0000 0.999
Underlying chronic lung diseases
Asthma 6/162 (3.7) 7/162 (4.3) 0.0885 0.999
Chronic obstructive pulmonary disease 31/162 (19.1) 36/162 (22.2) 0.1039 0.590
Pulmonary tuberculosis history 20/162 (12.3) 20/162 (12.3) 0.0000 0.999
Bronchiectasis 22/162 (13.6) 27/162 (16.7) 0.1330 0.511
Lung cancer 15/162 (9.3) 14/162 (8.6) 0.0418 0.999
Interstitial lung disease 5/162 (3.1) 4/162 (2.5) 0.1265 0.999
ICU type, medical ICU 87/162 (53.7) 83/162 (51.2) 0.0546 0.720
HFNC initial setting
FiO2, % 52.7 ± 14.0 53.0 ± 13.6 0.0170 0.870
Flow, L/min 42.5 ± 8.0 42.0 ± 9.6 0.0615 0.589
PO2/FiO2 before HFNC application, mmHg 127.1 ± 38.9 129.7 ± 38.1 0.0684 0.509
APACHE II score 19.4 ± 6.9 19.6 ± 8.2 0.0211 0.841
SOFA score 7.4 ± 3.1 7.7 ± 3.5 0.1085 0.326
Time differences between ABGA and HFNC application, min 34.5 (12.0–104) 33.5 (9.8–104.3) 0.0218 0.841
Causes of HFNC application 0.0467 0.583b
De novo acute respiratory failure 32/162 (19.8) 27/162 (16.7)
Acute-on-chronic lung disease 28/162 (17.3) 30/162 (18.5)
Septic shock for reasons other than respiratory infection 5/162 (3.1) 8/162 (4.9)
Pulmonary edema 33/162 (20.4) 29/162 (17.9)
After extubation 64/162 (39.5) 68/162 (42.0)
ABGA results before HFNC application
pH 7.45 ± 0.07 7.36 ± 0.09 - < 0.001c
PCO2, mmHg 36.1 ± 5.7 51.5 ± 8.5 - < 0.001c
PO2, mmHg 66.4 ± 16.3 68.7 ± 17.8 - 0.218
HCO3, mEq/L 25.6 ± 7.3 29.0 ± 5.7 - < 0.001c
SpO2, % 91.0 ± 9.5 90.0 ± 7.9 - 0.316
Lactate, mmol/L 1.4 (0.9, 2.4) 1.4 (0.9, 2.4) - 0.343
Data are presented as mean ± standard deviation or median (interquartile range) or number (%).
HFNC = high-flow nasal cannula, ICU = intensive care unit, FiO2 = fraction of inspired oxygen, PO2 = partial pressure of carbon dioxide, APACHE = acute physiology and chronic health evaluation, SOFA = sequential organ failure assessment, ABGA = arterial blood gas analysis, PCO2 = partial pressure of carbon dioxide, HCO3 = bicarbonate, SpO2 = oxygen saturation.
aStatistical comparisons of the data were performed by using the McNemar test for categorical variables and the paired t-test for continuous variables;
bStatistical comparison of the data was performed by using Marginal homogeneity test; cStatistically significant P values.
Table 4. Hospital outcomes in study patients who received HFNC therapy after propensity matching
Hospital outcomes Nonhypercapnic group
(n = 162) Hypercapnic group
(n = 162) P valuea
HFNC weaning success rate 107/162 (66.0) 111/162 (68.5) 0.598
ICU mortality 28/162 (17.3) 20/162 (12.3) 0.688
Hospital mortality 38/162 (23.5) 34/162 (21) 0.256
Length of ICU stay 6.0 (3.0–12.0) 5.0 (2.0–10.0) 0.677
Length of hospital stay 23.0 (13.0–40.5) 21.0 (12.0–38.3) 0.181
Complications during ICU stay
Pneumonia 31/162 (19.1) 32/162 (19.8) 0.999
Myocardial infarction 4/162 (2.5) 5/162 (3.1) 0.999
Biliary infection 0/162 (0.0) 0/162 (0.0) -
Gastrointestinal infection 4/162 (2.5) 1/162 (0.6) 0.375
Gastrointestinal bleeding (required endoscopy) 2/162 (1.2) 2/162 (1.2) 0.999
Pulmonary thromboembolism 1/162 (0.6) 0/162 (0.0) 0.999
Ischemic stroke 1/162 (0.6) 0/162 (0.0) 0.999
Heart failure 6/162 (3.7) 3/162 (1.9) 0.508
Pneumothorax 6/162 (3.7) 2/162 (1.2) 0.289
Urinary tract infection 0/162 (0.0) 2/162 (1.2) 0.500
Liver failure 0/162 (0.0) 2/162 (1.2) 0.500
Catheter-related bloodstream infections 6/162 (3.7) 5/162 (3.1) 0.999
Acute kidney injury (required continuous renal replacement therapy) 23/162 (14.2) 24/162 (14.8) 0.999
Cardiopulmonary resuscitation 12/162 (7.4) 6/162 (3.7) 0.210
Data are presented as mean ± standard deviation or median (interquartile range) or number (%).
HFNC = high-flow nasal cannula, ICU = intensive care unit.
aStatistical comparisons of the data were performed by using the McNemar test for categorical variables and the paired t-test for continuous variables.
Table 5. Analysis of hospital outcomes in the hypercapnic group compared with the nonhypercapnic group (as reference)
Variables Crude Propensity-adjusteda Propensity-matched
Odds ratio (95% CI) P valueb Odds ratio (95% CI) P valueb Odds ratio (95% CI) P valueb All patientsc
HFNC weaning success 1.772 (1.257–2.498) 0.001j 1.099 (0.755–1.601) 0.623 1.119 (0.741–1.688) 0.593
ICU mortality 0.473 (0.290–0.773) 0.003j 0.823 (0.490–1.384) 0.463 0.674 (0.371–1.224) 0.195
Hospital mortality 0.586 (0.396–0.867) 0.007j 0.895 (0.590–1.357) 0.602 0.867 (0.523–1.436) 0.579 90-day mortality 0.645 (0.465–0.897)d 0.009e,j 0.948 (0.675–1.332)d 0.758e 0.943 (0.586–1.517)d 0.808e Patients without chronic lung diseasef
HFNC weaning success 1.342 (0.836–2.154) 0.224 1.004 (0.607–1.662) 0.987 0.813 (0.428–1.545) 0.527
ICU mortality 0.550 (0.264–1.147) 0.111 1.001 (0.459–2.186) 0.997 0.799 (0.332–1.926) 0.617
Hospital mortality 0.553 (0.295–1.037) 0.065 0.863 (0.446–1.670) 0.662 0.917 (0.407–2.066) 0.835
90-day mortality 0.572 (0.327–1.000)d 0.050e 0.832 (0.469–1.473)d 0.527e 0.857 (0.396–1.853)d 0.695e Patients with chronic lung diseaseg
HFNC weaning success 2.591 (1.562–4.297) < 0.001j 1.364 (0.769–2.420) 0.289 1.184 (0.605–2.318) 0.622
ICU mortality 0.353 (0.181–0.687) 0.002j 0.673 (0.322–1.405) 0.292 0.657 (0.279–1.549) 0.337
Hospital mortality 0.474 (0.282–0.796) 0.005j 0.829 (0.461–1.489) 0.530 0.941 (0.475–1.864) 0.862 90-day mortality 0.570 (0.378–0.861)d 0.008e,j 0.936 (0.593–1.476)d 0.776e 0.909 (0.496–1.666)d 0.758e Patients with HFNC application after extubationh
HFNC weaning success 1.593 (0.817–3.105) 0.172 1.175 (0.567–2.439) 0.664 1.218 (0.536–2.768) 0.637
ICU mortality 0.155 (0.020–1.216) 0.076 0.311 (0.037–2.642) 0.285 0.156 (0.018–1.360) 0.093
Hospital mortality 0.398 (0.145–1.088) 0.072 0.452 (0.154–1.328) 0.149 0.329 (0.095–1.139) 0.079
90-day mortality 0.597 (0.267–1.334)d 0.209e 0.631 (0.263–1.513)d 0.302e 0.455 (0.158–1.308)d 0.144e Patients with HFNC application other causes than extubationi
HFNC weaning success 1.235 (0.796–1.916) 0.347 1.137 (0.719–1.799) 0.583 1.044 (0.573–1.900) 0.889
ICU mortality 0.770 (0.452–1.314) 0.339 0.822 (0.472–1.431) 0.488 0.881 (0.410–1.895) 0.746
Hospital mortality 0.950 (0.600–1.507) 0.829 0.982 (0.608–1.586) 0.940 1.279 (0.679–2.408) 0.446
90-day mortality 0.945 (0.659–1.357)d 0.761e 0.976 (0.672–1.416)d 0.898e 1.261 (0.729–2.179)d 0.406e CI = confidence interval, HFNC = high-flow nasal cannula, ICU = intensive care unit.
aThe individual propensity score was integrated into each outcome model as a co-variable; bStatistical comparisons of the data were performed using logistic regression analysis; cOf the 862 patients, 162 pairs were matched; dHazard ratios analyzed by Cox proportional regression model; eStatistical comparisons of the data were performed using Cox proportional regression analysis; fOf the 518 patients, 95 pairs were matched; gOf the 344 patients, 84 pairs were matched; hOf the 293 patients, 78 pairs were matched; iOf the 569 patients, 95 pairs were matched; jStatistically significant P values.
9/16 https://jkms.org https://doi.org/10.3346/jkms.2020.35.e67
120 200
132
124
SBP Nonhypercapnia
Hypercapnia 136
128
P = 0.025 Before HFNC SBP
within 2 hr
A
After HFNC SBP within 2 hr
Nonhypercapnia (n = 596) 129.284 137.194
1.126 2.216
35.0 (20.0, 60.0) 30.0 (15.0, 60.0) Before HFNC SBP within 2 hr Mean SE SBP check to
HFNC application, median time (IQR), min
126.899 130.048
1.105 2.111
40.0 (20.0, 60.0) 30.0 (16.0, 60.0) Mean SE SBP check to
HFNC application, median time (IQR), min After HFNC SBP within 2 hr
Hypercapnia (n = 165)
G
126 136
132
128
SBP Nonhypercapnia
Hypercapnia 134
130
P = 0.474 Before HFNC SBP
within 2 hr After HFNC SBP within 2 hr
Nonhypercapnia (n = 132) 133.553 135.530
1.788 1.873
35.0 (20.0, 60.0) 30.0 (20.0, 60.0) Before HFNC SBP within 2 hr Mean SE SBP check to
HFNC application, median time (IQR), min
129.629 129.470
1.858 1.890
40.0 (22.8, 60.0) 30.0 (20.0, 60.0) Mean SE HFNC application to
SBP check, median time (IQR), min After HFNC SBP within 2 hr
Hypercapnia (n = 132)
67 75
DBP 71 Nonhypercapnia
Hypercapnia 73
69 P = 0.072
Before HFNC DBP within 2 hr
B
After HFNC DBP within 2 hr
Nonhypercapnia (n = 596) 69.918 74.564
0.657 1.214
35.0 (20.0, 60.0) 30.0 (15.0, 60.0) Before HFNC DBP within 2 hr Mean SE DBP check to
HFNC application, median time (IQR), min
68.930 71.461
0.613 1.155
40.0 (20.0, 60.0) 30.0 (16.0, 60.0) Mean SE HFNC application to
DBP check, median time (IQR), min After HFNC DBP within 2 hr
Hypercapnia (n = 165)
H
67 75
DBP 71 Nonhypercapnia
Hypercapnia 73
69 P = 0.382
Before HFNC DBP
within 2 hr After HFNC DBP within 2 hr
Nonhypercapnia (n = 132) 71.212 74.189
1.059 0.960
35.0 (20.0, 60.0) 30.0 (20.0, 60.0) Before HFNC DBP within 2 hr Mean SE DBP check to
HFNC application, median time (IQR), min
69.182 70.682
1.015 0.972
40.0 (22.8, 60.0) 30.0 (20.0, 60.0) Mean SE HFNC application to
DBP check, median time (IQR), min After HFNC DBP within 2 hr
Hypercapnia (n = 132)
100.2 101.8
101.0
PR Nonhypercapnia
Hypercapnia 101.4
100.6
P = 0.887 Before HFNC PR
within 2 hr
C
After HFNC PR within 2 hr
Nonhypercapnia (n = 596) 101.727 101.261
0.855 1.697
31.0 (20.0, 60.0) 30.0 (15.0, 60.0) Before HFNC PR within 2 hr Mean SE PR check to
HFNC application, median time (IQR), min
101.403 100.782
0.868 1.690
40.0 (20.0, 60.0) 30.0 (15.0, 60.0) Mean SE HFNC application to
PR check, median time (IQR), min After HFNC PR within 2 hr
Hypercapnia (n = 165)
I
96 104
PR 100 Nonhypercapnia
Hypercapnia 102
98 P = 0.303
Before HFNC PR
within 2 hr After HFNC PR within 2 hr
Nonhypercapnia (n = 132) 99.076 103.273
1.291 1.365
35.0 (20.0, 60.0) 30.0 (15.0, 60.0) Before HFNC PR within 2 hr Mean SE PR check to
HFNC application, median time (IQR), min
99.902 102.697
1.317 1.386
40.0 (22.0, 60.0) 30.0 (20.0, 60.0) Mean SE HFNC application to
PR check, median time (IQR), min After HFNC PR within 2 hr
Hypercapnia (n = 132)
21 26
24
22
RR Nonhypercapnia
Hypercapnia 25
23
P = 0.017 Before HFNC RR
within 2 hr
D
After HFNC RR within 2 hr
Nonhypercapnia (n = 596) 25.419 22.582
0.340 0.554
31.0 (20.0, 60.0) 30.0 (15.0, 60.0) Before HFNC RR within 2 hr Mean SE RR check to
HFNC application, median time (IQR), min
24.480 23.388
0.335 0.677
40.0 (20.0, 60.0) 30.0 (15.0, 60.0) Mean SE HFNC application to
RR check, median time (IQR), min After HFNC RR within 2 hr
Hypercapnia (n = 165)
J
22.0 24.5
23.5
22.5
RR Nonhypercapnia
Hypercapnia 24.0
23.0
P = 0.363 Before HFNC RR
within 2 hr After HFNC RR within 2 hr
Nonhypercapnia (n = 132) 24.288 22.939
0.505 0.519
35.0 (20.0, 60.0) 30.0 (15.0, 60.0) Before HFNC RR within 2 hr Mean SE RR check to
HFNC application, median time (IQR), min
23.970 23.409
0.608 0.511
40.0 (22.0, 60.0) 30.0 (20.0, 60.0) Mean SE HFNC application to
RR check, median time (IQR), min After HFNC RR within 2 hr
Hypercapnia (n = 132)
7.30 7.46
pH 7.38 Nonhypercapnia
Hypercapnia 7.42
7.34 P < 0.001
Before HFNC pH within 2 hr
E
After HFNC pH within 2 hr
Nonhypercapnia (n = 313) 7.434 7.340
0.004 0.009
25.0 (4.0, 51.0) 19.0 (0.0, 43.0) Before HFNC pH within 2 hr Mean SE pH check to
HFNC application, median time (IQR), min
7.444 7.371
0.004 0.008
45.0 (23.0, 71.0) 39.0 (11.0, 69.0) Mean SE HFNC application to
pH check, median time (IQR), min After HFNC pH within 2 hr
Hypercapnia (n = 119)
K
7.28 7.48
7.40
7.32
pH Nonhypercapnia
Hypercapnia 7.44
7.36
P < 0.001 Before HFNC pH
within 2 hr After HFNC pH within 2 hr
Nonhypercapnia (n = 43) 7.450 7.334
0.008 0.010
18.0 (5.0, 31.0) 20.0 (8.0, 51.0) Before HFNC pH within 2 hr Mean SE pH check to
HFNC application, median time (IQR), min
7.455 7.369
0.009 0.008
51.0 (25.0, 83.0) 43.0 (22.0, 76.0) Mean SE HFNC application to
pH check, median time (IQR), min After HFNC pH within 2 hr
Hypercapnia (n = 43)
0 60 40
PCO2 20 Nonhypercapnia
Hypercapnia 50
30
10 P < 0.001 Before HFNC PCO2
within 2 hr
F
After HFNC PCO2 within 2 hr
Nonhypercapnia (n = 313) 35.297 52.804
0.318 0.657
25.0 (4.0, 51.0) 19.0 (0.0, 43.0) Before HFNC PCO2 within 2 hr Mean SE PCO2 check to
HFNC application, median time (IQR), min
34.512 48.789
0.354 0.728
45.0 (23.0, 71.0) 39.0 (11.0, 69.0) Mean SE HFNC application to
PCO2 check, median time (IQR), min After HFNC PCO2 within 2 hr
Hypercapnia (n = 119)
L
0 60 40
PCO2 20 Nonhypercapnia
Hypercapnia 50
30
10 P = 0.001 Before HFNC PCO2
within 2 hr After HFNC PCO2
within 2 hr
Nonhypercapnia (n = 43) 35.558 53.233
0.639 0.880
18.0 (5.0, 31.0) 20.0 (8.0, 51.0) Before HFNC PCO2 within 2 hr Mean SE PCO2 check to
HFNC application, median time (IQR), min
35.000 49.056
0.745 0.782
51.0 (25.0, 83.0) 43.0 (22.0, 76.0) Mean SE HFNC application to
PCO2 check, median time (IQR), min After HFNC PCO2 within 2 hr
Hypercapnia (n = 43)
Fig. 2. Changes of vital signs and arterial blood gas analysis results between nonhypercapnic and hypercapnic groups after initiation of high-flow nasal cannula therapy. In before propensity score matching cohort: (A) SBP change after HFNC application, (B) DBP change after HFNC application, (C) PR change after HFNC application, (D) RR change after HFNC application, (E) pH change after HFNC application, (F) PCO2 change after HFNC application, And in after propensity score matching cohort: (G) SBP change after HFNC application, (H) DBP change after HFNC application, (I) PR change after HFNC application, (J) RR change after HFNC application, (K) pH change after HFNC application, (L) PCO2 change after HFNC application.
HFNC = high-flow nasal cannula, SBP = systolic blood pressure, SE = standard error, IQR = interquartile range, DBP = diastolic blood pressure, PR = pulse rate, RR =
respiration rate, PCO2 = partial pressure of carbon dioxide. (continued to the next page)
High-Flow Nasal Cannula and Hypercapnia
120 132
124
SBP Nonhypercapnia
Hypercapnia 136
128
P = 0.025 Before HFNC SBP
within 2 hr After HFNC SBP within 2 hr
Nonhypercapnia (n = 596) 129.284 137.194
1.126 2.216
35.0 (20.0, 60.0) 30.0 (15.0, 60.0) Before HFNC SBP within 2 hr Mean SE SBP check to
HFNC application, median time (IQR), min
126.899 130.048
1.105 2.111
40.0 (20.0, 60.0) 30.0 (16.0, 60.0) Mean SE SBP check to
HFNC application, median time (IQR), min After HFNC SBP within 2 hr
Hypercapnia (n = 165)
G
126 136
132
128
SBP Nonhypercapnia
Hypercapnia 134
130
P = 0.474 Before HFNC SBP
within 2 hr After HFNC SBP within 2 hr
Nonhypercapnia (n = 132) 133.553 135.530
1.788 1.873
35.0 (20.0, 60.0) 30.0 (20.0, 60.0) Before HFNC SBP within 2 hr Mean SE SBP check to
HFNC application, median time (IQR), min
129.629 129.470
1.858 1.890
40.0 (22.8, 60.0) 30.0 (20.0, 60.0) Mean SE HFNC application to
SBP check, median time (IQR), min After HFNC SBP within 2 hr
Hypercapnia (n = 132)
67
DBP 71 Nonhypercapnia
Hypercapnia 73
69 P = 0.072
Before HFNC DBP
within 2 hr After HFNC DBP within 2 hr
Nonhypercapnia (n = 596) 69.918 74.564
0.657 1.214
35.0 (20.0, 60.0) 30.0 (15.0, 60.0) Before HFNC DBP within 2 hr Mean SE DBP check to
HFNC application, median time (IQR), min
68.930 71.461
0.613 1.155
40.0 (20.0, 60.0) 30.0 (16.0, 60.0) Mean SE HFNC application to
DBP check, median time (IQR), min After HFNC DBP within 2 hr
Hypercapnia (n = 165)
H
67 75
DBP 71 Nonhypercapnia
Hypercapnia 73
69 P = 0.382
Before HFNC DBP
within 2 hr After HFNC DBP within 2 hr
Nonhypercapnia (n = 132) 71.212 74.189
1.059 0.960
35.0 (20.0, 60.0) 30.0 (20.0, 60.0) Before HFNC DBP within 2 hr Mean SE DBP check to
HFNC application, median time (IQR), min
69.182 70.682
1.015 0.972
40.0 (22.8, 60.0) 30.0 (20.0, 60.0) Mean SE HFNC application to
DBP check, median time (IQR), min After HFNC DBP within 2 hr
Hypercapnia (n = 132)
100.2 101.8
101.0
PR Nonhypercapnia
Hypercapnia 101.4
100.6
P = 0.887 Before HFNC PR
within 2 hr
C
After HFNC PR within 2 hr
Nonhypercapnia (n = 596) 101.727 101.261
0.855 1.697
31.0 (20.0, 60.0) 30.0 (15.0, 60.0) Before HFNC PR within 2 hr Mean SE PR check to
HFNC application, median time (IQR), min
101.403 100.782
0.868 1.690
40.0 (20.0, 60.0) 30.0 (15.0, 60.0) Mean SE HFNC application to
PR check, median time (IQR), min After HFNC PR within 2 hr
Hypercapnia (n = 165)
I
96 104
PR 100 Nonhypercapnia
Hypercapnia 102
98 P = 0.303
Before HFNC PR
within 2 hr After HFNC PR within 2 hr
Nonhypercapnia (n = 132) 99.076 103.273
1.291 1.365
35.0 (20.0, 60.0) 30.0 (15.0, 60.0) Before HFNC PR within 2 hr Mean SE PR check to
HFNC application, median time (IQR), min
99.902 102.697
1.317 1.386
40.0 (22.0, 60.0) 30.0 (20.0, 60.0) Mean SE HFNC application to
PR check, median time (IQR), min After HFNC PR within 2 hr
Hypercapnia (n = 132)
21 26
24
22
RR Nonhypercapnia
Hypercapnia 25
23
P = 0.017 Before HFNC RR
within 2 hr
D
After HFNC RR within 2 hr
Nonhypercapnia (n = 596) 25.419 22.582
0.340 0.554
31.0 (20.0, 60.0) 30.0 (15.0, 60.0) Before HFNC RR within 2 hr Mean SE RR check to
HFNC application, median time (IQR), min
24.480 23.388
0.335 0.677
40.0 (20.0, 60.0) 30.0 (15.0, 60.0) Mean SE HFNC application to
RR check, median time (IQR), min After HFNC RR within 2 hr
Hypercapnia (n = 165)
J
22.0 24.5
23.5
22.5
RR Nonhypercapnia
Hypercapnia 24.0
23.0
P = 0.363 Before HFNC RR
within 2 hr After HFNC RR within 2 hr
Nonhypercapnia (n = 132) 24.288 22.939
0.505 0.519
35.0 (20.0, 60.0) 30.0 (15.0, 60.0) Before HFNC RR within 2 hr Mean SE RR check to
HFNC application, median time (IQR), min
23.970 23.409
0.608 0.511
40.0 (22.0, 60.0) 30.0 (20.0, 60.0) Mean SE HFNC application to
RR check, median time (IQR), min After HFNC RR within 2 hr
Hypercapnia (n = 132)
7.30 7.46
pH 7.38 Nonhypercapnia
Hypercapnia 7.42
7.34 P < 0.001
Before HFNC pH within 2 hr
E
After HFNC pH within 2 hr
Nonhypercapnia (n = 313) 7.434 7.340
0.004 0.009
25.0 (4.0, 51.0) 19.0 (0.0, 43.0) Before HFNC pH within 2 hr Mean SE pH check to
HFNC application, median time (IQR), min
7.444 7.371
0.004 0.008
45.0 (23.0, 71.0) 39.0 (11.0, 69.0) Mean SE HFNC application to
pH check, median time (IQR), min After HFNC pH within 2 hr
Hypercapnia (n = 119)
K
7.28 7.48
7.40
7.32
pH Nonhypercapnia
Hypercapnia 7.44
7.36
P < 0.001 Before HFNC pH
within 2 hr After HFNC pH within 2 hr
Nonhypercapnia (n = 43) 7.450 7.334
0.008 0.010
18.0 (5.0, 31.0) 20.0 (8.0, 51.0) Before HFNC pH within 2 hr Mean SE pH check to
HFNC application, median time (IQR), min
7.455 7.369
0.009 0.008
51.0 (25.0, 83.0) 43.0 (22.0, 76.0) Mean SE HFNC application to
pH check, median time (IQR), min After HFNC pH within 2 hr
Hypercapnia (n = 43)
0 60 40
PCO2 20 Nonhypercapnia
Hypercapnia 50
30
10 P < 0.001 Before HFNC PCO2
within 2 hr
F
After HFNC PCO2
within 2 hr
Nonhypercapnia (n = 313) 35.297 52.804
0.318 0.657
25.0 (4.0, 51.0) 19.0 (0.0, 43.0) Before HFNC PCO2 within 2 hr Mean SE PCO2 check to
HFNC application, median time (IQR), min
34.512 48.789
0.354 0.728
45.0 (23.0, 71.0) 39.0 (11.0, 69.0) Mean SE HFNC application to
PCO2 check, median time (IQR), min After HFNC PCO2 within 2 hr
Hypercapnia (n = 119)
L
0 60 40
PCO2 20 Nonhypercapnia
Hypercapnia 50
30
10 P = 0.001 Before HFNC PCO2
within 2 hr After HFNC PCO2 within 2 hr
Nonhypercapnia (n = 43) 35.558 53.233
0.639 0.880
18.0 (5.0, 31.0) 20.0 (8.0, 51.0) Before HFNC PCO2 within 2 hr Mean SE PCO2 check to
HFNC application, median time (IQR), min
35.000 49.056
0.745 0.782
51.0 (25.0, 83.0) 43.0 (22.0, 76.0) Mean SE HFNC application to
PCO2 check, median time (IQR), min After HFNC PCO2 within 2 hr
Hypercapnia (n = 43)
Fig. 2. (Continued) Changes of vital signs and arterial blood gas analysis results between nonhypercapnic and hypercapnic groups after initiation of high-flow nasal cannula therapy. In before propensity score matching cohort: (A) SBP change after HFNC application, (B) DBP change after HFNC application, (C) PR change after HFNC application, (D) RR change after HFNC application, (E) pH change after HFNC application, (F) PCO2 change after HFNC application, And in after propensity score matching cohort: (G) SBP change after HFNC application, (H) DBP change after HFNC application, (I) PR change after HFNC application, (J) RR change after HFNC application, (K) pH change after HFNC application, (L) PCO2 change after HFNC application.
HFNC = high-flow nasal cannula, SBP = systolic blood pressure, SE = standard error, IQR = interquartile range, DBP = diastolic blood pressure, PR = pulse rate, RR = respiration rate, PCO2 = partial pressure of carbon dioxide.
(before propensity score matching P < 0.001, after propensity score matching P < 0.001) and PCO
2(before propensity score matching P < 0.001, after propensity score matching P = 0.001) values according to HFNC therapy between the two groups. Fig. 3 shows the survival curve of the matched groups stratified by the presence of hypercapnia, and there was no significant difference for the 90-day survival between the two groups (P = 0.468).
Subgroup analysis
We performed subgroup analysis according to the presence of CLD and causes of HFNC application. Although several baseline characteristics of each subgroup were different between the nonhypercapnic and hypercapnic groups, the hypercapnic group had similar or better HFNC weaning success, similar or lower mortality, and similar or fewer complications in all subgroups (Supplementary Tables 6–9). After propensity score matching for each subgroup, there was no significant difference in HFNC weaning success and mortality between the two groups (Supplementary Tables 10–13). When the propensity score-adjusted and score-matched analysis were performed in each subgroup, both groups also did not differ significantly in terms of HFNC weaning success, ICU mortality, hospital mortality and 90-day mortality (Table 5).
DISCUSSION
Our current study findings indicated that the effectiveness of HFNC therapy in AHRF patients with hypercapnia was not inferior to the effectiveness of the therapy in those without hypercapnia under various conditions. In other words, AHRF patients could be treated with HFNC therapy regardless of the presence of hypercapnia before HFNC application.
This finding was in accordance with the results from previous studies that reported the effectiveness of HFNC therapy in patients with acute RF,
14,15,19acute exacerbation of COPD,
20,21and after extubation
4,22when accompanied with hypercapnia. However, these studies involved small sample sizes, and there has been no prospective randomized controlled study for the evaluation of HFNC weaning success and mortality. However, the current study was well constructed and confirmed these results using a cohort of relatively large sample sizes.
11/16 https://jkms.org https://doi.org/10.3346/jkms.2020.35.e67
0.650 30 60 90
1.00
0.90
0.80
0.70
Survival probability
Survival time, day
Nonhypercapnic group Hypercapnic group 0.95
0.85
0.75
Log-rank test P = 0.468
Fig. 3. Kaplan-Meier survival curves stratified by the presence of hypercapnia before high-flow nasal cannula application.
The choice of the appropriate form of oxygen device in AHRF patients with hypercapnia is unclear. Conventional oxygen devices have limited efficacy in RF because of the significant decrease in the delivered FiO
2. Invasive mechanical ventilation is a lifesaving technique, but it is also associated with various complications. NIV is recommended for use only in patients with hypercapnia who have an acidic pH but not in those who do not have an acidic pH.
9Additionally, NIV is not recommended in patients with altered mental states, unstable hemodynamic conditions, or an inability to protect the airway.
23Considering these reasons and our study results, HFNC therapy might overcome the limitations of the other devices and be a good alternative for patients in AHRF with hypercapnia.
Derangements in gas exchange may be developed in patients with CLD and cause hypercapnia.
24These results were consistent with the fact that the hypercapnia group had a greater number of underlying CLDs in our study. The hospital outcomes and complications were worse in the nonhypercapnic group than in the hypercapnic group before propensity matching. This was presumed to be because of the severity of the nonhypercapnic group being higher than that of the hypercapnic group in most of the baseline characteristics except for underlying CLD. There were more solid malignancies in the hypercapnic group. However, considering the number of lung cancer patients, nonlung cancerous solid malignancies were similar between the nonhypercapnic and hypercapnic groups (20.5% vs. 20.3%). Although these differences between both groups were compensated for after propensity matching, the outcomes of the hypercapnic group were not significantly different from those of the nonhypercapnic group in our study. The subgroup results were also similar to these results. Our findings indicate that HFNC therapy might be beneficial for AHRF patients with hypercapnia in various conditions.
Although HFNC therapy is safe and useful in different clinical situations, including RF,
25patients with hypercapnia were mostly excluded in the previous large-scale HFNC studies.
2,26-29Therefore, the efficacy of HFNC in patients with hypercapnia has not been sufficiently evaluated. One study has even asserted that hypercapnia has potentially deleterious effects in patients with CLD.
24Our study findings showed the effectiveness of HFNC therapy in AHRF patients with hypercapnia using AHRF patients without hypercapnia as a control group under various conditions. However, one thing to note is that the effectiveness of HFNC was evaluated in AHRF patients with hypercapnia only and not in patients with hypercapnic RF. Although it was reported that HFNC therapy was used to successfully manage hypercapnic RF,
30special attention in the treatment of hypercapnic RF using HFNC therapy and a large prospective randomized controlled study are required. We hope the findings from our study contribute to establishing an appropriate indication for HFNC therapy.
Our study had several limitations. First, it was a retrospective observational study. However, we used propensity score matching and evaluated the effectiveness of HFNC treatment in AHRF patients with or without hypercapnia in a group of carefully selected patients to identify a possible link between hypercapnia and hospital outcomes. Second, our study was conducted at a single center. Therefore, selection bias cannot be excluded, and the results must be interpreted with caution. Large-scale multicenter and randomized controlled studies are required to obtain more accurate and reliable results. Third, there are possible differences in the actual FiO
2supplied to the patients and the FiO
2setting of the HFNC device. Data, including FiO
2, should be carefully interpreted because the delivered FiO
2cannot be measured.
Because hypercapnia might be associated with poor prognosis in RF, HFNC therapy was used
very cautiously under this condition. Our study findings showed that the effectiveness of
HFNC therapy in AHRF patients with hypercapnia was not significantly different from those without hypercapnia in terms of HFNC weaning success and mortality. HFNC therapy might be effective in AHRF patients with hypercapnia. We believe that our study can contribute to the establishment of appropriate indications for HFNC therapy. Further large-scale, prospective, and randomized controlled trials are warranted.
ACKNOWLEDGMENTS
This work was supported by the Medical Information Center of Ulsan University Hospital in the data extraction.
SUPPLEMENTARY MATERIALS
Supplementary Table 1
Results of multiple logistic regression analysis to estimate the propensity score and multiple linear regression analysis to evaluate the variance inflation factor for baseline characteristics of study patients
Click here to view
Supplementary Table 2
Results of multiple logistic regression analysis to estimate the propensity score and multiple linear regression analysis to evaluate the variance inflation factor for baseline characteristics of patients without chronic lung disease
Click here to view
Supplementary Table 3
Results of multiple logistic regression analysis to estimate the propensity score and multiple linear regression analysis to evaluate the variance inflation factor for baseline characteristics of patients with chronic lung disease
Click here to view
Supplementary Table 4
Results of multiple logistic regression analysis to estimate the propensity score and multiple linear regression analysis to evaluate the variance inflation factor for baseline characteristics of patients with HFNC application after extubation
Click here to view
Supplementary Table 5
Results of multiple logistic regression analysis to estimate the propensity score and multiple linear regression analysis to evaluate the variance inflation factor for baseline characteristics of patients with HFNC application for causes other than extubation
Click here to view
13/16 https://jkms.org https://doi.org/10.3346/jkms.2020.35.e67