Effects of Exercise on the Body Composition and Lipid Profile of Individuals with Obesity: A Systematic
Review and Meta-Analysis
Kyoung-Bae Kim
1, Kijin Kim
2, Changsun Kim
3, Suh-Jung Kang
4, Hyo Jeong Kim
5, Seok Yoon
6, Yun-A Shin
7,*
1
Department of Physical Education, Korea Military Academy, Seoul;
2Department of Physical Education, College of Physical Education, Keimyung University, Daegu;
3
Department of Physical Education, Dongduk Women’s University, Seoul;
4Department of Sports and Health Management, Sangmyung University, Seoul;
5
Department of Sport and Healthy Aging, Korea National Sport University, Seoul, Korea;
6Department of Sport Science, Chowan University, Murfreesboro, NC, USA;
7
Department of Prescription and Rehabilitation of Exercise, College of Sport Science, Dankook University, Cheonan, Korea
Background: Numerous researchers have worked to develop treatments for obesity; however, the prevalence of obesity continues to increase in many countries. Moreover, the effects of physical activity and exercise on obe- sity remain unclear. Therefore, it is necessary to perform a systematic review and meta-analysis to assess the re- lationship between exercise and obesity using mediator variables such as the mode of exercise.
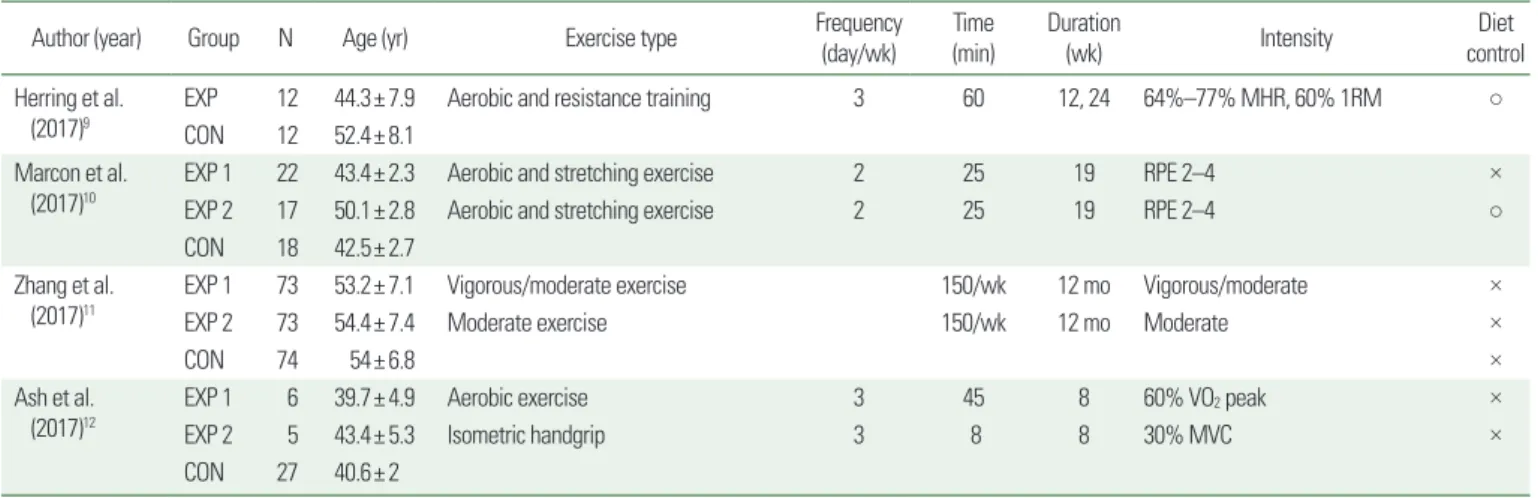
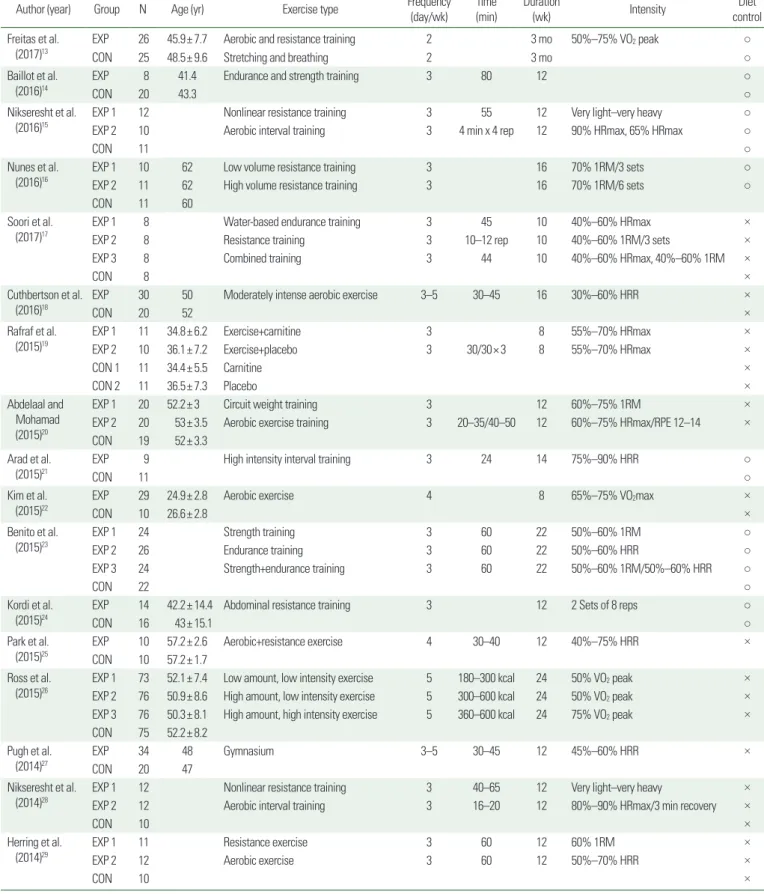
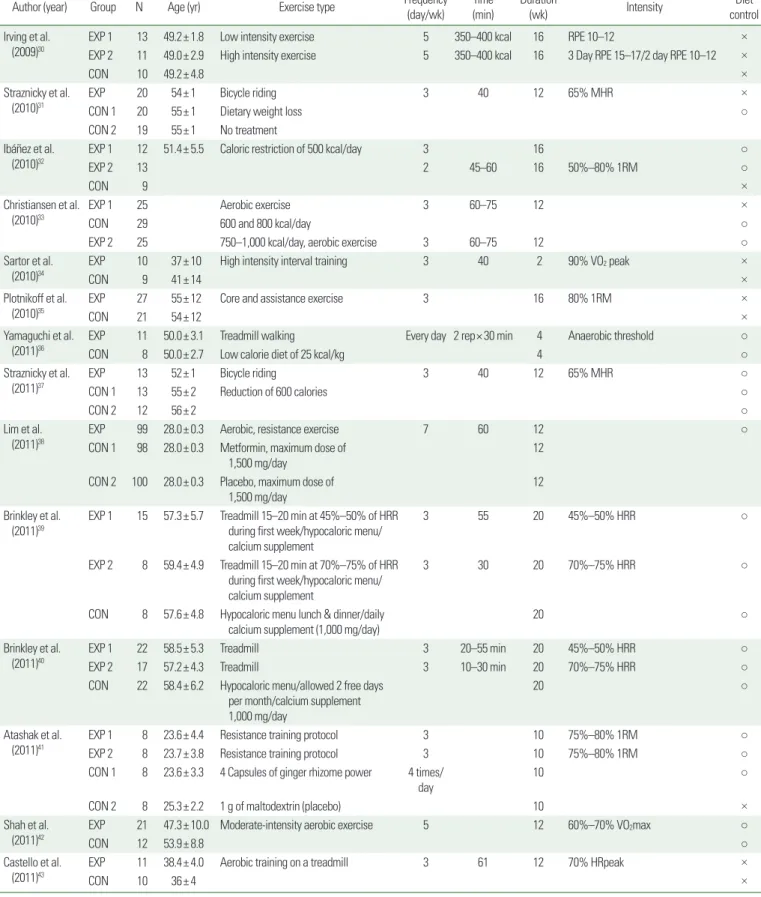
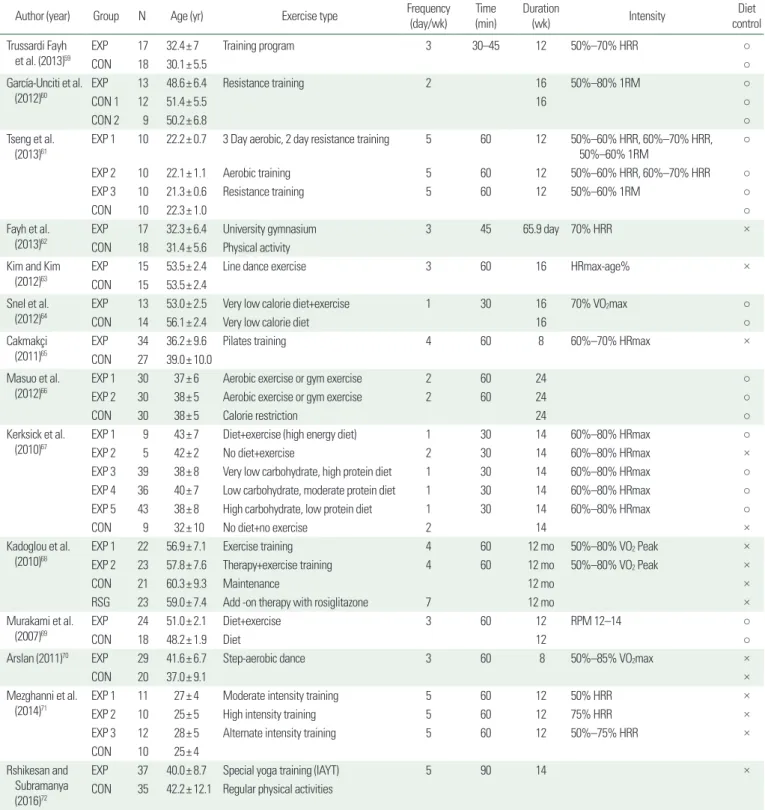
Methods: Our review focuses on research tracking the effects of exercise on obesity conducted from 2007 to 2016 and available in any of three databases: Embase, PubMed, and EBSCO Academic Search Premier. The key- words used in the search were “exercise and obesity” and “exercise and obese.”
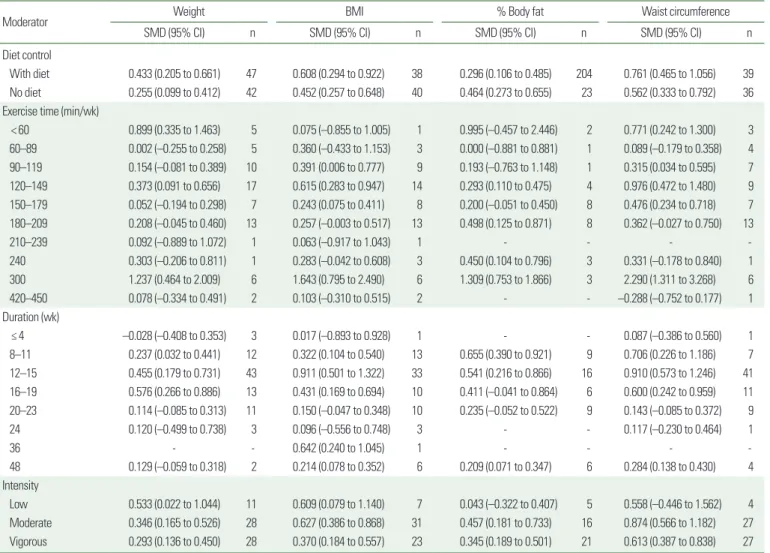
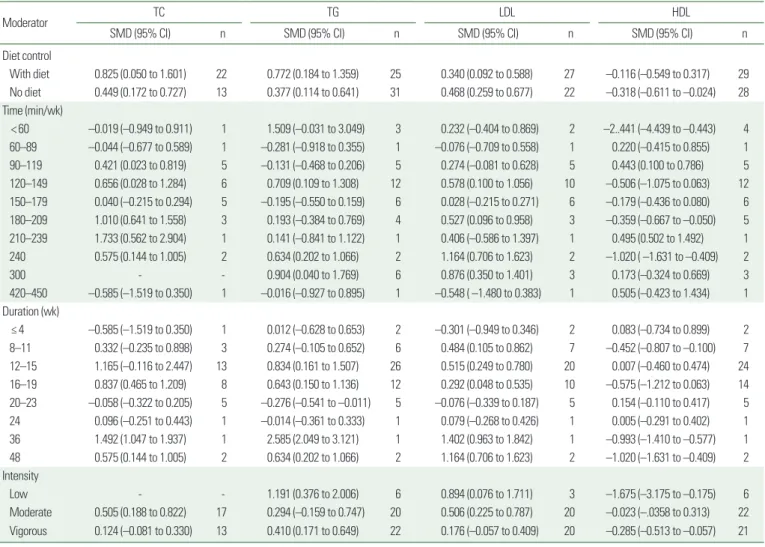
Results: The average size of the effects that exercise interventions have on body mass index (standardized mean difference [SMD], 0.533), waist circumference (SMD, 0.666), total cholesterol (SMD, 0.721), and triglyceride (TG; SMD, 0.603) were medium or larger. Exercise had greater effects on the outward appearance of obesity (body mass index, waist circumference) than on its practical factors (weight, % body fat). The effect of exercise on TG (SMD, 0.603) was larger than that on low-density lipoprotein (SMD, 0.406) and high-density lipoprotein (SMD, –0.222). Exercise duration (weeks of exercise) and intensity correlate better than exercise time (minutes per week) with a large and consistent improvement in adult obesity.
Conclusion: We suggest that individuals with obesity should exercise consistently to achieve significant im- provements in their health.
Key words: Obesity, Exercise mode, Body composition, Lipid profile, Meta-analysis
Received May 29, 2019 Reviewed July 10, 2019 Accepted October 30, 2019
* Corresponding author Yun-A Shin
https://orcid.org/0000-0002-8480-3454 Department of Prescription and Rehabilitation of Exercise, College of Sport Science, Dankook University, 119 Dandae-ro, Dongnam-gu, Cheonan 31116, Korea Tel: +82-41-550-3831 Fax: +82-41-550-3831 E-mail: [email protected]
INTRODUCTION
Obesity is a direct and indirect cause of serious chronic diseases such as hypertension, diabetes, heart disease, and cancer. Many studies during the past few decades have sought solutions to the problem of obesity. Despite those efforts, however, the prevalence of obesity has increased in many countries. In the attempt to funda- mentally improve obesity treatment, many new detailed approach- es have emerged.
Recent studies have described several interventions for obesity, including diet, physical activity or exercise, behavioral therapy, and medication. Among the various behavioral strategies, exercise in- terventions can provide effective weight maintenance, weight loss, weight maintenance after loss, and reduction of obesity. However, exercise alone has a limited effect on the body weights of individu- als with obesity.
1Furthermore, the guidelines for how much physi- cal activity and exercise are needed to improve health are widely known to the public as well as researchers, but they are too general
Copyright © 2019 Korean Society for the Study of Obesity
This is an Open Access article distributed under the terms of the Creative Commons Attribution Non-Commercial License (http://creativecommons.org/licenses/by-nc/4.0/) which permits unrestricted non-commercial use, distribution, and reproduction in any medium, provided the original work is properly cited.
2017-03-16 https://crossmark-cdn.crossref.org/widget/v2.0/logos/CROSSMARK_Color_square.svg
Effects of Exercise on the Body Composition and Lipid Profile of Individuals with Obesity: A Systematic
Review and Meta-Analysis
Kyoung-Bae Kim
1, Kijin Kim
2, Changsun Kim
3, Suh-Jung Kang
4, Hyo Jeong Kim
5, Seok Yoon
6, Yun-A Shin
7,*
1
Department of Physical Education, Korea Military Academy, Seoul;
2Department of Physical Education, College of Physical Education, Keimyung University, Daegu;
3
Department of Physical Education, Dongduk Women’s University, Seoul;
4Department of Sports and Health Management, Sangmyung University, Seoul;
5
Department of Sport and Healthy Aging, Korea National Sport University, Seoul, Korea;
6Department of Sport Science, Chowan University, Murfreesboro, NC, USA;
7