Biomedical Science Letters 2017, 23(3): 185~193 https://doi.org/10.15616/BSL.2017.23.3.185 eISSN : 2288-7415
Assessment of Malnutrition of Dialysis Patients and Comparison of Nutritional Parameters of CAPD and Hemodialysis Patients
Jin Woo Wi and Nam-Ho Kim†
Department of Internal Medicine, Chonnam National University Medical School, Gwanjgju 61469, Korea
Malnutrition is common and the major risk factor of mortality of end stage renal disease (ESRD) patients. The aim of this study is to assess nutritional status of malnutrition patients on dialysis by various methods and compare nutritional parameters of continuous ambulatory peritoneal dialysis (CAPD) patients with hemodialysis patients. 137 patients on dialysis from April 2009 to July 2013 were enrolled. Nutritional parameters of 66 CAPD and 71 hemodialysis patients were investigated by anthropometry, biochemical study, diet analysis and questionnaires. Malnutrition patients were selected by body mass index (BMI), serum albumin and pre-albumin based on International Society of Renal Nutrition and Metabolism (ISRNM) diagnostic criteria for protein-energy wasting and compared with non-malnutrition patients.
In comparison of CAPD and hemodialysis patients, most anthropometric values showed no significant difference except total body water (TBW). TBW was lower in CAPD patients (P=0.024). Although serum albumin was slightly higher in hemodialysis patients (P=0.047), pre-albumin were significantly higher in CAPD patients (P=0.000). Serum blood urea nitrogen (BUN) was higher in hemodialysis patients (P=0.000). In diet analysis, Total calorie (P=0.000) and total cholesterol (P=0.012) intakes were higher in CAPD patients. Mean subjective global assessment (SGA) grade was higher in CAPD patients (P=0.003). Several nutritional parameters of CAPD patients were better than hemodialysis patients implying more intensive therapeutic approach may be needed for hemodialysis patients. We have to understand multiple factors contributing malnutrition of ESRD patients and individualized therapeutic approach is needed.
Key Words: Peritoneal dialysis, Hemodialysis, Diet, Nutrition, Malnutrition
INTRODUCTION
Malnutrition is common in dialysis patients with a pre- valence ranging from 18% to 56% (Fouque et al., 2008;
Dukkipati and Kopple, 2009). It is a major risk factor of mortality in patients on dialysis and impairs quality of life (Bergstrom, 1995; Dong et al., 2011). Malnutrition of dialysis patients is caused by multiple factors such as inadequate pro- tein and calorie intake, loss of appetite, inflammation, loss
of residual renal function, inadequate dialysis, insulin re- sistance and superimposed co-morbid conditions (Bergstrom, 1995; Bossola et al., 2005; Chung, 2007). Because malnu- trition is the major co-morbid condition of patients on dialysis, regular monitoring of nutritional status, delivering adequate food intake, maintenance of adequate dialysis dose and therapeutic intervention are necessary. Dietary counseling should be a part of treatment to provide adequate calorie and protein intake (Prasad et al., 2008; Martin-Del-Campo et al., 2009). Kidney Disease Outcomes Quality Initiative
Original Article
*Received: August 27, 2017 / Revised: September 26, 2017 / Accepted: September 26, 2017
†Corresponding author: Nam-Ho Kim. Division of Nephrology, Department of Internal Medicine, Chonnam National University Hospital, 42 jebong-ro, donggu, Gwangju 61469, Korea.
Tel: +82-62-220-6270, Fax: +82-62-225-8330, e-mail: [email protected]
○CThe Korean Society for Biomedical Laboratory Sciences. All rights reserved.
○CCThis is an Open Access article distributed under the terms of the Creative Commons Attribution Non-Commercial License (http://creativecommons.org/licenses/by-nc/3.0/) which permits unrestricted non-commercial use, distribution, and reproduction in any medium, provided the original work is properly cited.
(KDOQI) guideline recommends routine measurements in- cluding serum albumin, % of usual post dialysis (HD) or post-drain body weight (PD), % of standard body weight, subjective global assessment and dietary interview Assess- ment of nutritional status is the first step for screening malnutrition and therapeutic intervention.
There are significant differences of BMI, muscle mass, dietary intake of patients between different countries and regions. For these reasons, total dietary assessment of a large number of Korean dialysis patients is needed for approaching and finding solution for the patients. It is also the first step for further researches for searching possible dietary bio- markers and developing practical dietary assessment methods.
Modality of dialysis also has effect on patient's nutritional status. It could cause loss of protein and soluble vitamins and suppress appetite (Chung, 2007). But which modality is superior in nutritional aspects is not yet clear (Bergstrom, 1995). In this study, nutritional parameters of dialysis patients were investigated by diet analysis, anthropometry, laboratory study and questionnaires and we compared nutritional para- meters of hemodialysis patients and CAPD patients. Fur- thermore, malnutrition patients were selected based on ISRNM diagnostic criteria for PEW and compared with non- malnutrition patients.
MATERIALS AND METHODS Patients
66 peritoneal dialysis patients and 71 hemodialysis patients of three national university hospitals (Chonnam, Chungnam, Jeju National University Hospital) were enrolled. These patients are on at least 3 months stable dialysis. Patients with acute infection at the time of investigation were excluded.
Between April 2009 and July 2013, total two or three times of diet analysis, anthropometry and serum nutritional pro- gnostic marker are investigated. Blood sampling was per- formed shortly before starting dialysis. We used mean value of investigations.
Diet and nutrient analysis
We estimated diet uptake by consecutive three days quan- titative diet record method. We used real food sized food
model for accurate quantification. Nutritional experts back up this diet record by one-to-one interview with patients.
Diet record is analyzed by Nutrient analyzing program CAN Pro (programmed by Korean Nutrition Information Center, ver 3.0) for each nutrient quantification. We used mean value for three days nutrient uptake. For peritoneal dialysis patients, 70% of dialysate calorie added to total calorie intake con- sidering dextrose concentration of dialysate, dialysate volume, and dialysis frequency.
Anthropometry measurement
We measured body weight, height and calculated BMI according the Krishnamoorthy et al. (2015). TSF (triceps skin-fold thickness), BSF (biceps skin-fold thickness), supra- iliac skin fold thickness and MAC (mid-arm circumference) were measured by caliper. MAMC (mid-arm muscle circum- ference) was calculated by the formula. MAMC = MAC (mm) - {0.314 * TSF(mm)} Lean body mass, percent of lean body mass, fat mass, percent of fat mass and TBW (total body water) were measured by body composition monitor.
Subjective Global Assessment (SGA) score
SGA score is a clinical technique which assesses nutri- tional status based on features of the history and physical examination (Sum et al., 2017). SGA grade consists of 7 assessment items (weight change, intake, gastrointestinal symptom, functional status, metabolic demands, fat store, muscle store and edema). Each item is scored 1 to 7. Con- sidering these scores, total SGA score is rated subjectively not by sum or mean of the scores (Detsky et al., 1987).
Selection of malnutrition patients
The ISRNM (International Society of Renal Nutrition and Metabolism) proposed comprehensive diagnostic criteria for PEW (protein energy wasting) in patients with ESRD (Fouque et al., 2008). A clinical diagnosis of PEW according to the ISRNM guidelines requires at least three out of the four main categories (serum chemistry, body mass, muscle mass, and dietary intake). Based on the criteria, patients satisfying BMI < 23 kg/m2 and serum albumin < 3.8 g/dl (or serum pre- albumin < 30 mg/dl) were selected as malnutrition patients and they were compared with non-malnutrition patients.
Statistical analysis
The patients were divided into CAPD and hemodialysis groups and variables were compared between these groups.
Continuous variables were expressed as the mean ± standard deviation. The Student t-test and Pearson's chi-squared test or Mann-Whitney test were used to compare baseline char- acteristics, anthropometric values, diet and laboratory study between two groups. Binary logistic regression was used to analyze risk factors of malnutrition. Null hypotheses of no differences were rejected if the P values were less than 0.05.
Statistical analysis was performed using SPSS 20.0 (SPSS, Inc., IBM, Illinois, USA).
RESULTS
Comparison of hemodialysis and CAPD patients Mean age of hemodialysis patients was higher than CAPD patients {hemodialysis : 53, CPAD : 45, (P<0.001)}.
41 male and 25 female patients were undergoing CAPD. 40 male and 31 female patients were undergoing hemodialysis.
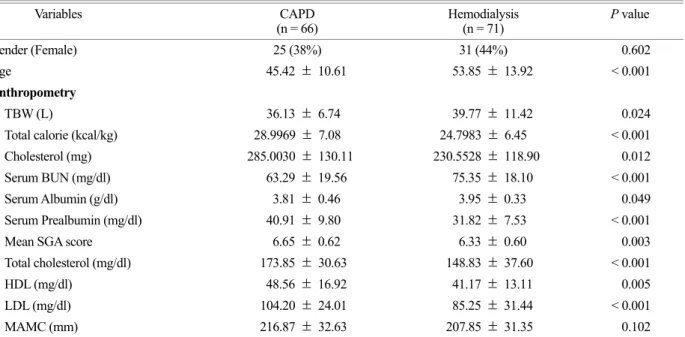
Table 1 shows anthropometric values of two groups. Total
body water (TBW) (P=0.026) and Triceps skin fold thick- ness (P=0.049) were higher in hemodialysis group. BMI and other anthropometric values showed no significant dif- ference between two groups. Table 2 shows nutrient intakes of patients on dialysis. Total calorie (P<0.001) and Total cholesterol intakes (P=0.012) were higher in CAPD patients.
Other nutrient intake including protein, lipid, microelements, and vitamins showed no significant difference between two groups.
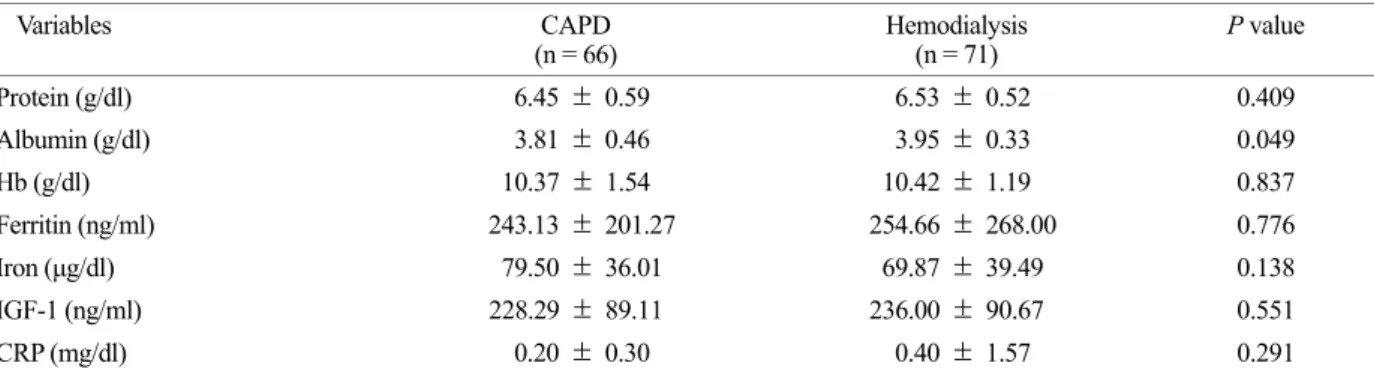
The possible serum biomarkers are useful nutritional parameter of dialysis patients. As shown in Fig. 1, pre- albumin were significantly higher in CAPD group (P<0.05).
However, the BUN was higher in hemodialysis group (P<0.001). The other biochemical paramerters in serum including albumin were not differed significantly among the two groups (Fig. 1 and Table 3).
SGA grade is well known method for assessing nutritional status of patients. Table 4 shows numbers of patients belong to each SGA grade. No one was under SGA score 5. Mean SGA score was higher in CAPD patients (P=0.003). Also, percent of highest SGA score was higher in CAPD patients (72.7% versus 40.8%). Lipid profile of CAPD and hemo-
Table 1. Comparison of gender, age, anthropometry among the two groups
Variables CAPD
(n = 66) Hemodialysis
(n = 71) P value
Gender (Female) 25 (38%) 31 (44%) 0.602
Age 45.42 ± 10.61 53.85 ± 13.92 < 0.001
Anthropometry
TBW (L) 36.13 ± 6.74 39.77 ± 11.42 0.024
Total calorie (kcal/kg) 28.9969 ± 7.08 24.7983 ± 6.45 < 0.001
Cholesterol (mg) 285.0030 ± 130.11 230.5528 ± 118.90 0.012
Serum BUN (mg/dl) 63.29 ± 19.56 75.35 ± 18.10 < 0.001
Serum Albumin (g/dl) 3.81 ± 0.46 3.95 ± 0.33 0.049
Serum Prealbumin (mg/dl) 40.91 ± 9.80 31.82 ± 7.53 < 0.001
Mean SGA score 6.65 ± 0.62 6.33 ± 0.60 0.003
Total cholesterol (mg/dl) 173.85 ± 30.63 148.83 ± 37.60 < 0.001
HDL (mg/dl) 48.56 ± 16.92 41.17 ± 13.11 0.005
LDL (mg/dl) 104.20 ± 24.01 85.25 ± 31.44 < 0.001
MAMC (mm) 216.87 ± 32.63 207.85 ± 31.35 0.102
CAPD, continuous ambulatory peritoneal dialysis; TBW, total body water; BUN, blood urea nitrogen; SGA score, subjective global assessment score; HDL, high density lipoprotein; LDL, low density lipoprotein
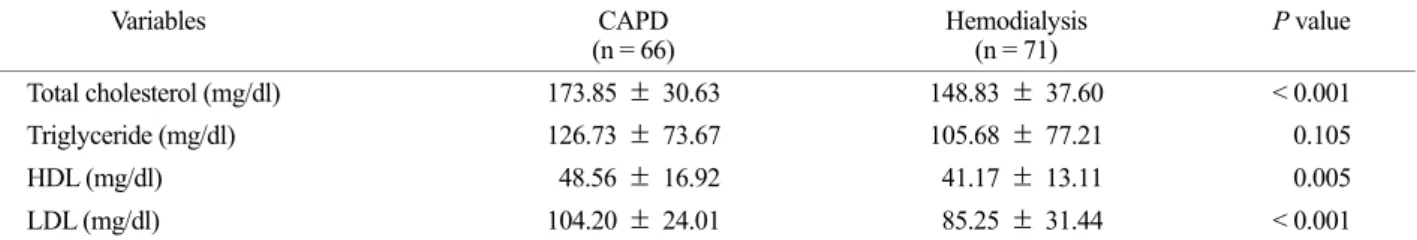
dialysis patients showed significant difference. Total chole- sterol (P<0.001), HDL (P=0.005), LDL (P<0.001) were higher in CAPD patients (Table 5).
Comparison of malnutrition and non-malnutrition patients
Total 33 (24%) of 137 patients were malnutrition patients.
Prevalence of malnutrition of CAPD and hemodialysis patients had no significant differences (P=0.842). Table 6
shows comparison of serum biochemistries, lipid profiles, anthropometric values and dietary intake which had signifi- cant differences between malnutrition and non-malnutrition patients. Triglyceride level was higher in non-malnutrition patients but HDL was higher in malnutrition patients. Several anthropometric values were significantly higher in non- malnutrition patients. Interestingly, malnutrition patient intake more total calorie and nutrients including protein, vegetable lipid, animal lipid and carbohydrate. Comparison of malnu- Table 2. Comparison of dietary intake among the two groups
Variables CAPD
(n = 66) Hemodialysis
(n = 71) P value
Total calorie (kcal/kg) 28.9969 ± 7.08 24.7983 ± 6.45 < 0.001
Total protein (g/kg) 0.9512 ± 0.29 0.9858 ± 0.34 0.522
Vegetable protein (g/kg) 0.4489 ± 0.13 0.4860 ± 0.13 0.100
Animal protein (g/kg) 0.5023 ± 0.21 0.4998 ± 0.30 0.954
Total lipid (g/kg) 0.6221 ± 0.21 0.6362 ± 0.30 0.752
Vegetable lipid (g/kg) 0.2593 ± 0.12 0.2787 ± 0.12 0.350
Animal lipid (g/kg) 0.3628 ± 0.21 0.3581 ± 0.30 0.891
Carbohydrate (g/kg) 3.5102 ± 0.86 3.8145 ± 0.98 0.055
Cholesterol (mg) 285.0030 ± 130.11 230.5528 ± 118.90 0.012
Dietary fiber (g/kg) 0.2806 ± 0.20 0.2470 ± 0.08 0.212
Ash (g) 14.8736 ± 5.13 13.7794 ± 4.16 0.174
Vegetable Ca (mg) 244.2959 ± 99.58 246.4093 ± 84.06 0.894
Animal Ca (mg) 178.7043 ± 90.01 158.7003 ± 119.50 0.268
Phosphorus (mg) 778.2681 ± 242.15 755.8489 ± 222.72 0.575
Vegetable iron (mg) 13.5356 ± 3.38 8.6114 ± 3.72 0.224
Animal iron (mg) 2.9500 ± 1.31 2.6615 ± 1.44 0.221
Sodium (mg) 3197.2080 ± 1232 3167.8072 ± 982 0.878
Potassium (mg) 2088.2491 ± 644 1958.1963 ± 670 0.249
Zinc (mg) 21.9172 ± 8.37 7.1052 ± 2.08 0.155
Vitamin A (μg) 624.7412 ± 243.35 610.2410 ± 312.78 0.762
Retinol (μg) 122.6194 ± 76.23 96.1234 ± 97.22 0.077
β - Carotene (μg) 2746.8761 ± 1041 2867.9145 ± 1728 0.618
Vitamin B1 (mg) 0.6304 ± 0.26 0.8535 ± 0.29 0.162
Vitamin B2 (mg) 0.9030 ± 0.26 0.8306 ± 0.29 0.129
Vitamin B6 (mg) 1.5836 ± 0.54 1.5636 ± 0.52 0.825
Vitamin C (mg) 95.5544 ± 58.34 79.6754 ± 51.83 0.095
Vitamin E (mg) 11.8608 ± 9.17 10.9316 ± 4.90 0.466
Niacin (mg) 12.6406 ± 4.68 12.2923 ± 4.46 0.657
Folate (μg) 172.1954 ± 63.05 173.3374 ± 78.40 0.925
CAPD, continuous ambulatory peritoneal dialysis
trition and non-malnutrition patients on CAPD and hemo- dialysis subgroups showed the similar results.
DISCUSSION
High BMI is associated with increased survival in patients on dialysis and low BMI is associated with an increased risk of mortality (Stack et al., 2004). But BMI can be affected by fat mass or hydration status. Especially CAPD patient leads to greater volume expansion than hemodialysis patients and survival advantage associated with a higher BMI is less apparent in CAPD patients (Snyder et al., 2003). In this study BMI of CAPD and hemodialysis groups were 22.83 and 22.43, showing no significant differences between the
two groups.
Reduced muscle mass is associated with inflammation, which plays central role in malnutrition, and increased mor- tality in patients on dialysis (Ramkumar et al., 2005; Honda et al., 2007). Measurement of mid-arm muscle circum- ference is commonly used for anthropometric assessment.
But it is not accurate because there is substantial error which depends on observers and could be affected by hydration status (Chung et al., 2007). But in our results, there are no significant differences between the two groups.
The accuracy of dietary intake assessment by quantitative diet record method depends on the patients' ability to quantify the amount of food eaten (Bargman, 1996). In this study, real food sized food model were used for accurate quantification and Nutritional experts backed up the diet record by one-to-one interview with patients.
Protein intake of 1.2 g/kg per day was recommend by KDOQI guidelines. The European guidelines warned against Table 3. Comparison of serum biochemistries among the two groups
Variables CAPD
(n = 66) Hemodialysis
(n = 71) P value
Protein (g/dl) 6.45 ± 0.59 6.53 ± 0.52 0.409
Albumin (g/dl) 3.81 ± 0.46 3.95 ± 0.33 0.049
Hb (g/dl) 10.37 ± 1.54 10.42 ± 1.19 0.837
Ferritin (ng/ml) 243.13 ± 201.27 254.66 ± 268.00 0.776
Iron (μg/dl) 79.50 ± 36.01 69.87 ± 39.49 0.138
IGF-1 (ng/ml) 228.29 ± 89.11 236.00 ± 90.67 0.551
CRP (mg/dl) 0.20 ± 0.30 0.40 ± 1.57 0.291
CAPD, continuous ambulatory peritoneal dialysis; Hb, hemoglobin; IGF-1, insulin like growth factor 1; CRP, C-reactive protein
Table 4. Comparison of SGA scores among the two groups
Variables CAPD
(n = 66) Hemodialysis
(n = 71) P value
SGA score 5 5 (7.6%) 5 (7.0%)
SGA score 6 13 (19.7%) 37 (52.1%) SGA score 7 48 (72.7%) 29 (40.8%)
Mean SGA score 6.65 ± 0.62 6.33 ± 0.60 0.003 CAPD, continuous ambulatory peritoneal dialysis; SGA score, subjective global assessment score
Fig. 1. Comparison of BUN, creatine and prealbumin among the two groups. CAPD, continuous ambulatory peritoneal dialysis; HD, hemodialysis; *P<0.05 versus CAPD
lower dietary protein intake of <0.73 g/kg per day and recommends protein intake >1.0 g/kg per day (Dombros,
2005). In this study, Dietary protein uptake of Both CAPD and hemodialysis patients were below 1.0 g/kg and showed Table 5. Comparison of lipid profiles among the two groups
Variables CAPD
(n = 66) Hemodialysis
(n = 71) P value
Total cholesterol (mg/dl) 173.85 ± 30.63 148.83 ± 37.60 < 0.001
Triglyceride (mg/dl) 126.73 ± 73.67 105.68 ± 77.21 0.105
HDL (mg/dl) 48.56 ± 16.92 41.17 ± 13.11 0.005
LDL (mg/dl) 104.20 ± 24.01 85.25 ± 31.44 < 0.001
CAPD, continuous ambulatory peritoneal dialysis; HDL, high density lipoprotein; LDL, low density lipoprotein
Table 6. Comparison of malnutrition and non-malnutrition patients
Variables Non-malnutrition
(n = 104) Malnutrition
(n = 33) P value
CAPD 51 15 (22.7%)
Hemodialysis 53 18 (25.4%)
Serum biochemistry
Albumin (g/dl) 3.95 ± 0.39 3.69 ± 0.37 0.001
Prealbumin (mg/dl) 38.05 ± 9.28 30.38 ± 9.16 < 0.001
Lipid profile
Triglyceride (mg/dl) 124.25 ± 82.81 89.24 ± 38.82 0.001
HDL (mg/dl) 42.16 ± 11.84 52.82 ± 21.81 0.011
Anthropometry
TSF (mm) 16.53 ± 6.62 13.33 ± 5.25 0.006
BSF (mm) 12.28 ± 6.60 9.74 ± 4.52 0.015
Suprailiac skin fold thickness (mm) 22.93 ± 8.26 16.11 ± 6.93 < 0.001
MAC (cm) 26.83 ± 3.39 24.28 ± 2.35 < 0.001
MAMC (mm) 216.21 ± 32.66 199.55 ± 27.38 0.005
TBW (L) 39.47 ± 9.45 33.44 ± 8.71 0.001
BMI (kg/m2) 23.47 ± 3.11 19.95 ± 1.87 < 0.001
Dietary intake
Total calorie (kcal/kg) 25.64 ± 6.96 30.55 ± 6.06 < 0.001
Total protein (g/kg) 0.9155 ± 0.30 1.1380 ± 0.32 0.001
Vegetable protein (g/kg) 0.4531 ± 0.13 0.5154 ± 0.13 0.018
Animal protein (g/kg) 0.4624 ± 0.23 0.6226 ± 0.31 0.010
Total lipid (g/kg) 0.5817 ± 0.24 0.7797 ± 0.28 0.001
Vegetable lipid (g/kg) 0.2515 ± 0.12 0.3255 ± 0.11 0.002
Animal lipid (g/kg) 0.3305 ± 0.17 0.4544 ± 0.25 0.012
Carbohydrate (g/kg) 3.54 ± 0.96 4.06 ± 0.74 0.002
CAPD, continuous ambulatory peritoneal dialysis; HDL, high density lipoprotein; TSF, triceps skin fold thickness; BSF, biceps skin fold thickness; MAC, mid arm circumference; MAMC, mid arm muscle circumference; TBW, total body water; BMI, body mass index
no differences between the two groups. It implies Korean patients on dialysis should be recommended to intake more sufficient dietary protein uptake. The ISRNM panel recom- mended SGA score as potential tools for assessment of malnutrition. In our study, SGA score was better in CAPD patients. But the usefulness of SGA score for diagnosis of malnutrition has not been proved (Fouque et al., 2008).
Current studies in chronic kidney disease (CKD) including dialysis populations consistently have shown the strong mortality-predictability of several markers such as hypo- albuminemia, low serum cholesterol levels, low body mass index, and reduced dietary protein intake (Kovesdy et al., 2009; Kovesdy and Kalantar-Zadeh, 2009). Among various nutritional parameters low serum albumin is a strong pre- dictor of mortality in patients on dialysis (Han et al., 2007;
Spiegel and Breyer, 1994). However, serum albumin has 20 days of long half-life and can be affected by multiple factors such as inflammation, fluid status of patients, losses into dialysate (Han et al., 1996; Cheng et al., 2005). In contrast, prealbumin has 2 days of shorter half-life and it could be more sensitive biomarkers of nutritional status of patients. In our study, serum albumin was slightly higher in hemodialysis patients. However, pre-albumin were signifi- cantly higher in CAPD group. Serum BUN and Cr represent reserved renal function (RRF). RRF has considerable effects on nutritional status of patients on dialysis. Reduced RRF cause decline in the nutritional status of the patients (Davies et al., 2000; Bargman et al., 2001; Wang et al., 2001). Mean value of serum BUN was higher in hemodialysis patients.
Estimated GFR depends on age and serum creatine of patients and it represents the RRF. But it was not calculated in this study.
CAPD patients are at risk for protein energy malnutrition because of nutrient and calorie losses during dialysis (Gokal and Oreopoulos, 1996; Wang et al., 2001). But several nutri- tional parameters of CAPD patients including serum pre- albumin, SGA grade, and lipid profiles were better than those of hemodialysis patients. It implies more intensive therapeutic approach may be needed for malnutrition patients on hemodialysis.
In comparison of malnutrition and non-malnutrition patients, several anthropometric values including suprailiac
skin fold thickness and MAC were consistently lower in malnutrition group. These values can be measured by simple methods and used as useful method for assessment of malnutrition. Interestingly, malnutrition patients with lower BMI, albumin and prealbumin actually took more dietary energy and nutrients. It means that malnutrition of dialysis patients is not caused by simply lower dietary intake. An inflammation-associated wasting process, so called protein- energy wasting, is well known to be an important patho- genesis of malnutrition of ESRD patients (Stenvinkel et al., 2000; de Mutsert et al., 2008). Inflammation, hypercatabolic illness, IGF-1, growth hormone, chronic acidosis, resistance to insulin and Nutrient loss during dialysis can cause loss of muscle mass despite adequate nutrient intake (Dukkipati and Kopple, 2009; Chung et al., 2007). In this study, des- pite higher dietary energy and nutrient intake, malnutrition patients consistently had worse anthropometric values. Ex- cept insufficient dietary intake, multiple factors including inflammation, loss of residual renal function, inadequate dialysis, insulin resistance and superimposed co-morbid conditions are associated with malnutrition of ESRD patients (Bergstrom, 1995). We have to understand these factors and individualized therapeutic approach is needed.
ABBREVIATIONS
BMI, Body mass index; BSF, biceps skin-fold thickness;
BUN, blood urea nitrogen; CAPD, continuous ambulatory peritoneal dialysis; CKD, chronic kidney disease; CRP, C-reactive protein; ESRD, end stage renal disease; Hb, hemoglobin; HD, hemodialysis; HDL, high density lipo- protein; ISRNM, International Society of Renal Nutrition and Metabolism; IGF-1, insulin like growth factor 1; KDOQI, Kidney Disease Outcomes Quality Initiative; MAC, mid- arm circumference; MAMC, mid-arm muscle circumference;
LDL, low density lipoprotein; SGA, subjective global assess- ment; TBW, total body water; TSF, triceps skin fold thick- ness; PEW, protein energy wasting; RRF, reserved renal function
CONFLICT OF INTEREST
The authors have no conflict of interest to declare.
REFERENCES
Bargman JM. The rationale and ultimate limitations of urea kinetic modelling in the estimation of nutritional status. Peritoneal Dialysis International. 1996. 16: 347-351.
Bargman JM, Thorpe KE, Churchill DN. Relative contribution of residual renal function and peritoneal clearance to adequacy of dialysis: a reanalysis of the CANUSA study. Journal of the American Society of Nephrology. 2001. 12: 2158-2162.
Bergstrom J. Nutrition and mortality in hemodialysis. Journal of the American Society of Nephrology. 1995. 6: 1329-1341.
Bergstrom J. Why are dialysis patients malnourished? American Journal of Kidney Diseases. 1995. 26: 229-241.
Bossola M, Muscaritoli M, Tazza L, Giungi S, Tortorelli A, Rossi Fanelli F, Luciani G. Malnutrition in hemodialysis patients:
what therapy? American Journal of Kidney Diseases. 2005.
46: 371-386.
Cheng LT, Tang W, Wang T. Strong association between volume status and nutritional status in peritoneal dialysis patients.
American Journal of Kidney Diseases. 2005. 45: 891-902.
Chung SH, Stenvinkel P, Lindholm B, Avesani CM. Identifying and managing malnutrition stemming from different causes.
Peritoneal Dialysis International. 2007. 27: 239-244.
Chung SH, Carrero JJ, Lindholm B. Causes of poor appetite in patients on peritoneal dialysis. Journal of Renal Nutrition. 2011.
21: 12-15.
Davies SJ, Phillips L, Griffiths AM, Naish PF, Russell GI. Analysis of the effects of increasing delivered dialysis treatment to malnourished peritoneal dialysis patients. Kidney International.
2000. 57: 1743-1754.
De Mutsert R, Grootendorst DC, Axelsson J, Boeschoten EW, Krediet RT, Dekker FW. Excess mortality due to interaction between protein-energy wasting, inflammation and cardio- vascular disease in chronic dialysis patients. Nephrology Dialysis Transplantation. 2008. 23: 2957-2964.
Detsky AS, McLaughlin JR, Baker JP, Johnston N, Whittaker S, Mendelson RA, Jeejeebhoy KN. What is subjective global assessment of nutritional status? Journal of Parenteral and Enteral Nutrition. 1987. 11: 8-13.
Dombros N, Dratwa M, Feriani M, Gokal R, Heimbürger O, Krediet R, Plum J, Rodrigues A, Selgas R, Struijk D, Verger.
European best practice guidelines for peritoneal dialysis. 8 Nutrition in peritoneal dialysis. Nephrology Dialysis Trans-
plantation. 2005. 20: 28-33.
Dong J, Li Y, Xu Y, Xu R. Daily protein intake and survival in patients on peritoneal dialysis. Nephrology Dialysis Trans- plantation. 2011. 26: 3715-3721.
Dukkipati R, Kopple JD. Causes and prevention of protein-energy wasting in chronic kidney failure. Seminars in Nephrology.
2009. 29: 39-49.
Fouque D, Kalantar-Zadeh K, Kopple J, Cano N, Chauveau P, Cuppari L, Franch H, Guarnieri G, Ikizler TA, Kaysen G, Lindholm B, Massy Z, Mitch W, Pineda E, Stenvinkel P, Treviño-Becerra A, Wanner C. A proposed nomenclature and diagnostic criteria for protein-energy wasting in acute and chronic kidney disease. Kidney International. 2008. 73: 391 -398.
Gokal R, Oreopoulos DG. Is long-term technique survival on continuous ambulatory peritoneal dialysis possible? Peritoneal Dialysis International. 1996. 16: 553-555.
Han DS, Lee SW, Kang SW, Choi KH, Lee HY, Cho EY, Lee JH.
Factors affecting low values of serum albumin in CAPD patients. Advances in Peritoneal Dialysis. 1996. 12: 288-292.
Han SH, Lee SC, Ahn SV, Lee JE, Choi HY, Kim BS, Kang SW, Choi KH, Han DS, Lee HY. Improving outcome of CAPD:
twenty-five years' experience in a single Korean center. Peri- toneal Dialysis International. 2007. 27: 432-440.
Honda H, Qureshi AR, Axelsson J, Heimburger O, Suliman ME, Barany P, Stenvinkel P, Lindholm B. Obese sarcopenia in patients with end-stage renal disease is associated with in- flammation and increased mortality. The American Journal of Clinical Nutrition. 2007. 86: 633-638.
Kalantar-Zadeh K, Kopple JD. Obesity paradox in patients on maintenance dialysis. Contributions to Nephrology. 2006. 151:
57-69.
Krishnamoorthy V, Sunder S, Mahapatra HS, Verma H, Sharma N, Jayaraman R, Sathi S, Khanna S, Mohamed A. Evaluation of protein-energy wasting and inflammation on patients under- going continuous ambulatory peritoneal dialysis and its cor- relations. Nephro-Urology Monthly. 2015. 29: e33143.
Kovesdy CP, Kalantar-Zadeh K. Why is protein-energy wasting associated with mortality in chronic kidney disease? Seminars in Nephrology. 2009. 29: 3-14.
Kovesdy CP, George SM, Anderson JE, Kalantar-Zadeh K. Out- come predictability of biomarkers of protein-energy wasting and inflammation in moderate and advanced chronic kidney disease. The American Journal of Clinical Nutrition. 2009.
90: 407-414.
Maiorca R, Cancarini GC, Zubani R, Camerini C, Manili L, Brunori G, Movilli E. CAPD viability: a long-term comparison with hemodialysis. Peritoneal Dialysis International. 1996. 16: 276 -287.
Martín-Del-Campo F, González-Espinoza L, Rojas-Campos E, Ruiz N, González J, Pazarín L, Cueto-Manzano AM. Conventional nutritional counselling maintains nutritional status of patients on continuous ambulatory peritoneal dialysis in spite of sys- temic inflammation and decrease of residual renal function.
Nephrology. 2009. 14: 493-498.
Prasad N, Gupta A, Sinha A, Sharma RK, Kumar A, Kumar R.
Changes in nutritional status on follow-up of an incident cohort of continuous ambulatory peritoneal dialysis patients.
Journal of Renal Nutrition. 2008. 18: 195-201.
Ramkumar N, Pappas LM, Beddhu S. Effect of body size and body composition on survival in peritoneal dialysis patients.
Peritoneal Dialysis International. 2005. 25: 461-469.
Snyder JJ, Foley RN, Gilbertson DT, Vonesh EF, Collins AJ. Body size and outcomes on peritoneal dialysis in the United States.
Kidney International. 2003. 64: 1838-1844.
Spiegel DM, Breyer JA. Serum albumin: a predictor of long-term outcome in peritoneal dialysis patients. American Journal of Kidney Diseases. 1994. 23: 283-285.
Stack AG, Murthy BV, Molony DA. Survival differences between peritoneal dialysis and hemodialysis among "large" ESRD patients in the United States. Kidney International. 2004. 65:
2398-2408.
Stenvinkel P, Heimbürger O, Lindholm B, Kaysen GA, Bergström J. Are there two types of malnutrition in chronic renal failure?
Evidence for relationships between malnutrition, inflammation and atherosclerosis (MIA syndrome). Nephrology Dialysis Transplantation. 2000. 15: 953-960.
Sum SS, Marcus AF, Blair D, Olejnik LA, Cao J, Parrott JS, Peters EN, Hand RK, Byham-Gray LD. Comparison of Subjective Global Assessment and Protein Energy Wasting Score to Nutrition Evaluations Conducted by Registered Dietitian Nutritionists in Identifying Protein Energy Wasting Risk in Maintenance Hemodialysis Patients. Journal of Renal Nutrition.
2017. 27: 325-332.
Wang AY, Sea MM, Ip R, Law MC, Chow KM, Lui SF, Li PK, Woo J. Independent effects of residual renal function and dialysis adequacy on actual dietary protein, calorie, and other nutrient intake in patients on continuous ambulatory peritoneal dialysis. Journal of the American Society of Nephrology. 2001.
12: 2450-2457.
https://doi.org/10.15616/BSL.2017.23.3.185
Cite this article as: Wi JW, Kim NH. Assessment of Malnutrition of Dialysis Patients and Comparison of Nutritional Parameters of CAPD and Hemodialysis Patients. Biomedical Science Letters. 2017. 23: 185-193.