ISSN 2234-3806 • eISSN 2234-3814
Ann Lab Med 2019;39:67-75
https://doi.org/10.3343/alm.2019.39.1.67
Performance of Hepatitis B Core-Related Antigen Versus Hepatitis B Surface Antigen and Hepatitis B Virus DNA in Predicting HBeAg-positive and HBeAg- negative Chronic Hepatitis
Zhan-qing Zhang , M.D.1*, Yan-bing Wang, M.D.1*, Wei Lu, M.D.1, Dan-ping Liu, M.D.1, Bi-sheng Shi, Ph.D.2, Xiao-nan Zhang, Ph.D.2, Dan Huang, M.D.1, Xiu-fen Li, M.D.1, Xin-lan Zhou, M.D.1, and Rong-rong Ding, M.D.1
1Department of Hepatobiliary Medicine and 2Research Unit, Shanghai Public Health Clinical Center of Fudan University, Shanghai, China
Background: We examined changes in hepatitis B core-related antigen (HBcrAg) during the four sequential phases of chronic hepatitis B virus (HBV) infection: hepatitis B e anti- gen (HBeAg)-positive chronic infection (EPCI) and hepatitis (EPCH), followed by HBeAg- negative chronic infection (ENCI) and hepatitis (ENCH). We compared the performance of serum HBcrAg, hepatitis B surface antigen (HBsAg), and HBV DNA in predicting EPCH and ENCH.
Methods: We enrolled 492 consecutive patients: 49 with EPCI, 243 with EPCH, 101 with ENCI, and 99 with ENCH. HBcrAg was detected by chemiluminescent enzyme immuno- assays. HBsAg and HBeAg were detected by chemiluminescent microparticle immunoas- says. HBV DNA was detected by real-time PCR. Predictive performance of HBcrAg, HB- sAg, and HBV DNA was evaluated using ROC curves.
Results: Areas under ROC curves (AUCs) of HBcrAg, HBsAg, and HBV DNA for predict- ing EPCH were 0.738, 0.812, and 0.717, respectively; optimal cutoffs were ≤1.43×10⁵ kU/mL, ≤1.89×10⁴ IU/mL, and ≤3.97×10⁷ IU/mL, with sensitivities and specificities of 66.3% and 77.6%, 65.0% and 93.9%, and 60.5% and 79.6%, respectively. AUCs of HBcrAg, HBsAg, and HBV DNA for predicting ENCH were 0.887, 0.581, and 0.978, re- spectively; optimal cutoffs were >26.8 kU/mL, >2.29×10² IU/mL, and >8.75×10³ IU/
mL, with sensitivities and specificities of 72.7% and 95.1%, 86.9% and 39.6%, and 89.9% and 92.1%, respectively.
Conclusions: HBsAg and HBV DNA were the best predictors of EPCH and ENCH, respec- tively. HBcrAg is an important surrogate marker for predicting EPCH and ENCH.
Key Words: Hepatitis B core-related antigen, Hepatitis B surface antigen, Hepatitis B virus DNA, Chronic hepatitis B, Performance
Received: December 16, 2017 Revision received: April 8, 2018 Accepted: August 20, 2018
Corresponding author: Zhan-qing Zhang, M.D.
https://orcid.org/0000-0001-7709-9027 Department of Hepatobiliary Medicine, Shanghai Public Health Clinical Center of Fudan University, Caolang Road 2901, Shanghai 201508, China
Tel: +8621-37990333 ext. 3245 E-mail: doctorzzqsphc@163.com
* These authors contributed equally to this work.
© Korean Society for Laboratory Medicine This is an Open Access article distributed under the terms of the Creative Commons Attribution Non-Commercial License (http://creativecom- mons.org/licenses/by-nc/4.0) which permits unrestricted non-commercial use, distribution, and reproduction in any medium, provided the original work is properly cited.
INTRODUCTION
Chronic hepatitis B virus (HBV) infection is still a serious global health threat. In 2015, its global prevalence was 3.5%, with 257–
270 million people living with chronic HBV infection. The natu-
ral course of chronic HBV infection is generally divided into four sequential phases: hepatitis B e antigen (HBeAg)-positive chronic infection (EPCI) and hepatitis (EPCH), followed by HBeAg-neg- ative chronic infection (ENCI) and hepatitis (ENCH) [1]; however, it is often diverse and variable. In patients with chronic HBV in-
2017-03-16 https://crossmark-cdn.crossref.org/widget/v2.0/logos/CROSSMARK_Color_square.svg
fection, persistent or recurrent chronic hepatitis is a major risk factor for cirrhosis, hepatocellular carcinoma, and hepatic de- compensation [1-4]. Currently, most clinical practice guidelines on the management of chronic HBV infection [1-4] focus on liver pathological assessment or on serum HBV DNA and ala- nine transferase (ALT), which serve as main markers to differen- tiate EPCH from EPCI and ENCH from ENCI and to decide anti- viral treatment. Recent studies have demonstrated that serum hepatitis B surface antigen (HBsAg) and hepatitis B core anti- body (HBcAb) are also markers for differentiating EPCH from EPCI and ENCH from ENCI [5-9].
Hepatitis B core-related antigen (HBcrAg) is a denatured mix- ture consisting of HBeAg, hepatitis B core antigen (HBcAg), and a 22-kDa precore protein (p22cr) [10, 11]. p22cr has been found in HBV DNA-negative and HBcAg-deficient Dane-like particles [12]. HBeAg, HBcAg, and p22cr are all products of the precore/
core gene and share 149 amino acid residues [12]. The levels of serum HBcrAg vary among the phases of chronic HBV infec- tion [13, 14]. We investigated changes in serum HBcrAg in the different phases of chronic HBV infection and evaluated the performance of serum HBcrAg in predicting EPCH and ENCH in comparison with that of other serum virological markers.
METHODS Study population
This retrospective study included 492 treatment-naive Chinese patients with chronic HBV infection who underwent liver biopsy at the Shanghai Public Health Clinical Center of Fudan Univer- sity, China, between January 2012 and June 2015. Among them, 292 were HBeAg-positive, including 189 males and 103 females with a median age of 32.0 years (range: 14–72 years), and 200 were HBeAg-negative, including 124 males and 76 females with a median age of 42.5 years (range: 17–72 years). There was no difference in the male : female ratio (χ2=0.272, P =0.6017), but there was a significant difference in median age (Z =8.152, P <0.0001) between HBeAg-positive and HBeAg-negative pa- tients.
On the basis of a detailed medical history as well as dynamic routine serum biochemical and virological tests at least one year before liver biopsy, the 492 patients were classified as EPCI (N=49), EPCH (N=243), ENCI (N=101), and ENCH (N=99), with reference to the European Association for the Study of the Liver guidelines [1] and the Scheuer standard [15] for liver path- ological assessment. According to the the Scheuer standard, grade is used to describe the intensity of necro-inflammation,
and stage is a measure of fibrosis and architectural alteration.
The grades include five levels, G0–G4, and the stages include five levels, S0–S4. The patients with EPCI had pathological grade
≤G1 and pathological stage ≤S1, as well as serum ALT <0.68 µkat/L and serum HBV DNA >107 IU/mL every three to four months in at least the past one year and at the date of liver bi- opsy. Patients with ENCI had pathological grade ≤G1 and any pathological stage, as well as serum ALT <0.68 µkat/L and se- rum HBV DNA <2×10⁴ IU/mL every three to four months in at least the past one year and at the date of liver biopsy. Patients with EPCH and ENCH had pathological grade >G1 and/or patho- logical stage >S1, or serum ALT ≥0.68 µkat/L with any level of serum HBV DNA at least once in at least the past one year and at the date of liver biopsy.
We did not include patients who could not be clearly phased, such as those who met the pathological and dynamic biochemi- cal criteria for EPCI but whose serum HBV DNA during serial monitoring and at the date of liver biopsy was ≤107 IU/mL at least once, and those who met the criteria for ENCI but whose serum HBV DNA during serial monitoring and at the date of liver biopsy was >2×10⁴ IU/mL at least once. We also excluded patients with HBV combined with other forms of viral hepatitis, drug-induced liver injuries, significant alcohol consumption (>20 g/day), nonalcoholic fatty liver disease (steatosis >5% of hepa- tocytes), Schistosoma japonicum liver disease, endocrine and metabolic diseases, and blood system diseases, and patients who had accepted therapy with nucleos(t)ides, interferon-alpha, glycyrrhizinate, or matrine/oxymatrine in the last six months.
Ethics
This study was approved by the independent ethics committee of Shanghai Public Health Clinical Center of Fudan University (2013-K-008, 2016-S-046-02). All patients provided written consent before liver biopsy, and all clinical investigations were conducted according to the 2013 Declaration of Helsinki.
Laboratory assays
Fasting blood samples were collected in the morning one week before and after liver biopsy. The serum was separated and stored at -40°C. Serum HBcrAg was measured using a chemilumines- cent enzyme immunoassay LUMIPULSE G1200 automated an- alyzer (Fujirebio, Tokyo, Japan) and auxiliary reagents (Fujirebio, lot number: SAX5031). The linear detection range of HBcrAg is 1–10,000 kU/mL, and a sample was retested at a dilution of 1:100 if HBcrAg exceeded the upper limit of detection (ULD).
Serum HBsAg and HBeAg were measured using a chemilu-
minescent microparticle immunoassay ARCHITECT i2000 auto- mated analyzer (Abbott Laboratories, Chicago, IL, USA) and auxiliary reagents (Abbott, lot number: 82194FN00). The linear detection range of HBsAg is 0.05–250 IU/mL, and a sample was retested at a dilution of 1:500 if HBsAg exceeded the ULD.
The lower limit of detection (LLD) of HBeAg is 1.0 sample-to- cutoff ratio (SCO). Serum HBV DNA was quantified with the Bio- Rad iCycleriQ real-time PCR detection system (Bio-Rad Labora- tories, Berkeley, CA, USA) and the Qiagen PCR kit (Qiagen, Shen- zhen, China, lot number: 20170101/4) with a detection range of 5×10²–5×10⁷ IU/mL.
Serum ALT, aspartate transferase (AST), albumin (ALB), and cholinesterase (ChE) were measured with a Hitachi 7600 auto- mated biochemist analyzer (Hitachi, Tokyo, Japan) and auxiliary reagents. Blood platelets (PLT) were counted using a Sysmex- XT 4000i automated hematology analyzer (Sysmex, Mundelein, IL, USA) and an auxiliary reagent.
Pathological diagnoses
Ultrasound-assisted liver biopsies were performed using a one- sec liver biopsy needle (16G). The biopsy specimens were im- mediately transferred into plastic tubes, snap-frozen, and pro- cessed within 36 hours. A biopsy sample length of at least 10 mm was required for inclusion in this study. Liver pathology was diagnosed independently by one experienced pathologist who was blinded to all serum biochemical and virological parame- ters. The diagnosis was based on the Scheuer standard [15].
Intrahepatic HBsAg and HBcAg were detected by immunohis- tochemistry. Intrahepatic HBsAg and HBcAg expression levels were scored as 0, 1, 2, and 3 according to proportions of immu- nolabelled cells of 0%,<5%, 25–49%, and >50%, respectively.
Statistical analyses
A two-independent samples Mann-Whitney U test was used to assess differences in age, serum biochemical parameters, and serum virological markers between EPCI and EPCH and between ENCI and ENCH. Pearson’s chi-square test was used to evaluate differences in frequencies in different liver pathological grades and stages, and in different intrahepatic HBsAg and HBcAg scores between EPCI and EPCH and between ENCI and ENCH.
Spearman’s rank correlation analysis was used to analyze the correlations between serum HBcrAg and biochemical parame- ters, and other serum virological markers, and between serum HBcrAg and liver pathological grade and stage, and intrahepatic HBsAg and HBcAg score. The ROC curve was used to evaluate the performance of serum HBcrAg and other serum virological
markers for predicting EPCH and ENCH. A two paired-sample Delong Z-test was used to evaluate differences in areas under ROC curves (AUCs) of serum HBcrAg and other serum virologi- cal markers for predicting EPCH and ENCH. The optimal cutoff and the tradeoff cutoff were determined with reference to the maximum sum and the minimum difference in sensitivity and specificity of the same cutoff, respectively. P <0.05 (two-tailed) was considered statistically significant. MedCalc version 15.8 (MedCalc Software, Mariakerke, Belgium) was used for statisti- cal analyses.
RESULTS
Clinical, biochemical,and pathological characteristics of study population
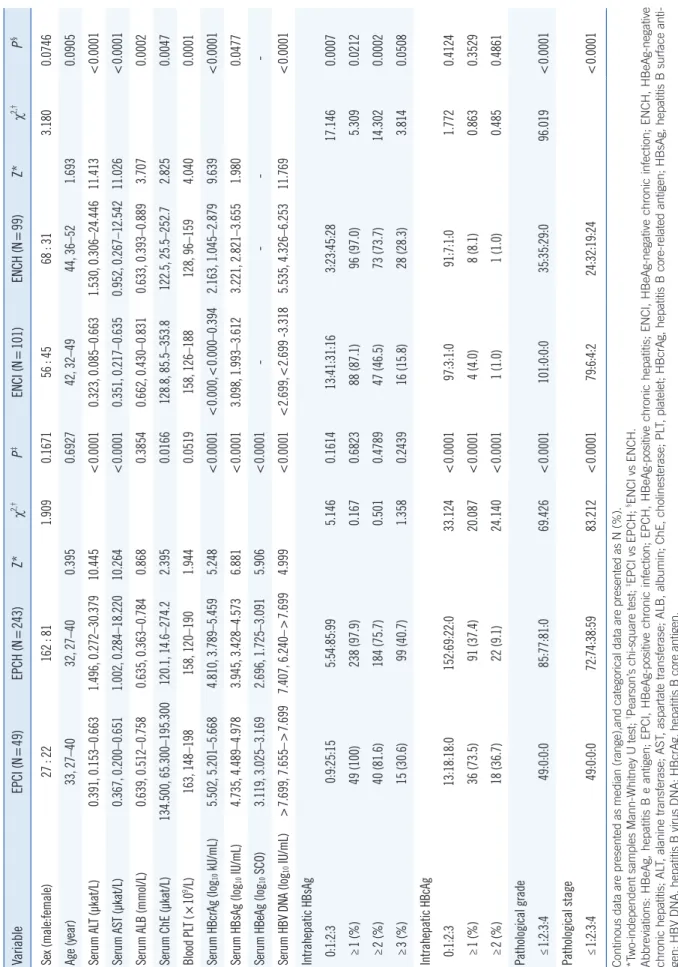
The clinical, laboratory and pathological data of the study popu- lation are summarized in Table 1.
Virological markers during different phases of chronic HBV infection
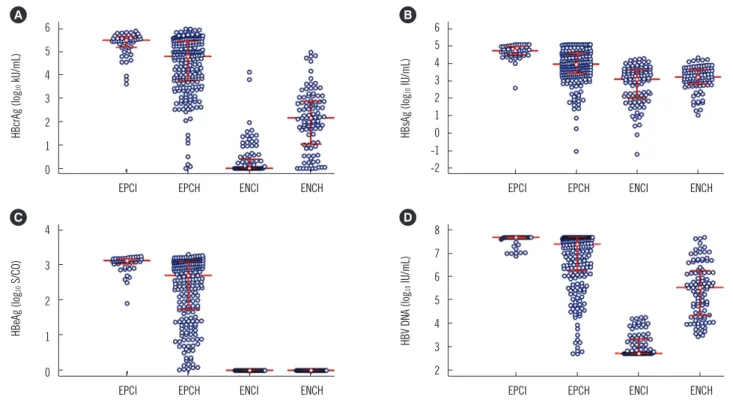
The distributions of serum HBcrAg, HBsAg, HBeAg, and HBV DNA were illustrated in Fig. 1A-D, respectively. The frequencies of serum HBcrAg higher than 100 times the ULD in EPCI and EPCH were 0.00% (0/49) and 0.82% (2/243), respectively, and lower than the LLD in ENCI and ENCH were 61.39% (62/101) and 7.07% (7/99), respectively (Fig. 1A). The frequencies of se- rum of serum HBsAg higher than 500 times the ULD in EPCI and EPCH were 12.24% (6/49) and 5.76% (14/243), respec- tively (Fig. 1B). The frequencies of serum HBV DNA higher than the ULD in EPCI and EPCH were 71.43% (35/49) and 37.45%
(91/243), respectively (Fig. 1D), and lower than the LLD in ENCI and ENCH were 51.49% (52/101) and 0% (0/99), respectively (Fig. 1D).
The differences in median serum HBcrAg, HBsAg, and HBV DNA, and in frequencies of intrahepatic HBsAg and HBcAg scores between EPCI and EPCH and between ENCI and ENCH are summarized in Table 1.
The frequencies of intrahepatic HBsAg ≥1 and ≥2 in EPCI were higher than those in ENCI (χ2=5.375, P =0.0204 and χ2= 15.275, P =0.0001, respectively); and of intrahepatic HBcAg
≥1, ≥2, and ≥3 in EPCI were also higher than those in ENCI (χ2=77.999, P <0.0001, χ2=34.944, P <0.0001, and χ2=17.340, P <0.0001, respectively). The frequencies of different intrahepatic HBsAg scores in EPCH were not different from those in ENCH (χ2=5.287, P =0.1520), while of intrahepatic HBcAg score ≥1 and ≥2 in EPCH were higher than those in ENCH (χ2=28.086,
Table 1.Clinical, biochemical, virological, and pathological characteristics of the study population VariableEPCI (N=49)EPCH (N=243)Z*χ2,†P‡ENCI (N=101)ENCH (N=99)Z*χ2,†P§ Sex (male:female)27 : 22162 : 811.9090.167156 : 4568 : 313.1800.0746 Age (year)33, 27–4032, 27–400.3950.692742, 32–4944, 36–521.6930.0905 Serum ALT (µkat/L)0.391, 0.153–0.6631.496, 0.272–30.37910.445<0.00010.323, 0.085–0.6631.530, 0.306–24.44611.413<0.0001 Serum AST (µkat/L)0.367, 0.200–0.6511.002, 0.284–18.22010.264<0.00010.351, 0.217–0.6350.952, 0.267–12.54211.026<0.0001 Serum ALB (mmol/L)0.639, 0.512–0.7580.635, 0.363–0.7840.8680.38540.662, 0.430–0.8310.633, 0.393–0.8893.7070.0002 Serum ChE (µkat/L)134.500, 65.300–195.300120.1, 14.6–274.22.3950.0166128.8, 85.5–353.8122.5, 25.5–252.72.8250.0047 Blood PLT (×109/L)163, 148–198158, 120–1901.9440.0519158, 126–188128, 96–1594.0400.0001 Serum HBcrAg (log10 kU/mL)5.502, 5.201–5.6684.810, 3.789–5.4595.248<0.0001<0.000,<0.000–0.3942.163, 1.045–2.8799.639<0.0001 Serum HBsAg (log10 IU/mL)4.735, 4.489–4.9783.945, 3.428–4.5736.881<0.00013.098, 1.993–3.6123.221, 2.821–3.6551.9800.0477 Serum HBeAg (log10 SCO)3.119, 3.025–3.1692.696, 1.725–3.0915.906<0.0001---- Serum HBV DNA (log10 IU/mL)>7.699, 7.655–>7.6997.407, 6.240–>7.6994.999<0.0001<2.699,<2.699 -3.3185.535, 4.326–6.25311.769<0.0001 Intrahepatic HBsAg 0:1:2:30:9:25:155:54:85:995.1460.161413:41:31:163:23:45:2817.1460.0007 ≥1 (%)49 (100)238 (97.9)0.1670.682388 (87.1)96 (97.0)5.3090.0212 ≥2 (%)40 (81.6)184 (75.7)0.5010.478947 (46.5)73 (73.7)14.3020.0002 ≥3 (%)15 (30.6)99 (40.7)1.3580.243916 (15.8)28 (28.3)3.8140.0508 Intrahepatic HBcAg 0:1:2:313:18:18:0152:69:22:033.124<0.000197:3:1:091:7:1:01.7720.4124 ≥1 (%)36 (73.5)91 (37.4)20.087<0.00014 (4.0)8 (8.1)0.8630.3529 ≥2 (%)18 (36.7)22 (9.1)24.140<0.00011 (1.0)1 (1.0)0.4850.4861 Pathological grade ≤1:2:3:449:0:0:085:77:81:069.426<0.0001101:0:0:035:35:29:096.019<0.0001 Pathological stage ≤1:2:3:449:0:0:072:74:38:5983.212<0.000179:6:4:224:32:19:24<0.0001 Continous data are presented as median (range),and categorical data are presented as N (%). *Two-independent samples Mann-Whitney U test; †Pearson’s chi-square test; ‡EPCI vs EPCH; §ENCI vs ENCH. Abbreviations: HBeAg, hepatitis B e antigen; EPCI, HBeAg-positive chronic infection; EPCH, HBeAg-positive chronic hepatitis; ENCI, HBeAg-negative chronic infection; ENCH, HBeAg-negative chronic hepatitis; ALT, alanine transferase; AST, aspartate transferase; ALB, albumin; ChE, cholinesterase; PLT, platelet; HBcrAg, hepatitis B core-related antigen; HBsAg, hepatitis B surface anti- gen; HBV DNA, hepatitis B virus DNA; HBcrAg, hepatitis B core antigen.
P <0.0001 and χ2=6.029, P =0.0141, respectively).
Correlation of HBcrAg with biochemical parameters, other virological markers, and pathological states
The Spearman’s correlation coefficients of serum HBcrAg with Fig. 1. Distribution of serum virological markers in the four phases of chronic HBV infection. (A) HBcrAg. (B) HBsAg. (C) HBeAg. (D) HBV DNA. The middle horizontal red line represents the median; the upper and lower horizontal red lines represent the quartiles.
Abbreviations: HBcrAg, hepatitis B core-related antigen; HBsAg, hepatitis B surface antigen; HBeAg, hepatitis B e antigen; HBV DNA, hepatitis B virus DNA;
HBV, hepatitis B virus; EPCI, HBeAg-positive chronic infection; EPCH, HBeAg-positive chronic hepatitis; ENCI, HBeAg-negative chronic infection; ENCH, HBeAg-negative chronic hepatitis.
6 5 4 3 2 1 0
EPCI EPCH ENCI ENCH HBcrAg (log10 kU/mL)
A 6
5 4 3 2 1 0 -1 -2
EPCI EPCH ENCI ENCH
HBsAg (log10 IU/mL)
B
4
3
2
1
0
EPCI EPCH ENCI ENCH HBeAg (log10 S/CO)
C 8
7 6 5 4 3 2
EPCI EPCH ENCI ENCH
HBV DNA (log10 IU/mL)
D
Table 2. Spearman’s correlation coefficients of HBcrAg with biochemical parameters, other virological markers, and pathological states
Variable EPCI (N=49) EPCH (N=243) ENCI (N=101) ENCH (N=99)
rs P rs P rs P rs P
Serum ALT -0.113 0.4375 0.165 0.0098 0.040 0.6919 0.384 0.0001
Serum AST 0.043 0.7698 0.024 0.7046 0.064 0.5237 0.488 <0.0001
Serum ALB 0.190 0.1919 0.182 0.0045 -0.052 0.6036 -0.266 0.0078
Serum ChE -0.121 0.4061 0.263 <0.0001 0.019 0.8480 -0.325 0.0010
Serum HBsAg 0.431 0.0020 0.617 <0.0001 0.433 <0.0001 0.216 0.0320
Serum HBeAg 0.411 0.0033 0.744 <0.0001 - - - -
Serum HBV DNA 0.291 0.0421 0.578 <0.0001 0.141 0.1589 0.651 <0.0001
Intrahepatic HBsAg -0.093 0.5266 0.200 0.0018 0.393 <0.0001 0.050 0.6253
Intrahepatic HBcAg 0.112 0.4456 0.390 <0.0001 -0.0312 0.7569 0.124 0.2256
Pathological grade - - -0.309 <0.0001 - - 0.276 0.0057
Pathological stage - - -0.374 <0.0001 0.246 0.0132 0.283 0.0046
Abbreviations: HBeAg, hepatitis B e antigen; EPCI, HBeAg-positive chronic infection; EPCH, HBeAg-positive chronic hepatitis; ENCI, HBeAg-negative chronic infection; ENCH, HBeAg-negative chronic hepatitis; ALT, alanine transferase; AST, aspartate transferase; ALB, albumin; ChE, cholinesterase; HBcrAg, hepatitis B core-related antigen; HBsAg, hepatitis B surface antigen; HBV DNA, hepatitis B virus DNA; HBcrAg, hepatitis B core antigen.
serum biochemical parameters and other HBV markers, intra- hepatic HBsAg and HBcAg, and liver pathological grade and stage in different phases are summarized in Table 2.
AUCs of HBcrAg, HBsAg, and HBV DNA for predicting EPCH and ENCH
The ROC curves of HBcrAg, HBsAg, and HBV DNA for predict- ing EPCH and ENCH were illustrated in Fig. 2A and 2B, respec- tively, and the AUCs of those were described in Fig. 2C and 2D, respectively.
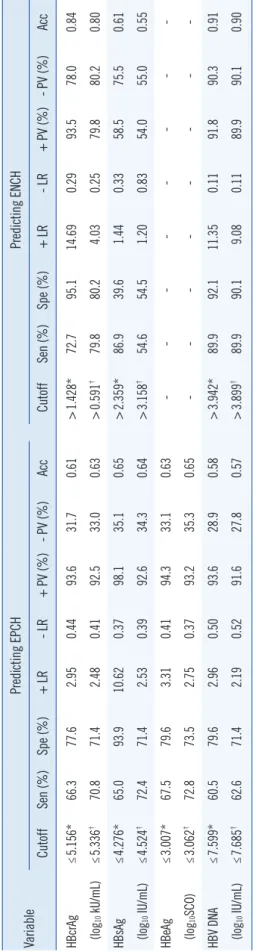
Performance of HBcrAg, HBsAg, and HBV DNA in predicting EPCH and ENCH
The corresponding diagnostic parameters based on the optimal cutoffs and tradeoff cutoffs of serum HBcrAg, HBsAg, and HBV DNA in predicting EPCH and ENCH were summarized in Table 3.
DISCUSSION
We investigated changes in serum HBcrAg in different phases of chronic HBV infection and their relationships with serum bio- chemical parameters, liver pathological states, and other serum
and intrahepatic virological markers. We also evaluated the per- formance of serum HBcrAg in predicting EPCH and ENCH (com- pared with HBsAg, and HBV DNA), and we determined clini- cally valuable tradeoff cutoffs of serum HBcrAg for distinguish- ing the different phases.
Seto et al. [13] reported that serum HBcrAg had no signifi- cant correlation with serum ALT in all four phases of chronic HBV infection. Maasoumy et al. [14] reported that serum HB- crAg had a significant positive correlation with serum ALT and AST in only ENCH. However, neither of these studies evaluated the correlation between serum HBcrAg and liver pathological states. In our study, serum HBcrAg had no correlation with liver pathological grade and stage in EPCI, but it had a weak negative correlation with pathological grade and stage in EPCH; serum HBcrAg had a weak positive correlation with pathological stage in ENCI, and it had a weak positive correlation with pathological grade and stage in ENCH. These findings suggested that the quantitative change in serum HBcrAg in the HBeAg-positive stage is opposite to that in the HBeAg-negative stage during liver injury and fibrosis progression.
Seto et al. [13] and Maasoumy et al. [14] demonstrated that serum HBcrAg had a significant positive correlation with serum Fig. 2. ROC curves and AUCs of serum virological markers for predicting EPCH and ENCH. (A) ROC curves for predicting EPCH. (B) ROC curves for predicting ENCH. (C) AUCs for predicting EPCH. (D) AUCs for predicting ENCH.
*Z=2.072; P =0.0383; †Z=3.115; P =0.0018; ‡Z=7.168; P <0.0001; §Z=4.128; P <0.0001; llZ=9.837; P <0.0001.
Abbreviations: HBcrAg, hepatitis B core-related antigen; HBsAg, hepatitis B surface antigen; HBeAg, hepatitis B e antigen; HBV DNA, hepatitis B virus DNA;
AUC, area under ROC curve; SE, standard error; 95%CI, 95% confidence interval; EPCH, HBeAg-positive chronic hepatitis; ENCH, HBeAg-negative chronic hepatitis.
100
80
60
40
20
0
0 20 40 60 80 100 100-Specificity
Sensitivity
A
HBcrAg HBsAg HBeAg HBV DNA
100
80
60
40
20
0
0 20 40 60 80 100 100-Specificity
Sensitivity
B
C D
HBcrAg HBsAg HBV DNA
Table 3. Reference cutoffs and the corresponding diagnostic parameters of serum virological markers in predicting EPCH and ENCH VariablePredicting EPCHPredicting ENCH CutoffSen (%)Spe (%)+ LR- LR+ PV (%)- PV (%)AccCutoffSen (%)Spe (%)+ LR- LR+ PV (%)- PV (%)Acc HBcrAg≤5.156*66.377.62.950.4493.631.70.61 >1.428*72.795.114.690.2993.578.00.84 (log10 kU/mL)≤5.336† 70.871.42.480.4192.533.00.63 >0.591† 79.880.24.030.2579.880.20.80 HBsAg≤4.276*65.093.910.620.3798.135.10.65 >2.359*86.939.61.440.3358.575.50.61 (log10 IU/mL)≤4.524†72.471.42.530.3992.634.30.64 >3.158†54.654.51.200.8354.055.00.55 HBeAg≤3.007*67.579.63.310.4194.333.10.63 --- (log10SCO)≤3.062† 72.873.52.750.3793.235.30.65 --- HBV DNA ≤7.599*60.579.62.960.5093.628.90.58 >3.942*89.992.111.350.1191.890.30.91 (log10 IU/mL)≤7.685†62.671.42.190.5291.627.80.57 >3.899†89.990.19.080.1189.990.10.90 *Optimal cutoffs; †Tradeoff cutoffs. Abbreviations: HBcrAg, hepatitis B core-related antigen; HBsAg, hepatitis B surface antigen; HBeAg, hepatitis B e antigen; HBV DNA, hepatitis B virus DNA; EPCH, HBeAg-positive chronic hepati- tis; ENCH, HBeAg-negative chronic hepatitis; Sen, sensitivity; Spe, specificity; + LR, positive likelihood rate; LR, negative likelihood rate; + PV, positive predictive value; - PV, negative predictive val- ue; acc, accuracy; SCO, signal to cutoff ratio.
HBsAg and HBV DNA in all four phases. We obtained similar results; however, neither of these studies evaluated the correla- tions of serum HBcrAg with intrahepatic HBsAg and HBcAg. In our study, serum HBcrAg had no correlation with intrahepatic HBsAg and HBcAg in EPCI, but it had a weak positive correla- tion with intrahepatic HBsAg and HBcAg in EPCH. Further, se- rum HBcrAg had a weak positive correlation with intrahepatic HBsAg, but it showed no correlation with intrahepatic HBcAg in ENCI, and it had no correlation with intrahepatic HBsAg and HBcAg in ENCH. These findings indicate that the quantitative change in serum HBcrAg remains substantially synchronized with the changes in serum HBsAg and HBV DNA, and essen- tially in the same direction as intrahepatic HBsAg and HBcAg, irrespective of HBeAg status.
Previous studies [6, 13, 14, 16] as well as our own results in- dicated that serum virological markers showed the highest lev- els in EPCI and differentiated decrease in EPCH, with HBsAg showing the strongest decrease, followed by HBeAg, HBcrAg, and HBV DNA; however, these markers showed the lowest lev- els in ENCI and differentiated increases in ENCH, with HBV DNA showing the strongest increase, followed by HBcrAg and HB- sAg. Our study also indicated that intrahepatic HBsAg and HB- cAg showed the highest expression in EPCI and differentiated reductions in EPCH, with the reduction in HBcAg being more significant than that in HBsAg; In contrast, intrahepatic HBsAg exhibited low expression, and intrahepatic HBcAg was close to
“zero” expression in ENCI. They showed differentiated increases in ENCH, with the increase in HBsAg being more significant than that in HBcAg.
There were reverse changes in quantitative and semi-quanti- tative virological markers between HBeAg-positive and HBeAg- negative patients and differential changes in those within HBeAg- positive and HBeAg-negative patients. It suggested that the viro- logical and immunological pathogeneses in the onset and pro- gression of disease differ between the HBeAg-positive and HBeAg- negative stages, in which HBsAg might play an important im- mune regulatory role [17, 18]. HBcrAg, including HBcAg and HBeAg, might be the primary target of the immune response [19]. In the HBeAg-positive stages, the overexpression of HB- sAg might lead to immune exhaustion against HBV antigen [20], and hepatitis activation might arise from the spontaneous dec- rement of HBV replication and HBsAg expression, resulting in the initial activation of an immune response mainly against HB- crAg, accompanied by increased liver injury and progressed fi- brosis and decreased HBV replication and antigen expression.
The initial activation of the immune response continues until
HBeAg is significantly reduced or seroconverted and maintains the immune response against HBcrAg. In the HBeAg-negative stages, the low to near “zero” expression of HBcrAg might lead to HBV antigen immune ignorance, and hepatitis activation might arise from the opportunistic increase in HBV replication and HBcrAg expression, resulting in the re-activation of an immune response mainly against HBcrAg accompanied by increased liver re-injury and progressed re-fibrosis, and again decrease HBV replication and antigen expression. The re-activation of the immune response continues until HBsAg is significantly reduced or seroconverted and maintains the immune response against HBcrAg and HBsAg.
Gou et al. [21] compared the performance of serum HBcrAg and HBsAg for predicting EPCI and ENCI using a small number of samples, where the difference in AUCs between serum HB- crAg and serum HBsAg for predicting EPCI was not statistically significant, but that for predicting ENCI was. However, they did not provide information on serum HBV DNA for predicting EPCI and ENCI. Our study indicated that serum HBcrAg, HBsAg, and HBV DNA could predict EPCH and ENCH. Among those, the largest AUCs were of serum HBsAg for predicting EPCH and of serum HBV DNA for predicting ENCH. The AUC of serum HB- crAg for predicting EPCH was significantly smaller than that of serum HBsAg, and was not significantly larger than that of se- rum HBV DNA. In contrast, the AUC for predicting ENCH was significantly smaller than that of serum HBV DNA and signifi- cantly larger than that of serum HBsAg. These data suggest that serum HBcrAg might be an important surrogate marker in pre- dicting EPCH and ENCH.
Our study had some limitations. First, it was a cross-sectional study, not a longitudinal study, which generally yields stronger evidence. Second, we did not explore relationships between se- rum HBcrAg and HBV genotypes, serum and intrahepatic HBV RNA, and intrahepatic HBV covalently closed circular DNA. Third, we did not investigate the relationship between serum HBcrAg and quantitative serum anti-HBc.
In conclusion, serum HBcrAg, HBsAg, and HBV DNA display a differentiated decrease from EPCI to EPCH, in which the de- crease in HBcrAg is smaller than that in HBsAg and larger than that in HBV DNA. In contrast, serum HBcrAg, HBsAg, and HBV DNA show differentiated increases from ENCI to ENCH, in which the increase in HBcrAg is larger than that in HBsAg and smaller than that in HBV DNA. Although serum HBsAg and serum HBV DNA performed best in predicting EPCH and ENCH, respec- tively, serum HBcrAg is an important surrogate marker for pre- dicting EPCH and ENCH.
Authors’ Disclosures of Potential Conflicts of Interest
The authors declare that they have no conflict of interest.
Acknowledgment
This work was supported by the “12th Five-year” National Science and Technology Major Project of China (2013ZX10002005), National Natural Science Foundation (81671998), Shanghai Science and Technology Commission (16411960100), and Key Scientific Research Project of the Shanghai Municipal Health and Family Planning Commission (20134032). The funders had no role in study design, data collection and analysis, deci- sion to publish, or preparation of the manuscript.
Author Contributions
Zhan-qing Zhang conceived and designed the study. Yan-bing Wang and Wei Lu collated the data. Dan-ping Liu, Bi-sheng Shi, and Xiao-nan Zhang conducted the experiments. Zhan-qing Zhang analyzed the data. Yan-bing Wang, Wei Lu, Dan Huang, Xiu-fen Li, Xin-lan Zhou, Rong-rong Ding, and Zhan-qing Zhang coordinated the collection of human materials. Zhan-qing Zhang and Dan-ping Liu wrote the manuscript. Zhan-qing Zhang criti- cally revised the manuscript.
REFERENCES
1. European Association for the Study of the Liver. EASL 2017 Clinical Prac- tice Guidelines on the management of hepatitis B virus infection. J Hep- atol 2017;67:370-98.
2. Terrault NA, Bzowej NH, Chang KM, Hwang JP, Jonas MM, Murad MH, et al. AASLD guidelines for treatment of chronic hepatitis B. Hepatology 2016;63:261-83.
3. Sarin SK, Kumar M, Lau GK, Abbas Z, Chan HLY, Chen CJ, et al. Asian- Pacific clinical practice guidelines on the management of hepatitis B: a 2015 update. Hepatol Int 2016;10:1-98.
4. European Association for the Study of the Liver. EASL clinical practice guidelines: management of chronic hepatitis B virus infection. J Hepa- tol 2012;57:167-85.
5. Wang L, Zou ZQ, Wang K, Yu JG, Liu XZ. Role of serum hepatitis B vi- rus marker quantitation to differentiate natural history phases of HBV infection. Hepatol Int 2016;10:133-8.
6. Cornberg M, Wong VW, Locarnini S, Brunetto M, Janssen HLA, Chan HL. The role of quantitative hepatitis B surface antigen revisited. J Hep- atol 2017;66:398-411.
7. Jia W, Song LW, Fang YQ, Wu XF, Liu DY, Xu C, et al. Antibody to hepa- titis B core antigen levels in the natural history of chronic hepatitis B: a prospective observational study. Medicine 2014;93:e322.
8. Song LW, Liu PG, Liu CJ, Zhang TY, Cheng XD, Wu HL, et al. Quantita-
tive hepatitis B core antibody levels in the natural history of hepatitis B virus infection. Clin Microbiol Infect 2015;21:197-203.
9. Yuan Q, Song LW, Cavallone D, Moriconi F, Cherubini B, Colombatto P, et al. Total hepatitis B core antigen antibody, a quantitative non-invasive marker of hepatitis B virus induced liver disease. Plos One 2015;10:
e130209.
10. Rokuhara A, Tanaka E, Matsumoto A, Kimura T, Yamaura T, Orii K, et al. Clinical evaluation of a new enzyme immunoassay for hepatitis B vi- rus core-related antigen; a marker distinct from viral DNA for monitoring lamivudine treatment. J Viral Hepat 2003;10:324-30.
11. Suzuki F, Miyakoshi H, Kobayashi M, Kumada H. Correlation between serum hepatitis B virus core-related antigen and intrahepatic covalently closed circular DNA in chronic hepatitis B patients. J Med Virol 2009;
81:27-33.
12. Kimura T, Ohno N, Terada N, Rokuhara A, Matsumoto A, Yagi S, et al.
Hepatitis B virus DNA-negative Dane particles lack core protein but contain a 22-kDa precore protein without C-terminal arginine-rich do- main. J Biol Chem 2005;280:21713-9.
13. Seto WK, Wong DK, Fung J, Huang FY, Liu KS, Lai CL, et al. Linearized hepatitis B surface antigen and hepatitis B core-related antigen in the natural history of chronic hepatitis B. Clin Microbiol Infect 2014;20:1173- 80.
14. Maasoumy B, Wiegand SB, Jaroszewicz J, Bremer B, Lehmann P, De- terding K, et al. Hepatitis B core-related antigen (HBcrAg) levels in the natural history of hepatitis B virus infection in a large European cohort
predominantly infected with genotypes A and D. Clin Microbiol Infect 2015;21:606.e1-e10.
15. Brunt EM. Grading and staging the histopathological lesions of chronic hepatitis: the Knodell histology activity index and beyond. Hepatology 2000;31:241-6.
16. Martinot-Peignoux M, Carvalho-Filho R, Lapalus M, Netto-Cardoso AC, Lada O, Batrla, R et al. Hepatitis B surface antigen serum level is asso- ciated with fibrosis severity in treatment-naïve, e antigen-positive patients.
J Hepatol 2013;58:1089-95.
17. Lebossé F, Testoni B, Fresquet J, Facchetti F, Galmozzi E, Fournier M, et al. Intrahepatic innate immune response pathways are downregulat- ed in untreated chronic hepatitis B. J Hepatol 2017;66:897-909.
18. Kondo Y, Ninomiya M, Kakazu E, Kimura O, Shimosegawa T. Hepatitis B surface antigen could contribute to the immunopathogenesis of hep- atitis B virus infection. ISRN Gastroenterol 2013;2013:935295.
19. Zhang ZQ, Lu W, Wang YB, Weng QC, Zhang ZY, Yang ZQ, et al. Mea- surement of the hepatitis B core-related antigen is valuable for predict- ing the pathological status of liver tissues in chronic hepatitis B patients.
J Virol Methods 2016;235:92-8.
20. Horst AK, Neumann K, Diehl L, Tiegs G. Modulation of liver tolerance by conventional and nonconventional antigen-presenting cells and reg- ulatory immune cells. Cell Mol Immunol 2016;13:277-92.
21. Gou Y, Zhao Y, Rao C, Feng S, Wang T, Li D, et al. Predictive value of hepatitis B core-related antigen (HBcrAg) during the natural history of hepatitis B virus infection. Clin Lab 2017;63:1063-70.