Environmental Science
Vol. 37, No. 3, pp. 193-205, September, 2021 https://doi.org/10.7747/JFES.2021.37.3.193
Assessment of The Above-Ground Carbon Stock and Soil Physico-Chemical Properties of an Arboretum within The University of Port Harcourt, Nigeria
Enimhien Faith Akhabue*, Uzoma Darlington Chima and Funmilayo Sarah Eguakun Department of Forestry and Wildlife Management, University of Port Harcourt, Port Harcourt 500001, Nigeria
Abstract
The importance of forests and trees in climate change mitigation and soil nutrient cycling cannot be overemphasized.
This study assessed the above-ground carbon stock of two exotic and two indigenous tree species – Gmelina arborea, Tectona grandis, Khaya grandifoliola and Nauclea diderrichii and their litter impact on soil nutrient content of an arboretum within the University of Port Harcourt, Nigeria. Data were collected from equal sample plots from the four species’ compartments. Tree growth variables including total height, diameter at breast height, crown height, crown diameter and merchantable height were measured for the estimation of above-ground carbon stock. Soil samples were collected from a depth of 0-30 cm from each compartment and analyzed for particle size distribution, organic carbon, total nitrogen, available phosphorus, exchangeable bases, exchangeable acidity, cation exchange capacity, base saturation, pH, Manganese, Iron, Copper and Zinc. Analysis of Variance (ANOVA) was used to test for significant difference (p<0.05) in the carbon contents of the four species and the soil nutrient contents of the different species’ compartments. Pearson correlation was used to assess the relationships between the carbon contents, growth parameters and soil parameters.
The highest and lowest carbon stock per hectare was observed for G. arborea (151.52 t.ha-1) and K. grandifoliola (45.45 t.ha-1) respectively. Cation exchange capacity and base saturation were highest and lowest for soil under G. arborea and K. grandifoliola respectively. The pH was highest and lowest for soil under G. arborea and T. grandis respectively.
Carbon stock correlated positively with dbh, crown diameter, merchantable height and Zn and negatively with base saturation. The study revealed that G. arborea and N. diderrichii can effectively be used for reforestation and afforestation programmes aimed at climate change mitigation across Nigeria. Therefore, policies to encourage and enhance their planting should be encouraged.
Key Words: aboveground biomass, carbon stock, plantation forest, soil properties, tree growth
Received: December 30, 2020. Revised: July 8, 2021. Accepted: July 8, 2021.
Corresponding author: Enimhien Faith Akhabue
Department of Forestry and Wildlife Management, University of Port Harcourt, Port Harcourt 500001, Nigeria Tel: +2347034911305, E-mail: [email protected]
Introduction
Trees play a crucial role in minimizing atmospheric carbon. They serve as an important storehouse for carbon dioxide (CO2) by capturing and storing carbon to form
biomass. The most abundant greenhouse gas released by humans is CO2 (Fayolle et al. 2013), and developmental ac- tivities including other human actions are causing the quan- tity of air pollutants like greenhouse gases, especially CO2
to rise (Chavan and Rasal 2010). These are causing an in-
crease in air temperature, by confining heat radiation wavelength in the air; a phenomenon described as global warming.
During plant growth, carbon is captured in the process of new cell formation and oxygen released. This means that, as plant biomass experiences growth, the quantity of carbon trapped in a tree is increased.
Human activities like management practices on forests and plantations influence CO2 source/sink pattern through fossil fuel emissions and harvesting/utilization of biomass (Nowak et al. 2002). Ecosystems such as native forests, plantations, agroforestry operations and other activities re- lated to agriculture represent a storehouse for CO2, via photosynthesis (Benites et al. 1999; Nowak and Crane, 2002; Thangata and Hildebran 2012). They scale back the quantity of CO2 in the atmosphere, and also bring benefit to global atmospheric condition (Kort and Turnock 1998).
Tropical tree plantations are important features of carbon cycle since they can be manipulated by humans as a carbon storehouse and can scale back the effects of deforestation (Houghton et al. 1983). Aside from their relevance in car- bon sequestration, plantation forests are also important in the provision of other services such as recreation, erosion control, water quality control, rehabilitation of degraded lands, etc. (Lamb et al. 2005). According to Aba et al.
(2017), several establishments of Jatropha plantations in different countries have improved the number of carbon sinks, income generation and sustainable living in most ru- ral communities. The quantity of carbon that can be cap- tured and thereof released to the atmosphere changes great- ly considering the state of the plantation (Gibbs et al. 2007).
Soils are controlled by vegetation, climate, parent materi- al, and other organisms. They form the basis for physical support, nutrient supply and moisture for growth, and store elements that are recycled back to trees (Boyle and Powers 2013). Plantations are also known to influence soil proper- ties like nutrient content, soil moisture, soil organic matter, soil pH, soil temperature etc. (Choudhary et al. 2019).
Litter fall represents one of the many carbon pools present in a forest ecosystem. It is a crucial link for the movement of carbon and nutrients between the plants and the soil.
Therefore, litter fall and nutrient dynamics influence below ground processes (Sayer et al. 2011).
The capture and distribution of CO2 to respiration and biomass components is influenced by components like soil,
water availability, nitrogen levels, temperature, age, and measure of atmospheric gases (Gower and Ahl 2006).
Therefore, the ability and measure in which individual trees capture and store atmospheric carbon as biomass may vary greatly with difference in species, soil, and geographic areas.
Carbon sequestration projects could improve knowledge of forest sustainability (Tschakert 2001). According to Vashum and Jayakumar (2012), assessment of the accumu- lated biomass of a plantation is relevant for determining the measure of its productiveness. It also suggests the possible quantity of carbon that could be released if they are destroyed. Biomass accumulation is directly connected to forest’s potential to store carbon. When a plantation is cleared, especially with fire, the carbon accumulated over time is quickly transformed to CO2 and then emitted again to the atmosphere, and it takes years to put back the carbon released through deforestation (Aba et al. 2017). A detailed and accurate estimation of biomass is equally important for applications such as extraction of timber.
There is paucity of information on the above-ground carbon stock of T. grandis, G. arborea, N. diderrichii and K. grandifoliola, to discover their capacities to store carbon.
This study provided information on the above-ground car- bon stock of four tree species in an arboretum of which two are indigenous (N. diderrichii and K. grandifoliola) and two exotic (T. grandis and G. arborea) species and as such determined their carbon sequestration capacities. It also provided information on soil physico-chemical properties of soil under the four species’ compartments in the arboretum. The specific objectives were to quantify carbon stored in the biomass of T. grandis, G. arborea, N. di- derrichii and K. grandifoliola, respectively, eight years after the establishment of the arboretum and to ascertain the physico-chemical properties of soil under each of the spe- cies’ compartments. It also determined if a relationship ex- ists between the aboveground biomass carbon, soil organic carbon, soil chemical properties, soil physical properties and tree growth parameters.
Materials and Methods
Study area
This study was carried out in the Department of Forestry
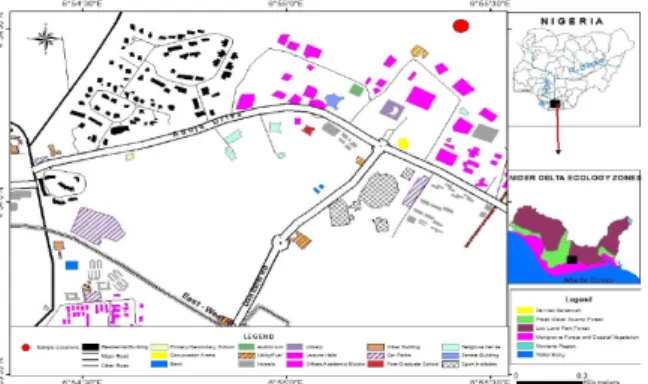
Fig. 1. Map of University of Port Harcourt indicating the study site.
and Wildlife Management Arboretum, University of Port Harcourt, Rivers State, Nigeria. The University is situated on a 400 hectares of land in Obio/Akpor Local Government Area (Latitude 4.90794 and longitude 6.92413) (Chima et al. 2016). The location is distinguished with the dry and wet seasons (Aiyeloja et al. 2014). The arboretum covers a total area of about 15,996.90 m² with seven compartments consisting of species including Gmelina arborea, Tectona grandis, Khaya grandifoliola, Nuclea diderrichii, Irvingia gabonensis, Entandrophragma cylindricum, Terminalia ivorensis, Ricinodendron heudelotti, Treculia africana, Garcinia kola, Persea americana and Anona muricata. Apart from the tree species present, the arboretum also con- tains various species of shrubs, herbs and climbers. T. gran- dis occupies an area of 2,493.73 m2 with a planting distance of 2.5 m×2.5 m, G. arborea covers an area of 475 m2 with planting distance of 2.5 m×2.5 m, N. diderrichii covers 800 m2 with planting distance of 4 m×4 m while K. grandi- foliola covers an area of 296.80 m2 with planting distance of 4 m×4 m. G. arborea, T. grandis, K. grandifoliola, and N.
diderrichii present in the arboretum were all established in the same year - 2011 (Chima et al. 2016) and that informed the choosing of the four species for this study. Fig. 1 is the map of the University of Port Harcourt showing the study site.
Sampling technique
T. grandis, G. arborea, N. diderrichii and K. grandi- foliola compartments were selected for this research based on their origin, age and availability. A sample plot of 16.489 m×8 m was mapped out from each of the compartments
for data collection. This plot size was the total area for the smallest species compartment and therefore was adopted for the other compartments to enable the comparison of results. Total enumeration of trees in the sample plot of each compartment was carried out for above-ground carbon stock assessment.
Measurement and computation of tree growth variables
The total, merchantable and crown height for each tree present in the sampled plots for all compartments were measured individually using a clinometer. Tree crown di- ameter and girth at breast height of all the trees present in the sampled plot for each species compartment were meas- ured using a measuring tape. The diameter at breast height was then estimated from the measured girths using:
DBH= c=circumference π=3.142
Computation of above-ground biomass (AGB) and carbon stock
AGB was calculated using the formula:
AGB=Volume×Density
V=DBH2×H (Pascal 1988; Huy et al. 2016) Where: V=volume,
DBH=diameter at breast height H=total height
Specific wood density of individual species was gotten from the Global Wood Density Database (Chave et al.
2009; Zanne et al. 2009).
The above-ground carbon stock for each species was evaluated by multiplying the above-ground biomass with the carbon fraction (CF):
Carbon stock=AGB×CF
The default value for the CF is 0.50 as it is noted that 50 percent of tree biomass forms the carbon stock (Ravindranath et al. 1997; Hetland et al. 2016; Jew et al. 2016).
Collection of soil samples
Soil samples were collected from 0-30 cm at nine ran- domly selected points around the core of the sampled plot in each species compartment using an auger. Before the col-
Table 2. Volume, above-ground biomass and carbon stock of species per hectare
Variables Khaya grandifoliola Nauclea diderrichii Gmelina arborea Tectona grandis
Volume (m3ha-1) 146.97 266.67 630.3 254.55
AGB (t.ha-1) 91.67 172.73 302.27 140.15
Carbon stock (t.ha-1) 45.45 86.36 151.52 70.45
Carbon stock/year (t.ha-1yr-1) 5.68 10.79 18.94 8.81
Table 1. Growth characteristics of different tree species
Growth characteristics Khaya grandifoliola Nauclea diderrichii Gmelina arborea Tectona grandis
TH (m) 9.14±1.23a 13.45±1.17b 12.58±1.17b 11.92±0.48ab
DBH (m) 0.14±0.02a 0.16±0.01a 0.13±0.01ab 0.10±0.00b
CH (m) 5.18±1.12a 10.25±1.14b 7.00±0.85a 9.03±0.47b
CD (m) 4.00±0.78ac 8.37±0.60b 5.12±0.33a 3.24±0.13c
MH (m) 5.33±0.72a 8.65±0.70b 7.87±0.74b 6.28±0.38a
Means on the same row with the same alphabet are not significantly different (p>0.05).
TH, total height; DBH, diameter at breast height; CH, crown height; CD, crown diameter, MH, merchantable height.
lection of soil samples, leaf litter was removed. Three of the collected samples were separately bulked to reduce the soil samples to three for each compartment. The bulked sam- ples were labeled appropriately and taken to the laboratory for analysis.
Methods of soil analysis
The soil parameters analyzed were; exchangeable bases (potassium, sodium, calcium, and magnesium), exchange- able acidity (H++Al+), soil organic carbon, soil organic matter (SOM), total nitrogen, cation exchange capacity (CEC), available phosphorus, base saturation (%), pH, mi- cro-nutrients (manganese, Iron, Copper and Zinc) and par- ticle size distribution (sand, silt and clay). The particle size distribution was measured using the hydrometer method (Bouyoucos 1951); available phosphorus was determined by Bray No. 1 method (Bray and Kurtz 1945); total nitro- gen was determined by Kjedahl method (Bremner 1965);
the exchangeable bases were determined by the summation method (Juo 1978); soil pH was measured in 1:1 soil: water ratio; base saturation (%) and CEC were computed using results/values of the exchangeable bases and exchangeable acidity. Organic carbon was determined by Walkley Black wet oxidation method (Allison 1965) and organic matter was derived by multiplying with 1.72 (Agbenin 1995).
Methods of data analysis
One-way analysis of variance (ANOVA) was used to test for significant difference in the above-ground carbon con- tents of the four species and also the nutrient contents of the four species compartments. Least Significant Difference test was used for mean separation where significant differ- ence existed. The relationship between the ABG carbon and soil properties/tree growth attributes in the species compartments was ascertained using the Pearson correla- tion analysis. The statistical package used for all data analy- sis was Statistical Package for Social Sciences (SPSS).
Results
Growth attributes of the different tree species The mean values of various growth attributes of the four species are shown in Table 1. N. diderrichii was consistently higher than the other species in all measured growth variables. There was no significant difference (p>0.05) between the total height of T. grandis and the other three species. However, K. grandifoliola was significantly differ- ent (p≤0.05) from N. diderrichii and G. arborea. There was no significant difference (p>0.05) between the diame- ter at breast height of K. grandifoliola and those of N. di-
Table 3. Particle size distribution of soils in the different tree species compartments
Particle size distribution Khaya grandifoliola Nauclea diderrichii Gmelina arborea Tectona grandis
Sand (%) 71.87±1.76a 71.20±3.46a 75.20±1.15a 71.87±1.76a
Silt (%) 20.53±1.33a 19.87±1.33ab 16.13±0.67b 20.53±1.33a
Clay (%) 7.60±1.15a 8.93±2.40a 8.67±0.67a 7.60±1.15a
Means on the same row with the same alphabet are not significantly different (p>0.05).
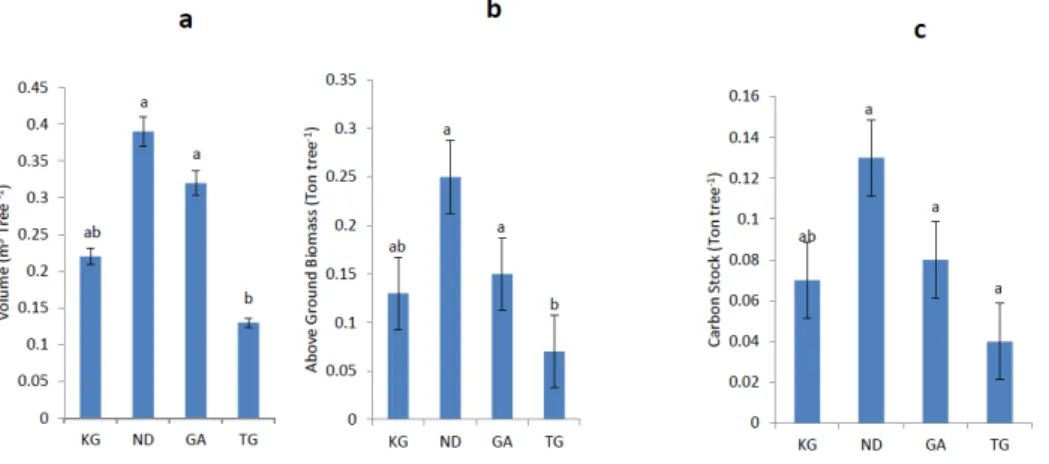
Fig. 2. Mean volume (a), Aboveground biomass (b) and Carbon stock (c) for the four species.
KG, Khaya grandifoliola; ND, Nauclea diderrichii; GA, Gmelina arborea; TG, Tectona grandis.
derrichii and G. arborea while it varied significantly (p≤
0.05) between T. grandis and those of N. diderrichii and K.
grandifoliola. There was no significant difference (p>
0.05) between the crown height of K. grandifoliola and G.
arborea and also for N. diderrichii and T. grandis. The crown diameter did not vary significantly (p>0.05) be- tween K. grandifoliola and the exotic species while it varied significantly (p≤0.05) between N. diderrichii and each of the three other species. There was no significant difference (p>0.05) between the merchantable height of K. grandi- foliola and T. grandis and also between N. diderrichii and G. arborea.
Carbon stock of the species
The above-ground volume, AGB, above-ground carbon stock and carbon sequestered per year of the species are presented in Table 2. All the carbon stock variables were observed to be highest for G. arborea and lowest for K.
grandifoliola.
The mean values for volume, AGB and carbon stock per tree for the four species are presented in Fig. 2 a, b and c,
respectively. The volume, AGB and carbon stock for K.
grandifoliola were not significantly different (p>0.05) from the other three species, however T. grandis varied sig- nificantly (p≤0.05) from N. diderrichii and G. arborea, with the highest and lowest mean values observed for N. di- derrichii and T. grandis respectively.
Soil physical properties
The particle size distribution of the soils of different spe- cies compartments is presented in Table 3. There was no significant difference (p>0.05) in the mean values of sand and clay among soil under the four species. There was no significant difference (p>0.05) between the percentage silt of soil under K. grandifoliola and those of N. diderrichii and T. grandis. G. arborea was however significantly differ- ent (p≤0.05) from K. grandifoliola and T. grandis. Soil chemical properties
Table 4 shows the chemical properties of soils in the dif- ferent species compartments. There was no significant dif- ference (p>0.05) in Mg, Al, CEC and base saturation of
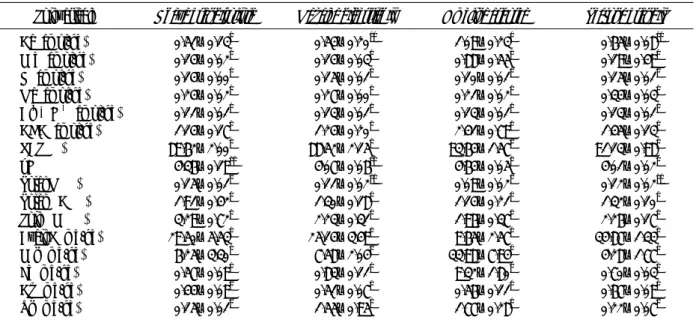
Table 4. Properties of soil under the different tree species compartment
Soil variable Khaya grandifoliola Nauclea diderrichii Gmelina arborea Tectona grandis
Ca (cmol/kg) 0.51±0.13a 0.54±0.20ab 1.09±0.23b 0.65±0.08ab
Mg (cmol/kg) 0.14±0.02b 0.14±0.03b 0.88±0.55b 0.19±0.49b
K (cmol/kg) 0.14±0.00a 0.15±0.01a 0.10±0.01b 0.15±0.01a
Na (cmol/kg) 0.24±0.02a 0.27±0.00a 0.21±0.02a 0.34±0.03b
Al++H+ (cmol/kg) 0.11±0.01c 0.13±0.01c 0.13±0.01c 0.13±0.01c
CEC (cmol/kg) 1.14±0.17a 1.24±0.20a 2.41±0.79a 1.45±0.13a
PBS (%) 89.62±2.00a 88.52±2.15a 93.64±1.57a 91.13±0.98a
pH 4.36±0.19ac 4.07±0.06ab 4.64±0.05c 4.01±0.02b
Total N (%) 0.15±0.01a 0.11±0.02ab 0.09±0.02b 0.12±0.02ab
Total OC (%) 1.91±0.42b 1.30±0.18b 1.14±0.21b 1.32±0.10b
Soil OM (%) 3.29±0.72c 2.23±0.31c 1.96±0.37c 2.26±0.17c
Avail P (mg/kg) 29.50±5.53a 25.14±3.49a 9.65±2.57b 34.87±1.33a
Mn (mg/kg) 6.25±3.30a 7.58±2.04a 33.98±7.94b 4.28±1.77a
Fe (mg/kg) 0.57±0.09a 0.83±0.11a 9.32±1.80b 0.70±0.03a
Cu (mg/kg) 0.44±0.09b 0.51±0.07b 0.56±0.11b 0.67±0.09b
Zn (mg/kg) 0.15±0.01c 1.55±0.95c 1.77±0.28c 0.22±0.07c
Means on the same row with the same alphabet are not significantly different (p>0.05).
Al++H+, exchangeable acidity; CEC, cation exchange capacity; PBS, percentage base saturation, OC, organic carbon; OM, organic matter, Avail P, available phosphorous.
soils under the species. The Ca content of soil under G. ar- borea did not also vary significantly (p>0.05) from those of N. diderrichii and T. grandis. No significant difference (p>0.05) was observed in Mg among the four species compartments. The K content was significantly different (p
≤0.05) between G. arborea and each of the other three species. Also, the Na content of soil under T. grandis was significantly different (p≤0.05) from the other three species. However, Al++H+ did not vary significantly (p>
0.05) among the four species compartments. There was no significant difference (p>0.05) in the CEC and base satu- ration of soil under the species. The pH of soil under K.
grandifoliola did not vary significantly (p>0.05) from those of N. diderrichii and G. arborea while it varied sig- nificantly (p≤0.05) between soils under G. arborea and those under N. diderrichii and T. grandis. The pH values generally show that soils under the canopies of the four tree species were acidic.
The lowest mean values for total nitrogen, total organic carbon, available phosphorus and soil organic matter were observed for soil under G. arborea. There was no sig- nificant difference (p>0.05) between the total nitrogen of soil under K. grandifoliola and under each of N. diderrichii
and T. grandis. Also, no significant difference (p>0.05) was observed between the total nitrogen of soil under G. ar- borea and that under N. diderrichii and T. grandis. However, the highest and lowest values were observed in soils under K. grandifoliola and G. arborea, respectively. No significant difference (p>0.05) was observed in total organic carbon and soil organic matter among the different species’ com- partments although the highest and lowest values were ob- served for soils under K. grandifoliola and G. arborea, respectively. There was no significant difference (p>0.05) in available phosphorus contents of soil under K. grandi- foliola and those of N. diderrichii and T. grandis while it varied significantly (p≤0.05) between Gmelina arborea and those of the other three tree species compartments with T. grandis having the highest value and G. arborea the low- est value.
There were no significant difference (p>0.05) between Mn and Fe of soil under K. grandifoliola and those of N.
diderichii and T. grandis while the Mn and Fe contents of soil under G. arborea varied significantly (p≤0.05) from those of the other three species. However, no significant difference (p>0.05) was observed in the Cu and Zn con- tents of soil for all the species compartments. The highest
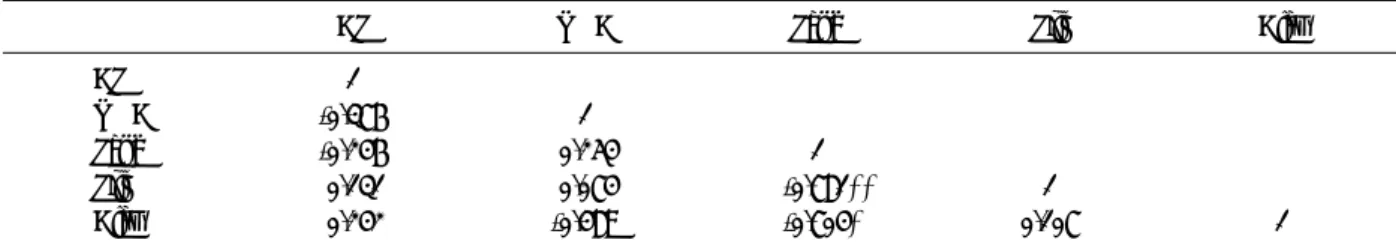
Table 5. Correlation matrix of carbon stock and tree growth variables
CS TOC TH DBH CH CD MH
CS 1
TOC -0.376 1
TH 0.542 -0.596* 1
DBH 0.911** -0.334 0.271 1
CH 0.490 -0.576 0.867** 0.297 1
CD 0.821** -0.465 0.591* 0.784** 0.599* 1
MH 0.792** -0.555 0.883** 0.539 0.697* 0.734** 1
*significant value at 0.05, **significant value at the 0.01.
CS, carbon stock; TOC, total organic carbon; TH, total height; DBH, diameter at breast height; CH, crown height; CD, crown diameter;
MH, merchantable height.
Table 6. Correlation matrix of carbon stock, and particle size distribution
CS TOC Sand Silt Clay
CS 1
TOC -0.376 1
Sand -0.246 0.254 1
Silt 0.131 0.074 -0.781** 1
Clay 0.242 -0.489 -0.704* 0.107 1
*significant value at 0.05, **significant value at the 0.01.
CS, carbon stock; TOC, total organic carbon.
values for Mn, Fe and Zn were observed for soil under G.
arborea while the lowest values for Fe, Cu and Zn were ob- served for K. grandifoliola.
Relationship between carbon stock and other varia- bles
The correlation matrix presented in Table 5 reveals that there was a high positive correlation between the carbon stock and diameter at breast height, crown diameter and the merchantable height. The soil total organic carbon shows a negative relationship with the total height of trees. The total height of trees was also observed to be positively related with the crown height, crown diameter and merchantable height. Diameter at breast height was observed to be strongly related with the crown diameter while the crown height showed a positive relationship with the crown diame- ter and merchantable height.
Table 6 shows the correlation analysis result of carbon stock, soil total organic carbon and the particle size dis-
tribution of the different species compartments. The result reveals that no relationship exists between the carbon stock of trees and the particle size distribution and also between the soil total organic carbon and the particle size distribution. However, sand was observed to be negatively correlated with silt and clay.
Relationship between carbon stock and soil chemical properties
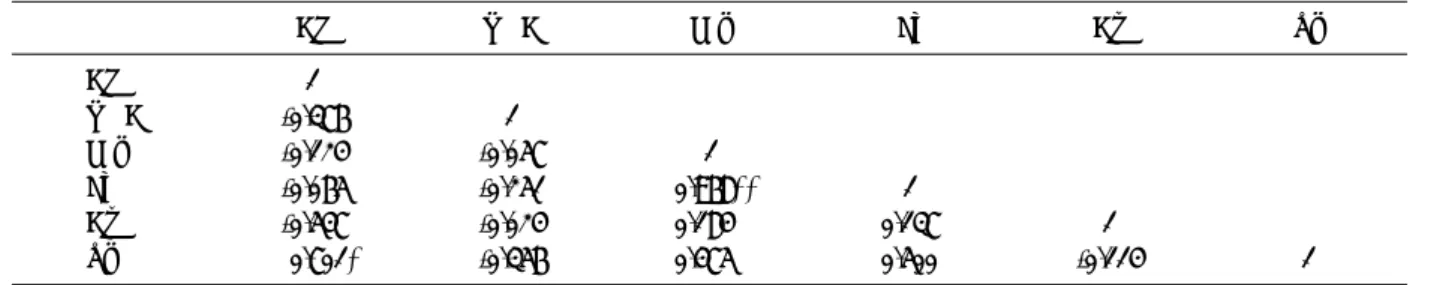
The correlation result between carbon stock and soil chemical properties is presented in Table 7. The result re- vealed that carbon stock was significantly correlated with percentage base saturation. Total organic carbon was ob- served to be strongly positively correlated with total nitro- gen and soil organic matter while a negative correlation was observed between the total organic carbon and exchange- able acidity (Al++H+). Ca was observed to be strongly correlated with Mg. A positive relationship was observed between K, CEC, base saturation and available phospho-
Table 7. Correlation matrix of carbon stock and soil chemical properties
CS TOC Ca Mg K Na Al++H+ CEC Base
sat TN AvP pH SOM
CS 1
TOC -0.376 1
Ca -0.411 -0.107 1
Mg -0.142 0.016 0.816** 1
K -0.033 0.223 -0.454 -0.540 1
Na -0.376 0.049 -0.177 -0.271 0.507 1
Al++H+ 0.373 -0.660* 0.261 0.284 -0.196 -0.166 1
CEC -0.288 -0.038 0.933** 0.964** -0.482 -0.169 0.297 1 PBS -0.660* 0.118 0.896** 0.623* -0.309 0.065 -0.132 0.778** 1 TN -0.236 0.790** -0.138 -0.034 0.244 0.165 -0.367 -0.070 0.012 1 AvP -0.490 0.571 -0.338 -0.397 0.666* 0.708** -0.365 -0.339 -0.082 0.544 1 pH -0.245 0.334 0.514 0.515 -0.592* -0.575 -0.376 0.487 0.565 -0.050 -0.431 1 SOM -0.375 1.000** -0.107 0.018 0.222 0.048 -0.659* -0.038 0.117 0.790** 0.570 0.335 1
*significant value at 0.05, **significant value at the 0.01.
CS, carbon stock; TOC, total organic carbon; Av. P, available phosphorus; SOM, soil organic matter, Ca, calcium; Mg, magnesium; K, po- tassium; Na, sodium; Al+H, exchangeable acidity; CEC, cation exchange capacity; PBS, percentage base saturation; TN, total nitrogen.
Table 8. Correlation matrix of carbon stock, total organic carbon and micronutrients
CS TOC Mn Fe Cu Zn
CS 1
TOC -0.376 1
Mn -0.124 -0.057 1
Fe -0.065 -0.251 0.968** 1
Cu -0.547 -0.024 0.184 0.137 1
Zn 0.701* -0.356 0.475 0.500 -0.114 1
*significant at 0.05, **significant value at the 0.01.
CS, carbon stock; TOC, total organic carbon.
rus, while K showed a negative relationship with the pH.
Na showed a positive relationship with CEC, base satu- ration and available phosphorus. Al++H+ also showed a negative relationship with soil organic matter. CEC showed a negative relationship with the soil pH while base satu- ration showed a positive relationship with available phos- phorus and a negative relationship with pH. Total nitrogen and soil organic matter was observed to be positively correlated.
In terms of carbon stock and soil micronutrients, the re- sults revealed a positive significant relationship between the carbon stock and Zn while the other micronutrients were negatively correlated with carbon stock. There was a strong positive relationship between Mn and Fe (Table 8).
Discussion
Forest trees are crucial features in addressing climate change because of their ability to continually absorb atmos- pheric carbon (Ashton et al. 2012). The variation in the quantities of carbon stored aboveground by the different tree species during the period covered by the study irre- spective of the tree populations is indicative of the varying potentials and abilities of the tree species to sequester carbon. This corroborates Ekoungoulou et al. (2014) ob- servation that carbon stored in a forest is not always con- trolled by the quantity of trees present in that ecosystem.
The fact that the aboveground biomass of the different tree
species followed a similar trend with the aboveground car- bon stock was expected since 50% of the aboveground bio- mass forms part of the carbon content of trees (Ravindranath et al. 1997). The carbon stored by the tree species per hec- tare is similar to the carbon stored in 1 hectare of a 20-year old Panamanian Teak plantation (120 t C/ha) as reported by Kraenzel et al. (2003), Australian radiate pine (171 t C/ha) and Brazilian slash pine (112 t C/ha) (Nabuurs and Mohren 1995). According to Gower and Ahl (2006), different ele- ments including species type, age, soil, and nutrient levels affect a tree’s potential to capture carbon. The result of this study showed that the carbon contents of the four species were not equal even though they were all planted at the same time of a particular year and in the same location.
Chen and Zhu (1989) also reported that species vary in their ability to store carbon. Considering the origin of the tree species, G. arborea was observed to sequester more car- bon yearly at about twice the rate of T. grandis, when the exotic species were considered while N. diderrichii, stored about double the amount of carbon stored by K. grandi- foliola yearly when the indigenous species were considered.
The results of this study did not show any particular trend in growth pattern between the exotic and indigenous species as better growth was recorded for N diderrichii which is an ingenuous species than the exotic species. Tree growth (Chatzistathis and Therios 2013; Chima et al.
2016) is affected by various factors like genetics, top- ography, soil nutrient availability, and precipitation. N. di- derrichii is known to grow well in humid areas with good annual rainfall (Dupuy and Mille 1993). However, the higher growth observed in G. arborea when compared with T. grandis, another exotic species agrees with earlier find- ings of Adekunle (2000) and Adekunle et al. (2011).
Litter plays a vital part in the nutrient content and accu- mulation in the upper region of the soil (Singh 1971). Trees have an influence on soils through soil solution uptake, root production and turnover, mycorrhizal activity, organic com- pound exudation, and the type of litter produced for de- composition (Chen 2006). Soil physical properties play a major role in fertility of soil since it influences the nature and composition of soil nutrients (Unanaonwi et al. 2013, Chima et al. 2016) by enhancing microbial activities and movement of nutrient in the soil. Soil particle size dis- tribution play an important role in soil water movement, soil
erosion and soil solute migration (Hu et al. 2011) and as such directly influence nutrient content of soil. The lack of apparent significant variation (except for silt) in the particle size distribution of soils under the various species compart- ments irrespective of species origin points to the intrinsic nature of soil texture.
Chima et al. (2014) reported low concentrations of K and Na in soils under exotic species and attributed it to higher absorption of K and Na from the soil probably as a result of higher immobilization of K and Na in exotics. However, this study did not absolutely corroborate that observation since the soil under T. grandis and G. arborea were ob- served to have the highest and lowest concentrations of K and Na respectively. This may be as a result of the great dis- parity in the ages of the very old exotic plantations studied by Chima et al. (2014) and the very young ones evaluated in this study, as nutrient immobilization increases over time with increase in tree growth and age. This probably ex- plains why soils under G. arborea (with higher growth) had lower concentrations of K and Na than T. grandis. Plants utilize K for the stimulation of enzymes, in photosynthesis, sugar transport and protein formation (Mengel and Kirkby 2001). Soils under G. arborea and T. grandis were observed to have higher Cation exchange capacity than soils under N. diderrichii and K. grandifoliola. Cation exchange ca- pacity acts as a storage for nutrients that can be washed off from the soil water by leaching and plant uptake (Camberato 2007). This implies that the soils under G. arborea and T.
grandis have a higher capacity to supply nutrient cations to the soil solution for plant uptake. A high percentage base saturation for soils under all the species indicates high soil fertility (Bear et al. 1945; Sonon et al. 2014; Chima et al.
2016). The pH of soil under the four species were observed to be acidic with T. grandis and G. arborea compartments having the most and least levels of acidity respectively. Soil pH is influenced by the amount of the exchangeable acids and bases in the soil, as the pH level reduces with an in- crease in Al++H+ and a decrease in Ca, Mg and K (Brady and Weil 2008).
The amount of soil organic carbon and nitrogen is insist- ent on the speed at which microorganisms work on decom- position (Simard et al. 1997; Van der Heijden et al. 1998).
Soil organic matter and soil organic carbon are directly re- lated (Chima et al. 2016). In this study, soil under K. gran-
difoliola was observed to have the highest concentration of soil organic matter and the concentration of phosphorus and total nitrogen was also relatively high for soil under K.
grandifoliola. According to Awotoye et al. (2011), an in- crease in nitrogen and available phosphorus improves or- ganic composition of soil through litter decomposition.
Trees which integrate litter fall and decomposition are a very important measure for the buildup of soil organic mat- ter (Emadi et al. 2008).
Micronutrients are needed by plants in optimum quan- tity for proper growth and survival. The concentration of micronutrients was highest for soil under G. arborea ex- cluding Cu which was highest in soil under T. grandis. The micronutrients did not follow any particular trend with re- gards to exotic and indigenous species; for example, Mn and Fe were significantly different between G. arborea and the other three species while they did not vary between T.
grandis and the indigenous species. The variation in Mn and Fe followed the same pattern for the four species, but- tressing the findings of Mackay and Barber (1985) that the dynamics of Mn and Fe are related. However, this study did not support the reports of Dotaniya and Meena (2015) and Chima et al. (2016) who suggest that the concentration of Mn increases with increasing acidity. The soil under T.
grandis observed to be the most acidic had the least concen- tration of Mn while the soil under G. arborea which had least acidity was observed to have the highest concentration of Mn. Soil nutrients are presumed to improve with planta- tion age as the accrual of dry matter increases (Swamy et al.
2003).
Several factors determine the rate at which trees capture and store carbon. Hence, the justification for the correla- tion analysis carried out to determine the relationship that exists between the carbon stock, total organic carbon, growth variables, and soil physico-chemical properties. It was deduced from the correlation analysis that tree carbon stock increases as DBH, crown diameter and merchantable height increases. The positive association between the car- bon stock and these tree growth parameters indicates that tall trees with big trunk and a wide crown coverage stores more carbon. Trees with large crown diameter usually have more leaves which are important in photosynthesis by which carbon is stored. This corroborates the results of oth- er researchers that carbon sequestration potential is directly
associated with DBH, tree height, crown diameter, basal area and wood density (Terakunpisut et al. 2007; Stegen et al. 2009; Tagupa et al. 2010; Eguakun and Adesoye 2015).
There was no significant relationship between carbon stocks, total soil organic carbon and particle size distribution.
This suggests that the concentration of sand, silt and clay of the soil does not affect the carbon stored in the biomass of the trees. Soil total nitrogen, exchangeable cations, available phosphorus, CEC, organic matter and pH did not show any association with the carbon content of trees. However, a negative relationship was observed between the carbon stock of trees and base saturation of soil. This means that the higher the carbon stored by the tree, the lower the base saturation of the soil. Base saturation indicates the fertility of the soil. Litter (leaves, twigs, branches and fruits etc), which also contain stored carbon forms part of the buildup of soil fertility after decomposition. As such, only until these tree parts fall as litter to the ground and decompose, will they add to the fertility of the soil. A positive relationship between the carbon stock of trees and Zn concentration in the soil was also observed. Zinc deficiency in plants alters chloroplast pigments, and as such affects photosynthesis (Kosesakal and Unal 2009). The positive relationship be- tween the carbon stock of trees and Zn suggests that the carbon content will increase as Zn in the soil available for plant use increases since Zn enhances photosynthetic proc- ess due to its effect on chloroplast pigment formation on leaves.
Conclusion
The storage of carbon by forest is a low budget and effec- tive way to check climate change. The carbon content of the different species used for this study varied. This study re- vealed that G. arborea and N. diderrichii can be reliable tree species for climate change mitigation efforts with re- spect to carbon sequestration. Some tree growth parameters including the height, DBH and crown formation are di- rectly associated with the ability of the tree to capture carbon. The soil under G. arborea had higher nutrient con- tent than soils under the other species.
Recommendation
The four tree species (especially G. arborea and N. di- derrichii) used for this research work can be effectively used for reforestation and afforestation programmes aimed at climate change mitigation across Nigeria. Therefore, pol- icies to encourage and enhance their planting should be put in place. The information on the physico-chemical proper- ties of soil under the species could be useful in soil quality management and enhancement of site productivity.
References
Aba SC, Ndukwe OO, Amu CJ, Baiyeri KP. 2017. The role of trees and plantation agriculture in mitigating global climate change. Afr J Food Agric Nutr Dev 17: 12691-12707.
Adekunle VAJ, Alo AA, Adekayode FO. 2011. Yields and nutrient pools in soils cultivated with Tectona grandis and Gmelina ar- borea in Nigerian rainforest ecosystem. J Saudi Soc Agric Sci 10: 127-135.
Adekunle VAJ. 2000. Comparative studies of growth characteristics of Gmelina and Tectona stands and their volume equations. J Appl Sci 3: 1498-1514.
Agbenin JO. 1995. Laboratory Manual for Soil and Plant Analysis (Selected Methods and Data Analysis). Faculty of Agriculture/
Institute of Agricultural Research, ABU, Zaria, pp 7-71.
Aiyeloja AA, Adedeji GA, Larinde SL. 2014. Influence of Seasons on Honeybee Wooden Hives Attack by Termites in Port Harcourt, Nigeria. Int J Biol Vet Agric Food Eng 8: 734-737.
Allison LE. 1965. Organic carbon. In: Methods of Soil Analysis Part 2. Chemical and Microbiological Properties, Number 9 in the Series Agronomy (Black CA, Evans DD, Ensminger LE, White JL, Clark FE, Dinauer RC, eds). American Society of Agronomy, Madison, pp 1367-1378.
Ashton MS, Tyrrell ML, Spalding D, Gentry B. 2012. Managing Forest Carbon in a Changing Climate. Springer, Dordrecht, pp 1-4.
Awotoye OO, Ogunkunle CO, Adeniyi SA. 2011. Assessment of soil quality under various land use practices in a humid agro-ecological zone of Nigeria. Afr J Plant Sci 5: 565-569.
Bear FE, Prince AL, Malcolm JL. 1945. Potassium Needs of New Jersey Soils. New Jersey Agricultural Experiment Station, New Brunswick, NJ.
Benites J, Dudal R, Koohafkan P. 1999. Land, the platform of local food security and global environmental protection. In:
Prevention of Land Degradation, Enhancement of Carbon Sequestration and Conservation of Biodiversity Through Land Use Change and Sustainable Management with a Focus on Latin America and the Caribbean. Proceedings of the IFAD/
FAO Expert Consultation (Food and Agriculture Organizations, ed). IFAD, Rome, pp 37-42.
Bouyoucos GJ. 1951. A Recalibration of the Hydrometer Method for Making Mechanical Analysis of Soils. Agron J 43: 434-438.
Boyle JR, Powers RF. 2013. Forest Soils. https://doi.org/
10.1016/B978-0-12-409548-9.05169-1. Accessed 29 Jan 2020.
Brady NC, Weil RR. 2008. The soils around us. In: Nature and Properties of Soils (Brady NC, Weil RR, eds). Pearson Prentice Hall, Upper Saddle River, pp 1-31.
Bray RH, Kurtz LT. 1945. Determination of total organic and available forms of phosphorus in soils. Soil Sci 59: 39-46.
Bremner JM. 1965. Total nitrogen. In: Methods of Soil Analysis Part 2. Chemical and Microbiological Properties, Number 9 in the Series Agronomy (Black CA, Evans DD, Ensminger LE, White JL, Clark FE, Dinauer RC, eds). American Society of Agronomy, Madison, pp 1149-1178.
Camberato JJ. 2007. Cation Exchange Capacity-Everything You Want to Know and Much More. Magnesium 2: 240.
Chatzistathis T, Therios I. 2013. How Soil Nutrient Availability Influences Plant Biomass and How Biomass Stimulation Alleviates Heavy Metal Toxicity in Soils: The Cases of Nutrient Use Efficient Genotypes and Phytoremediators, Respectively.
In: Biomass Now (Matovic MD, ed). IntechOpen, London, pp 427-448.
Chavan BL, Rasal GB. 2010. Sequestered standing carbon stock in selective tree species grown in University campus at Aurangabad, Maharashtra, India. Int J Eng Sci Technol 2: 3003-3007.
Chave J, Coomes D, Jansen S, Lewis SL, Swenson NG, Zanne AE. 2009. Towards a worldwide wood economics spectrum.
Ecol Lett 12: 351-366.
Chen C, Zhu J. 1989. A Handbook for Main Tree Species Biomass in Northeast China. China Forestry Publishing, Beijing.
Chen X. 2006. Tree Diversity, Carbon Storage, and Soil Nutrient in an Old‐Growth Forest at Changbai Mountain, Northeast China. Commun Soil Sci Plant Anal 37: 363-375.
Chima UD, Akhabue EF, Gideon IK. 2016. Rhizosphere soil properties and growth attributes of four tree species in a four-year arboretum at the University of Port Harcourt, Nigeria. Nigerian J Agric Food Environ 12: 47-80.
Chima UD, Popo-Ola FS, Ume KK. 2014. Physico-Chemical Properties of Topsoil under Indigenous and Exotic Monoculture Plantations in Omo Biosphere Reserve, Nigeria. Ethiopian J Environ Stud Manag 7: 117-123.
Choudhary BK, Majumdar K, Datta BK. 2019. Potential Biomass Pools and Edaphic Properties of Plantation Forest in Tripura, India. Int J Ecol Environ Sci 45: 369-381.
Dotaniya ML, Meena VD. 2015. Rhizosphere Effect on Nutrient Availability in Soil and Its Uptake by Plants: A Review. Proc Natl Acad Sci India Sect B Biol Sci 85: 1-12.
Dupuy B, Mille G. 1993. Timber Plantations in the Humid Tropics of Africa. Food and Agriculture Organization, Rome, 190 pp.
Eguakun FS, Adesoye PO. 2015. Exploring Tree Growth Variables Influencing Carbon Sequestration in the Face of Climate Change. Int J Biol Ecol Eng 9: 765-768.
Ekoungoulou R, Liu X, Loumeto J, Ifo S, Bocko Y, Koula F, Niu S. 2014. Tree Allometry in Tropical Forest of Congo for Carbon Stocks Estimation in Above-Ground Biomass. Open J For 4:
481-491.
Emadi M, Emadi M, Baghernejad M, Fathi H, Saffari M. 2008.
Effect of Land Use Change on Selected Soil Physical and Chemical Properties in North Highlands of Iran. J Appl Sci 8:
496-502.
Fayolle A, Doucet JL, Gillet JF, Bourland N, Lejeune P. 2013.
Tree allometry in Central Africa: Testing the validity of pan- tropical multi-species allometric equations for estimating bio- mass and carbon stocks. For Ecol Manag 305: 29-37.
Gibbs HK, Brown S, Niles JO, Foley JA. 2007. Monitoring and estimating tropical forest carbon stocks: making REDD a reality. Environ Res Lett 2: 045023.
Gower ST, Ahl DE. 2006. Carbon and Greenhouse Gas Budgets for Wisconsin Forests and Forest Product Chains. Department of Forest Ecology and Management, University of Wisconsin- Madison, Madison, WI, 102 pp.
Hetland J, Yowargana P, Leduc S, Kraxner F. 2016. Carbon-neg- ative emissions: Systemic impacts of biomass conversion: A case study on CO2 capture and storage options. Int J Greenh Gas Control 49: 330-342.
Houghton RA, Hobbie JE, Melillo JM, Moore B, Peterson BJ, Shaver GR, Woodwell GM. 1983. Changes in the Carbon Content of Terrestrial Biota and Soils between 1860 and 1980: A Net Release of CO2 to the Atmosphere. Ecol Monogr 53:
236-262.
Hu H, Tian F, Hu H. 2011. Soil particle size distribution and its relationship with soil water and salt under mulched drip irriga- tion in Xinjiang of China. Sci China Technol Sci 54: 1568-1574.
Huy B, Poudel KP, Kralicek K, Hung ND, Khoa PV, Phương VT, Temesgen H. 2016. Allometric Equations for Estimating Tree Aboveground Biomass in Tropical Dipterocarp Forests of Vietnam. Forests 7: 180.
Jew EKK, Dougill AJ, Sallu SM, O’Connell J, Benton TG. 2016.
Miombo woodland under threat: Consequences for tree diver- sity and carbon storage. For Ecol Manag 361: 144-153.
Juo ASR. 1978. Selected Methods for Soil and Plant Analysis.
Manual Series No. 1. IITA, Ibadan, 57 pp.
Kort J, Turnock R. 1998. Carbon reservoir and biomass in Canadian prairie shelterbelts. Agrofor Syst 44: 175-186.
Kosesakal T, Unal M. 2009. Role of Zinc Deficiency in Photosynthetic Pigments and Peroxidase Activity of Tomato Seedlings. IUFS J Biol 68: 113-120.
Kraenzel M, Castillo A, Moore T, Potvin C. 2003. Carbon storage of harvest-age teak (Tectona grandis) plantations, Panama. For Ecol Manag 173: 213-225.
Lamb D, Erskine PD, Parrotta JA. 2005. Restoration of Degraded
Tropical Forest Landscapes. Science 310: 1628-1632.
Mackay AD, Barber SA. 1985. Effect of soil moisture and phos- phate level on root hair growth of corn roots. Plant Soil 86:
321-331.
Mengel K, Kirkby EA. 2001. Principles of Plant Nutrition. 5th ed.
Kluwer Academic, Boston, MA, 849 pp.
Nabuurs GJ, Mohren GMJ. 1995. Modelling analysis of potential carbon sequestration in selected forest types. Canadian J For Res 25: 1157-1172.
Nowak DJ, Crane DE. 2002. Carbon storage and sequestration by urban trees in the USA. Environ Pollut 116: 381-389.
Nowak DJ, Stevens JC, Sisinni SM, Luley CJ. 2002. Effects of ur- ban tree management and species selection on atmospheric car- bon dioxide. J Arboric 28: 113-122.
Pascal JP. 1988. Wet Evergreen Forests of the Western Ghats of India: Ecology, Structure, Floristic Composition and Succession. Institut Francais de Pondichéry, Pondichéry, 345 pp.
Ravindranath NH, Somashekhar BS, Gadgil M. 1997. Carbon flow in Indian forests. Clim Change 35: 297-320.
Sayer EJ, Heard MS, Grant HK, Marthews TR, Tanner EVJ.
2011. Soil carbon release enhanced by increased tropical forest litterfall. Nat Clim Change 1: 304-307.
Simard SW, Perry DA, Jones MD, Myrold DD, Durall DM, Molina R. 1997. Net transfer of carbon between ectomycor- rhizal tree species in the field. Nature 388: 579-582.
Singh KP. 1971. Litter production and nutrient turnover in decid- uous forest of Varanasi. Trop Ecol 47: 643-697.
Sonon LS, Kissel DE, Saha U. 2014. Cation Exchange Capacity and Base Saturation. The University of Georgia, Athens.
Stegen JC, Swenson NG, Valencia R, Enquist BJ, Thompson J.
2009. Above-ground forest biomass is not consistently related to wood density in tropical forests. Glob Ecol Biogeogr 18:
617-625.
Swamy SL, Puri S, Singh AK. 2003. Growth, biomass, carbon stor- age and nutrient distribution in Gmelina arborea Roxb. stands on red lateritic soils in central India. Bioresour Technol 90:
109-126.
Tagupa C, Lopez A, Caperida F, Pamunag G, Luzada A. 2010.
Carbon Dioxide (CO2) Sequestration Capacity of Tampilisan Forest. E-Int Sci Res J 2: 182-191.
Terakunpisut J, Gajaseni N, Ruankawe N. 2007. Carbon Seques- tration Potential in Aboveground Biomass of Thong Pha Phum National Forest, Thailand. Appl Ecol Environ Res 5: 93-102.
Thangata PH, Hildebrand PE. 2012. Carbon stock and sequestra- tion potential of agroforestry systems in smallholder agro- ecosystems of sub-Saharan Africa: Mechanisms for ‘reducing emissions from deforestation and forest degradation’ (REDD+).
Agric Ecosyst Environ 158: 172-183.
Tschakert P. 2001. Human dimensions of carbon sequestration: a political ecology approach to soil fertility management and de- sertification control in the Old Peanut Basin of Senegal. Arid Lands Newsletter. https://cals.arizona.edu/OALS/ALN/aln49/
tschakert.html. Accessed 29 Jan 2020.
Unanaonwi, Okpo E, Chinevu, Christian N. 2013. Physical and Chemical Characteristics of Forest Soil in Southern Guinea Savanna of Nigeria. Glob J Sci Front Res 13: 5-10.
Van der Heijden MGA, Klironomos JN, Ursic M, Moutoglis P, Streitwolf-Engel R, Boller T, Wiemken A, Sanders IR. 1998.
Mycorrhizal fungal diversity determines plant biodiversity, eco- system variability and productivity. Nature 396: 69-72.
Vashum KT, Jayakumar S. 2012. Methods to Estimate Above- Ground Biomass and Carbon Stock in Natural Forests - A Review. J Ecosyst Ecogr 2: 116.
Zanne AE, Lopez-Gonzalez G, Coomes DA, Ilic J, Jansen S, Lewis SL, Miller RB, Swenson NG, Wiemann MC, Chave J.
2009. Data from: towards a worldwide wood economics spectrum. https://doi.org/10.5061/dryad.234. Accessed 29 Jan 2020.