http://e-nrp.org
Low consumption of fruits and dairy foods is associated with metabolic syndrome in Korean adults from outpatient clinics in and near Seoul
SuJin Song
1, Eun-Kyung Kim
2, Soyoung Hong
3, Sangah Shin
4, YoonJu Song
5, Hyun Wook Baik
6, Hyojee Joung
3and Hee Young Paik
1§1Department of Food and Nutrition, Seoul National University, 1 Gwanak-ro, Gwanak-gu, Seoul 151-742, Korea
2Department of Nutritional Science and Food Management, Ewha Womans University, Seoul 120-750, Korea
3Division of Public Health Nutrition, Institute of Health and Environment, Graduate School of Public Health, Seoul National University, Seoul 151-742, Korea
4Graduate School of Medicine, The University of Tokyo, Tokyo 113-0033, Japan
5Major of Food and Nutrition, School of Human Ecology, The Catholic University of Korea, Gyeonggi 420-743, Korea
6Department of Internal Medicine, Division of Gastroenterology and Clinical Nutrition, DMC Bundang Jesaeng Hospital, Gyeonggi 463-774, Korea
BACKGROUND/OBJECTIVES: The aim of this study was to examine differences in nutrient intake and food consumption by the presence of metabolic syndrome in Korean adults.
SUBJECTS/METHODS: Study subjects in this cross-sectional study were recruited from four outpatient clinics in and near the Seoul metropolitan area of South Korea between 2006 and 2012. A total of 668 subjects (413 men and 255 women) aged
≥ 30 y were included in the final data analyses. For each subject, daily nutrient intake and food consumption were calculated using three days of dietary intake data obtained from a combination of 24-hour recalls and dietary records. To evaluate food consumption, mean number of servings consumed per day and percentages of recommended number of servings for six food groups were calculated. Metabolic syndrome was defined using the National Cholesterol Education Program Adult Treatment Panel III criteria. The general linear model was performed to examine differences in nutrient intake and food consumption by sex and the presence of metabolic syndrome after adjustment for potential confounding variables.
RESULTS: Nutrient intake did not differ by the presence of metabolic syndrome in both men and women. Men with metabolic syndrome had lower consumption and percentage of the recommendation for fruits compared with those without metabolic syndrome (1.6 vs. 1.1 servings/day, P-value = 0.001; 63.5 vs. 49.5%, P-value = 0.013). Women with metabolic syndrome showed lower consumption and percentage of the recommendation for dairy foods than those without metabolic syndrome (0.8 vs.
0.5 servings/day, P-value = 0.001; 78.6 vs. 48.9%, P-value = 0.001).
CONCLUSIONS: Low intakes of fruits and dairy foods might be associated with the risk of having metabolic syndrome among Korean adults. Dietary advice on increasing consumption of these foods is needed to prevent and attenuate the risk of metabolic syndrome.
Nutrition Research and Practice 2015;9(5):554-562; doi:10.4162/nrp.2015.9.5.554; pISSN 1976-1457 eISSN 2005-6168
Keywords: Fruits, dairy foods, food consumption, metabolic syndrome, Korean adults
INTRODUCTION
*Metabolic syndrome, a cluster of abdominal obesity, dyslipi- demia, glucose intolerance, and hypertension [1], is associated with increased risks for type 2 diabetes and cardiovascular diseases [2,3]. Metabolic syndrome is relatively prevalent world- wide and one of the major public health issues [4]. A recent study reported that the prevalence of metabolic syndrome in Korean adults has been rapidly increasing [5].
Although the role of diet in the development of metabolic syndrome is not fully elucidated, prospective and cross- sectional studies among Western populations have reported that the risk of metabolic syndrome were inversely associated with intakes of fruits and vegetables [6,7], dairy foods [8-12], and nutrients that are predominant in these foods [9,12-14].
In addition, adherence to a healthy dietary pattern chara- cterized by high consumption of fruits, vegetables, whole grains, and dairy foods but low intakes of meat, fats, and
This study was supported by the Seoul City R&BD program (grant number 10526); the Cooperative Research Program for Agriculture Science and Technology Development through Rural Development Administration in Republic of Korea (grant number PJ007211); and the Basic Science Research Program through the National Research Foundation of Korea of the Ministry of Education, Science, and Technology (grant number 2010-0004536).
§Corresponding Author: Hee Young Paik, Tel. 82-2-880-6834, Fax: 82-2-880-8775, Email. [email protected].
Received: April 16, 2015, Revised: July 1, 2015, Accepted: July 8, 2015
This is an Open Access article distributed under the terms of the Creative Commons Attribution Non-Commercial License (http://creativecommons.org/licenses/by-nc/3.0/) which permits unrestricted non-commercial use, distribution, and reproduction in any medium, provided the original work is properly cited.
sugars was reported to inversely relate to metabolic syndrome [15-18]. The associations between these dietary factors and the risk of metabolic syndrome in Asian adults have also been examined but limited data exist regarding the associations.
Among Tehranian adults, intakes of fruits, vegetables, and dairy foods were inversely associated with the prevalence of metabolic syndrome [19,20].
Korean adults have unique dietary practices that are different from those of Western adults. The typical Korean meal includes grains, meat, and vegetables as staple foods and side dishes whereas fruits and dairy foods are consumed less frequently [21]. Based on the Korea National Health and Nutrition Exami- nation Survey data [22], intakes of fruits and dairy foods in Korean adults were markedly lower than the recommended amounts and also lower compared to those in Western popula- tions. However, only a few studies in Korean adults have examined foods and nutrients related to metabolic syndrome.
In previous studies of Korean adults, intakes of dairy foods and calcium were inversely associated with the prevalence of metabolic syndrome [23-25] but the associations were stronger in women than in men [24,25]. In addition, poor adherence to the recommended consumption for dairy foods was associated with a higher risk of metabolic syndrome [26].
Investigation of dietary factors associated with metabolic syndrome is important to prevent and attenuate the risk of chronic diseases during the early stages. Therefore, the aim of this study was to examine differences in nutrient intake, food consumption, and adherence to a recommendation for food group intake according to the presence of metabolic syndrome using three days of dietary intake data among Korean men and women recruited from outpatient clinics in and near Seoul.
SUBJECTS AND METHODS Study subjects
The data used in this cross-sectional study were from those subjects who attended health examination centers, internal medicine or family medicine departments of four outpatient clinics in and near the Seoul metropolitan area of South Korea between 2006 and 2012. Of the records of 782 subjects who gave written informed consent to the current study, we excluded subjects who were younger than 30 years of age (n
= 17), had less than three days of dietary intake data (n = 91), or had incomplete information on anthropometric or biochemical variables (n = 6). A total of 668 subjects (413 men and 255 women) were included in the final analyses. This study was approved by the Institutional Review Boards at the Seoul Medical Center, Bundang Jesaeng General Hospital, and Seoul National University Hospital.
Assessment of dietary variables
Three days of dietary intake data were obtained from a combination of 24-hour recalls and dietary records. Daily energy and nutrient intakes were calculated from three days of dietary intake data using the Diet Evaluation System (The Human Nutrition Lab., Seoul National University, Seoul, South Korea), a validated web-based computer program for dietary assessment
[27,28] based on a Korean Food Composition Table [29]. Daily consumption of six food groups in numbers of servings was evaluated based on a newly developed food group database [22]. The database consisted of 4,370 Korean foods and provided common serving size and number of food group servings per 100 grams of each food for six food groups (e.g., Grains; Meat, fish, eggs, and beans; Vegetables; Fruits; Dairy foods; and Oils, fats, and sugars). In addition, six food groups were further divided into subgroups: the vegetables group was divided into fresh vegetables and salted vegetables; the fruits group was divided into fresh fruits and fruit juice; and the dairy foods group was divided into milk and other dairy products. To evaluate food group consumption, percentage (%) of a recommendation for six food groups was assessed based on the Korean Food Guidance System which provides the recom- mended amount of six food group consumption in number of servings per day according to sex and age groups based on energy and nutrients requirements of each group [30]. For adults, four recommendations are suggested according to sex and age groups: 1) men aged 19-64 years, 2) women aged 19-64 years, 3) men aged 65 years or more, and 4) women aged 65 years or more. For example, it is recommended that men aged 19-64 years should consume 4 servings of grains, 5 servings of meat, fish, eggs, and beans, 7 servings of vegetables, 3 servings of fruits, 1 serving of dairy foods, and 5 servings of oils, fats, and sugars. Percentage of recommended servings =
(consumed number of servings / recommended number of servings) × 100.
Assessment of demographic, lifestyle, anthropometric, and biochemical variables
Information on demographic and lifestyle variables was obtained through questionnaires. Smoking status was catego- rized into current-, ex-, and non-smoker. Alcohol use was assessed based on the average frequency of alcohol drinking per week. Regular physical activity was determined by asking whether the subjects participated in exercise regularly during the last month. Height, weight, and waist circumference were measured using standardized techniques and calibrated equipment. BMI was calculated as weight (kg) / height (m
2) and obesity was defined as BMI ≥ 25 kg/m
2. Blood pressure was measured with a standardized sphygmomanometer. Blood samples were collected after the subjects had fasted for at least 8 hours.
Fasting blood glucose, triglycerides, and HDL-cholesterol were analyzed at certified clinical laboratories.
Definition of metabolic syndrome
Metabolic syndrome was diagnosed using the National Cholesterol Education Program Adult Treatment Panel III criteria [1] with a modified waist circumference cutoff for Koreans [31].
Metabolic syndrome was defined as having three or more of the following components: 1) elevated waist circumference (≥
90 cm in men and ≥ 85 cm in women), 2) elevated triglycerides
(≥ 150 mg/dL) or using medication for hyperlipidemia, 3) low
HDL-cholesterol (< 40 mg/dL in men and < 50 mg/dL in
women), 4) elevated fasting blood glucose (≥ 100 mg/dL) or
using medication for diabetes, and 5) elevated blood pressure
(systolic ≥ 130 mmHg or diastolic ≥ 85 mmHg) or using
Characteristics Total (n = 668)
Men (n = 413)
Women
(n = 255) P-value1) Sex (%)
Men 61.8
Women 38.2
Age (Mean ± SD)
Yrs 51.4 ± 10.4 49.1 ± 10.3 55.1 ± 9.4 < 0.001
BMI (Mean ± SD)
kg/m2 25.4 ± 3.0 25.8 ± 2.7 24.7 ± 3.2 < 0.001
Smoking status (%)
Current-smoker 24.0 36.6 3.5 < 0.001
Ex-smoker 26.2 40.7 2.8
Non-smoker 49.9 22.8 93.7
Alcohol use (%)
< 1 time/week 59.7 41.4 89.4 < 0.001
1-2 times/week 23.1 33.9 5.5
≥ 3 times/week 17.2 24.7 5.1
Regular physical activity (%)
Yes 69.8 71.4 67.1 0.260
No 30.2 28.6 32.9
Prevalence of obesity (%)
Obesity (BMI ≥ 25 kg/m2) 52.8 58.6 43.5 < 0.001
Prevalence of metabolic syndrome and its components (%)
Elevated waist circumference 50.5 55.9 41.6 < 0.001
Elevated triglycerides 57.8 66.1 44.3 < 0.001
Low HDL-cholesterol 40.1 32.9 51.8 < 0.001
Elevated fasting blood glucose 45.7 50.4 38.0 0.002
Elevated blood pressure 58.8 61.7 54.1 0.053
Metabolic syndrome 50.0 55.5 41.2 < 0.001
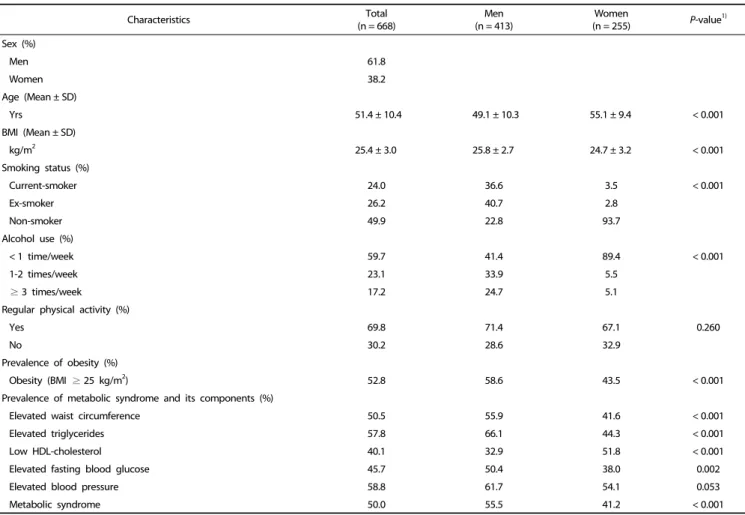
Table 1. Characteristics of the study subjects by sex
medication for hypertension.
Statistical analysis
All statistical analyses were conducted using the SAS software package version 9.3 (SAS Institute, Cary, NC, USA). All statistical analyses were performed by sex because general characteristics and dietary intakes differed by sex. The t-test for continuous variables and the chi-square test for categorical variables were used to test the differences in characteristics by sex. Continuous variables (e.g., age, BMI, and dietary variables) were expressed as means and SD and categorical variables (e.g., smoking status, alcohol use, regular physical activity, and prevalence of obesity and metabolic syndrome components) were expressed as percentages by the presence of metabolic syndrome in men and women. The general linear model (GLM) for continuous variables and the chi-square test for categorical variables were performed to examine the differences in these variables by the presence of metabolic syndrome. Differences in nutrient intake and food consumption (mean number of servings consumed per day and percentages of the recommendation for six food groups) by the presence of metabolic syndrome were tested using the GLM after adjustment for age, BMI, smoking status,
alcohol use, regular physical activity, and total energy intake.
All statistical tests were two-sided and a P-value of < 0.05 represented statistical significance.
RESULTS
Characteristics of the study subjects by sex
Characteristics of the study subjects by sex are shown in Table
1. Men were more likely to be younger, have higher BMI, be
current- or ex-smokers, and drink alcohol frequently than
women. Percentages of subjects with BMI ≥ 25 kg/m
2were
58.6% in men and 43.5% in women. The prevalence of
metabolic syndrome in this study sample was 50% (55.5% in
men and 41.2% in women, P-value < 0.001). Elevated triglycerides
in men (66.1%) and low HDL-cholesterol in women (51.8%) were
the most prevalent component of metabolic syndrome. Prevalence
of all the components of metabolic syndrome, except for
elevated blood pressure significantly differed by sex. Men had
higher intakes of total energy, energy from fat, and energy from
protein but a lower intake of energy from carbohydrate than
women.
Characteristics
Men (n = 413)
P-value1)
Women (n = 255)
P-value1) Non-MetS
(n = 184)
MetS (n = 229)
Non-MetS (n = 150)
MetS (n = 105) Age (Mean ± SD)
Yrs 48.0 ± 9.8 50.1 ± 10.6 0.041 54.0 ± 9.7 56.7 ± 8.9 0.024
BMI (Mean ± SD)2)
kg/m2 24.9 ± 2.4 26.6 ± 2.7 < 0.001 23.6 ± 2.6 26.3 ± 3.4 < 0.001
Smoking status (%)
Current-smoker 32.1 40.2 0.005 2.7 4.8 0.389
Ex-smoker 38.0 42.8 2.7 2.9
Non-smoker 29.9 17.0 94.7 92.4
Alcohol use (%)
< 1 time/week 41.9 41.1 0.437 89.3 89.5 0.688
1-2 times/week 36.4 31.9 6.7 3.8
≥ 3 times/week 21.7 27.1 4.0 6.7
Regular physical activity (%)
Yes 76.6 67.3 0.038 63.3 72.4 0.139
No 23.4 32.8 36.7 27.6
Prevalence of obesity (%)
Obesity (BMI ≥ 25 kg/m2) 44.6 69.9 < 0.001 30.7 61.9 < 0.001
Prevalence of MetS components (%)
Elevated waist circumference 29.9 76.9 < 0.001 20.0 72.4 < 0.001
Elevated triglycerides 41.9 85.6 < 0.001 28.7 66.7 < 0.001
Low HDL-cholesterol 18.5 44.5 < 0.001 33.3 78.1 < 0.001
Elevated fasting blood glucose 30.4 66.4 < 0.001 21.3 61.9 < 0.001
Elevated blood pressure 34.8 83.4 < 0.001 33.3 83.8 < 0.001
1)P-value was obtained from the Mantel-Haenszel chi-square test for categorical variables and the general linear model (GLM) for continuous variables.
2)P-value was obtained from the GLM after adjustment for age (continuous).
Table 2. Characteristics by the presence of metabolic syndrome (MetS) in men and women
Characteristics Total
(n = 668) Men
(n = 413) Women
(n = 255) P-value1)
Daily energy and nutrient intake (Mean ± SD)
Total energy (kcal) 1,780 ± 446.7 1,916 ± 451.4 1,560 ± 338.9 < 0.001
Energy from carbohydrate (%) 61.9 ± 7.2 61.1 ± 7.2 63.3 ± 6.9 < 0.001
Energy from fat (%) 21.4 ± 5.8 21.9 ± 5.8 20.7 ± 5.6 0.007
Energy from protein (%) 16.7 ± 2.9 17.0 ± 3.0 16.0 ± 2.6 < 0.001
Daily food consumption (Mean ± SD) (number of servings)
Grains 2.8 ± 0.7 2.9 ± 0.7 2.5 ± 0.7 < 0.001
Meat, fish, eggs, and beans 4.6 ± 2.0 5.0 ± 2.0 3.9 ± 1.7 < 0.001
Vegetables 7.4 ± 2.9 7.7 ± 2.9 6.8 ± 2.8 < 0.001
Fruits 1.5 ± 1.5 1.3 ± 1.5 1.9 ± 1.5 < 0.001
Dairy foods 0.6 ± 0.7 0.5 ± 0.7 0.7 ± 0.7 0.004
Oils, fats, and sugars 4.9 ± 2.8 5.4 ± 3.1 4.2 ± 2.1 < 0.001
(% of recommended servings)2)
Grains 77.6 ± 20.9 73.5 ± 18.2 84.2 ± 23.1 < 0.001
Meat, fish, eggs, and beans 104.3 ± 46.9 102.3 ± 41.2 107.5 ± 54.8 0.191
Vegetables 107.2 ± 42.2 110.5 ± 42.1 101.9 ± 42.0 0.011
Fruits 76.4 ± 89.7 55.7 ± 83.5 109.8 ± 89.4 < 0.001
Dairy foods 56.4 ± 69.3 50.3 ± 67.8 66.4 ± 70.7 0.004
Oils, fats, and sugars 109.2 ± 59.6 108.5 ± 62.7 110.3 ± 54.4 0.693
1)P-value was obtained from the Mantel-Haenszel chi-square test for categorical variables and the t-test for continuous variables.
2)The recommendation for six food groups was obtained from the Korean Food Guidance System of Dietary Reference Intakes for Korean published by the Korean Nutrition Society in 2010. Percentage (%) of recommended servings = (consumed number of servings / recommended number of servings) x100.
Table 1. continued
Energy and nutrient intake
Men (n = 413) Women (n = 255)
Non-MetS (n = 184)
MetS (n = 229)
Non-MetS (n = 150)
MetS (n = 105)
Mean ± SD Mean ± SD P-value1) Mean ± SD Mean ± SD P-value1)
Total energy (kcal) 1,899 ± 431.9 1,930 ± 466.9 0.448 1,560 ± 334.1 1,560 ± 347.3 0.832
Energy from carbohydrate (%) 61.0 ± 7.6 61.1 ± 6.9 0.709 62.8 ± 6.8 64.0 ± 7.1 0.366
Energy from fat (%) 22.0 ± 6.1 21.8 ± 5.6 0.737 21.1 ± 5.7 20.1 ± 5.4 0.361
Energy from protein (%) 16.9 ± 3.1 17.1 ± 3.0 0.809 16.1 ± 2.4 16.0 ± 2.9 0.679
Mean ± SD Mean ± SD P-value2) Mean ± SD Mean ± SD P-value2)
Carbohydrate (g) 282.5 ± 60.3 281.2 ± 65.2 0.802 250.3 ± 52.5 253.5 ± 56.3 0.572
Fat (g) 47.2 ± 20.8 45.3 ± 17.4 0.082 38.1 ± 15.0 36.2 ± 13.5 0.185
Protein (g) 79.3 ± 23.5 79.3 ± 22.3 0.162 64.7 ± 17.2 64.3 ± 20.4 0.775
Dietary fiber (g) 22.2 ± 6.7 23.0 ± 8.1 0.572 20.7 ± 5.8 22.4 ± 7.0 0.046
Vitamin A (μg RE) 756.3 ± 309.4 723.8 ± 372.2 0.533 728.2 ± 408.1 745.1 ± 378.6 0.619
Thiamin (mg) 1.2 ± 0.4 1.2 ± 0.4 0.095 1.0 ± 0.3 1.0 ± 0.3 0.103
Riboflavin (mg) 1.2 ± 0.4 1.2 ± 0.4 0.191 1.0 ± 0.3 1.0 ± 0.3 0.537
Niacin (mg) 16.3 ± 5.5 16.5 ± 6.0 0.418 13.3 ± 3.9 13.4 ± 4.6 0.837
Vitamin C (mg) 94.9 ± 41.3 95.0 ± 49.3 0.893 100.9 ± 51.5 99.8 ± 42.2 0.781
Calcium (mg) 526.7 ± 201.7 519.0 ± 200.5 0.540 500.8 ± 191.0 475.1 ± 189.6 0.140
Phosphorus (mg) 1,126 ± 329.0 1,131 ± 302.2 0.374 983.8 ± 244.4 989.8 ± 291.1 0.976
Sodium (mg) 4,692 ± 1,424 4,841 ± 1,607 0.878 3,729 ± 1,259 3,964 ± 1,239 0.058
Potassium (mg) 2,901 ± 823.2 2,880 ± 821.5 0.353 2,685 ± 794.7 2,770 ± 913.0 0.187
Iron (mg) 15.9 ± 4.8 16.4 ± 5.9 0.704 13.6 ± 4.0 14.5 ± 5.6 0.335
Cholesterol (mg) 306.7 ± 165.0 289.3 ± 140.0 0.121 237.7 ± 133.8 220.5 ± 115.0 0.509
1)P-value was obtained from the general linear model (GLM) after adjustment for age (continuous), BMI (continuous), smoking status (current-, ex-, or non-smoker), alcohol use (< 1 time/week, 1-2 times/week, or ≥ 3 times/week), and regular physical activity (yes or no).
2)P-value was obtained from the GLM after adjustment for age (continuous), BMI (continuous), smoking status (current-, ex-, or non-smoker), alcohol use (< 1 time/week, 1-2 times/week, or ≥ 3 times/week), regular physical activity (yes or no), and total energy intake (continuous).
Table 3. Daily energy and nutrient intake by the presence of metabolic syndrome (MetS) in men and women
Characteristics by the presence of metabolic syndrome in men and women
Men with metabolic syndrome were likely to be older, have higher BMI, be current- or ex-smokers, and be less physically active than those without metabolic syndrome. Women with metabolic syndrome were likely to be older and have higher BMI than those without metabolic syndrome. However, there were no differences in smoking status, alcohol use, and physical activity level by the presence of metabolic syndrome in women.
Prevalence of obesity and all components of metabolic syndrome significantly differed by the presence of metabolic syndrome in both men and women (P-value < 0.001) (Table 2).
Energy and nutrient intakes by the presence of metabolic syndrome in men and women
In men, daily intakes of total energy and nutrients did not differ by the presence of metabolic syndrome. In women, subjects with metabolic syndrome had a higher intake of dietary fiber compared to those without metabolic syndrome (20.7 g/day in women without metabolic syndrome vs. 22.4 g/day in women with metabolic syndrome, P-value = 0.046). It was attributed to difference in dietary fiber intake from beans (data not shown). In addition, there was a marginally significant difference in sodium intake by the presence of metabolic syndrome in women (3,729 mg/day in women without metabolic syndrome vs. 3,964 mg/day in women with metabolic syndrome, P-value = 0.058). Intakes of total energy and other nutrients did
not differ by the presence of metabolic syndrome in women (Table 3).
Food consumption by the presence of metabolic syndrome in men and women
Mean number of servings consumed and percentages of the recommendation for food groups by the presence of metabolic syndrome among men and women are presented in Table 4.
Men with metabolic syndrome had a lower consumption of fruits compared to those without metabolic syndrome (1.6 servings/day in men without metabolic syndrome vs. 1.1 servings/day in men with metabolic syndrome, P-value = 0.001).
Fresh fruits and fruit juice were inversely associated with metabolic syndrome, respectively. The mean daily consumption of oils, fats, and sugars differed by the presence of metabolic syndrome in men (5.8 servings/day in men without metabolic syndrome vs. 5.0 servings/day in men with metabolic syndrome, P-value = 0.015). Percentages of the recommendation for fruits and oils, fats, and sugars were significantly lower in metabolic syndrome men compared to non-metabolic syndrome men.
In women, subjects with metabolic syndrome had a
significantly lower intake of dairy foods than subjects without
metabolic syndrome (0.8 servings/day in women without
metabolic syndrome vs. 0.5 servings/day in women with
metabolic syndrome, P-value = 0.001). According to subgroups
of the dairy foods group, consumption of other dairy products
significantly differed by the presence of metabolic syndrome
Food consumption
Men (n = 413) Women (n = 255)
Non-MetS (n = 184)
MetS (n = 229)
Non-MetS (n = 150)
MetS (n = 105)
Mean ± SD Mean ± SD P-value1) Mean ± SD Mean ± SD P-value1)
Number of servings
Grains 2.9 ± 0.7 2.9 ± 0.7 0.155 2.5 ± 0.7 2.6 ± 0.7 0.063
Meat, fish, eggs, and beans 4.9 ± 2.1 5.1 ± 1.9 0.671 3.9 ± 1.5 4.0 ± 2.0 0.554
Vegetables 7.6 ± 2.7 7.8 ± 3.2 0.561 6.5 ± 2.7 7.1 ± 2.8 0.198
Fresh vegetables 5.2 ± 2.1 5.4 ± 2.6 0.350 4.8 ± 2.4 5.0 ± 2.1 0.555
Salted vegetables 2.4 ± 1.5 2.4 ± 1.5 0.578 1.7 ± 1.0 2.0 ± 1.3 0.121
Fruits 1.6 ± 1.5 1.1 ± 1.4 0.001 2.0 ± 1.5 1.8 ± 1.4 0.265
Fresh fruits 1.3 ± 1.4 1.0 ± 1.3 0.009 1.9 ± 1.4 1.6 ± 1.4 0.179
Fruit juice 0.3 ± 0.6 0.2 ± 0.5 0.047 0.1 ± 0.3 0.2 ± 0.5 0.266
Dairy foods 0.6 ± 0.7 0.4 ± 0.6 0.095 0.8 ± 0.8 0.5 ± 0.5 0.001
Milk 0.3 ± 0.5 0.2 ± 0.4 0.118 0.4 ± 0.5 0.3 ± 0.4 0.060
Other dairy products 0.3 ± 0.4 0.2 ± 0.4 0.164 0.4 ± 0.6 0.2 ± 0.3 0.002
Oils, fats, and sugars 5.8 ± 3.4 5.0 ± 2.8 0.015 4.4 ± 2.3 4.0 ± 1.9 0.078
Percentage (%) of recommended servings2)
Grains 72.3 ± 17.6 74.4 ± 18.6 0.144 82.8 ± 23.0 86.2 ± 23.3 0.063
Meat, fish, eggs, and beans 99.7 ± 43.1 104.4 ± 39.5 0.746 103.7 ± 43.4 112.9 ± 67.7 0.503
Vegetables 108.8 ± 37.9 111.8 ± 45.2 0.561 97.7 ± 41.0 108.0 ± 42.9 0.180
Fruits 63.5 ± 86.9 49.5 ± 80.3 0.013 111.7 ± 84.0 107.1 ± 96.9 0.340
Dairy foods 58.0 ± 74.1 44.2 ± 61.7 0.095 78.6 ± 78.8 48.9 ± 52.6 0.001
Oils, fats, and sugars 116.4 ± 69.1 102.2 ± 56.6 0.014 113.5 ± 58.2 105.8 ± 48.3 0.059
1)P-value was obtained from the general linear model (GLM) after adjustment for age (continuous), BMI (continuous), smoking status (current-, ex-, or non-smoker), alcohol use (< 1 time/week, 1-2 times/week, or ≥ 3 times/week), regular physical activity (yes or no), and total energy intake (continuous).
2)The recommendation for six food groups was obtained from the Korean Food Guidance System of Dietary Reference Intakes for Korean published by the Korean Nutrition Society in 2010. Percentage (%) of recommended servings = (consumed number of servings / recommended number of servings) × 100.
Table 4. Daily food consumption by the presence of metabolic syndrome (MetS) in men and women
but milk consumption did not reach significance. Percentage of the recommendation for dairy foods was also lower in metabolic syndrome women (48.9%) compared to non- metabolic syndrome women (78.6%).
DISCUSSION
In the study of Korean adults from outpatient clinics, the association between nutrient intake, food consumption and metabolic syndrome was evaluated based on three days of dietary intake data by sex. Fruits consumption in men and dairy foods consumption in women were inversely associated with the prevalence of metabolic syndrome. In addition, lower percentages of the recommended servings for fruits and dairy foods were observed in metabolic syndrome subjects compared to non-metabolic syndrome subjects. However, nutrient intake did not differ by the presence of metabolic syndrome in both men and women.
Our finding on the inverse association between dairy foods and metabolic syndrome are consistent with those from previous epidemiologic studies. A higher intake of dairy foods was associated with lower risks for metabolic syndrome and its components in Western [8-12] and Asian populations [20,23,24]. Dairy foods are major sources of calcium, vitamin D, potassium, and magnesium, which have been inversely associated with individual components of metabolic syndrome, including elevated fasting blood glucose, elevated blood
pressure, elevated triglycerides, and obesity [9,10,12] although the present study did not find any inverse association between these nutrients and metabolic syndrome. In addition, Tehranian adult study [20] indicated that the association between dairy foods consumption and metabolic syndrome became weaker after additional adjustment for calcium intake. It might explain the beneficial effects of calcium and other nutrients that are predominant in dairy foods on the development of metabolic syndrome.
As dairy foods can be classified into high-fat or low-fat dairy
foods, several studies in Western populations have examined
the associations with metabolic syndrome by the types of dairy
foods. The inverse associations of high-fat dairy foods, low-fat
dairy foods, and total milk with metabolic syndrome were
observed among middle-aged and older US women [9]. In
addition, the prevalence of metabolic syndrome was inversely
associated with yogurt consumption but positively associated
with cheese consumption based on data from the National
Health and Nutrition Examination Survey in 1999-2004 [12]. In
this study, when the total dairy foods group was divided into
milk and other dairy products (e.g., yogurt, cheese, and
ice-cream), consumption of other dairy products rather than
milk significantly differed by the presence of metabolic
syndrome in women. Previous studies in Korean adults reported
that milk and other dairy products, such as yogurt were
inversely associated with the risk of metabolic syndrome,
respectively [23,24,32]. Compared to dairy foods consumption
in Western countries, the amount of dairy food consumed in Korean population is lower since the typical Korean meal does not include dairy foods. Inadequate consumption of dairy foods below the recommendation is prevalent among Korean adults and it was known to be associated with metabolic syndrome [26]. Therefore, the amount of dairy foods consumption is needed to be increased to bring better health outcomes.
We found that a high intake of fruits was inversely associated with the risk of metabolic syndrome in men and it was in agreement with previous studies [6,7,19]. A cross-sectional study of Finnish adults [7] showed that high berries consump- tion was related to a low prevalence of metabolic syndrome in men. Among Tehranian women, subjects in the highest quintile of fruits intake had significantly lower risks for metabolic syndrome and its components compared to those in the lowest quintile [19]. High consumption of fruits may reduce the risk of metabolic syndrome through their beneficial compounds, such as fruits fiber [33] and antioxidants [14]. However, the effect of a single nutrient on metabolic syndrome might be too small to detect and beneficial nutrients in healthy foods are highly correlated [34] so that it is difficult to completely separate the independent effects of these nutrients on the risk of having metabolic syndrome in this study. Further mechanism studies are needed to determine what nutrients are responsible for the potential beneficial effects of these foods on the development of metabolic syndrome.
Gender differences in the association between food consump- tion and metabolic syndrome were observed in this study.
Several previous studies showed that an inverse association between dairy foods consumption and metabolic syndrome was stronger in women, especially in middle-aged or elderly subjects, than in men [9,24,35]. They explained that the effects of sex hormones and menopausal status on calcium metabolism might lead to gender differences in this association. In post- menopausal women, decreases in intestinal calcium absorption and renal calcium conservation were observed by a drop in estrogen level, and increases in calcium binding to fatty acids or bile acids resulted in interference with absorption of cholesterol and lipids [25,36]. High calcium intake might also lower body weight or waist circumference by binding to fatty acids and excreting from the body [37]. Therefore, the inverse association of dairy foods with metabolic syndrome has been more frequently found in women than in men. In this study, about 76% of women subjects were aged 50 years or more, but we could not examine the effects of sex hormones or menopausal status on the association between dairy foods intake and metabolic syndrome due to the lack of information.
In addition, the distinct features of metabolic syndrome might exist by gender. Food consumption might have differential influence on each metabolic syndrome component and it can lead to different associations between food consumption and metabolic syndrome by gender. Limited studies investigating gender differences in the association between diet and metabolic syndrome were conducted among Korean adults. Additional studies are needed to identify different mechanisms and associations between dietary factors and metabolic syndrome by gender.
In this study, consumed servings and percentage of the
recommendation of oils, fats, and sugars were lower in meta- bolic syndrome men than in non-metabolic syndrome men. On the other hand, a previous study in Korean men aged 30 years and older reported that subjects with metabolic syndrome had significantly higher intakes of oily foods compared with those without metabolic syndrome [38]. We could not explain this inconsistent finding clearly. Although there was the difference in consumption of oils, fats, and sugars by the presence of metabolic syndrome in the current study, consumption of oils, fats, and sugars in both non-metabolic syndrome and metabolic syndrome subjects exceeded the recommended intake level.
Excessive consumption of this food group has been associated with obesity and other chronic diseases [39,40], so Korean adults, regardless of having metabolic syndrome, need to reduce the consumption of oils, fats, and sugars to prevent further progression of chronic diseases.
Several limitations should be considered to correctly interpret findings from this study. Cross-sectional design cannot define the causal relationship between dietary factors and the risk of metabolic syndrome. As the subjects of this study were recruited at outpatient clinics, they were more likely to be obese and have a high risk of metabolic syndrome although they had no serious illness. Therefore, our findings may not be directly generalized to the general Korean adult population. However, we examined various dietary variables, including nutrients, foods, and percentage of the recommendation for food group consumption, associated with metabolic syndrome by sex using three days of dietary intake data that could closely estimate the intake of dietary variables in this study sample.
In conclusion, low consumption of fruits and dairy foods might be associated with the risk of metabolic syndrome in Korean adults. Dietary recommendations for individuals and populations who are at high risk of metabolic syndrome can be suggested based on the results of this study. In addition, findings of the present study can be used to extend the knowledge about the mechanism of dietary variables related to the development of metabolic syndrome and its compo- nents. Prospective and intervention studies are needed to confirm the cause-effect association between the specific dietary attributes and metabolic syndrome.
ACKNOWLEDGEMENTS
This study is based on a part of the first author (S. Song)’s Ph.D. dissertation published by Seoul National University in August 2014.
REFERENCES
1. Grundy SM, Cleeman JI, Daniels SR, Donato KA, Eckel RH, Franklin BA, Gordon DJ, Krauss RM, Savage PJ, Smith SC Jr, Spertus JA, Costa F; American Heart Association; National Heart, Lung, and Blood Institute. Diagnosis and management of the metabolic syndrome:
an American Heart Association/National Heart, Lung, and Blood Institute Scientific Statement. Circulation 2005;112:2735-52.
2. Ford ES, Schulze MB, Pischon T, Bergmann MM, Joost HG, Boeing H. Metabolic syndrome and risk of incident diabetes: findings from the European Prospective Investigation into Cancer and Nutrition-
Potsdam Study. Cardiovasc Diabetol 2008;7:35.
3. Mottillo S, Filion KB, Genest J, Joseph L, Pilote L, Poirier P, Rinfret S, Schiffrin EL, Eisenberg MJ. The metabolic syndrome and cardio- vascular risk a systematic review and meta-analysis. J Am Coll Cardiol 2010;56:1113-32.
4. Grundy SM. Metabolic syndrome pandemic. Arterioscler Thromb Vasc Biol 2008;28:629-36.
5. Lim S, Shin H, Song JH, Kwak SH, Kang SM, Won Yoon J, Choi SH, Cho SI, Park KS, Lee HK, Jang HC, Koh KK. Increasing prevalence of metabolic syndrome in Korea: the Korean National Health and Nutrition Examination Survey for 1998-2007. Diabetes Care 2011;34:
1323-8.
6. Yoo S, Nicklas T, Baranowski T, Zakeri IF, Yang SJ, Srinivasan SR, Berenson GS. Comparison of dietary intakes associated with metabolic syndrome risk factors in young adults: the Bogalusa Heart Study.
Am J Clin Nutr 2004;80:841-8.
7. Kouki R, Schwab U, Hassinen M, Komulainen P, Heikkilä H, Lakka TA, Rauramaa R. Food consumption, nutrient intake and the risk of having metabolic syndrome: the DR's EXTRA Study. Eur J Clin Nutr 2011;65:368-77.
8. Lutsey PL, Steffen LM, Stevens J. Dietary intake and the develop- ment of the metabolic syndrome: the Atherosclerosis Risk in Communities study. Circulation 2008;117:754-61.
9. Liu S, Song Y, Ford ES, Manson JE, Buring JE, Ridker PM. Dietary calcium, vitamin D, and the prevalence of metabolic syndrome in middle-aged and older U.S. women. Diabetes Care 2005;28:2926-32.
10. Fumeron F, Lamri A, Abi Khalil C, Jaziri R, Porchay-Baldérelli I, Lantieri O, Vol S, Balkau B, Marre M; Data from the Epidemiological Study on the Insulin Resistance Syndrome (DESIR) Study Group.
Dairy consumption and the incidence of hyperglycemia and the metabolic syndrome: results from a French prospective study, Data from the Epidemiological Study on the Insulin Resistance Syndrome (DESIR). Diabetes Care 2011;34:813-7.
11. Elwood PC, Pickering JE, Fehily AM. Milk and dairy consumption, diabetes and the metabolic syndrome: the Caerphilly prospective study. J Epidemiol Community Health 2007;61:695-8.
12. Beydoun MA, Gary TL, Caballero BH, Lawrence RS, Cheskin LJ, Wang Y. Ethnic differences in dairy and related nutrient consumption among US adults and their association with obesity, central obesity, and the metabolic syndrome. Am J Clin Nutr 2008;87:1914-25.
13. Aleixandre A, Miguel M. Dietary fiber in the prevention and treatment of metabolic syndrome: a review. Crit Rev Food Sci Nutr 2008;48:905-12.
14. Puchau B, Zulet MA, de Echávarri AG, Hermsdorff HH, Martínez JA.
Dietary total antioxidant capacity is negatively associated with some metabolic syndrome features in healthy young adults. Nutrition 2010;26:534-41.
15. Mattei J, Bhupathiraju S, Tucker KL. Higher adherence to a diet score based on American Heart Association recommendations is associated with lower odds of allostatic load and metabolic syndrome in Puerto Rican adults. J Nutr 2013;143:1753-9.
16. Kesse-Guyot E, Ahluwalia N, Lassale C, Hercberg S, Fezeu L, Lairon D. Adherence to Mediterranean diet reduces the risk of metabolic syndrome: a 6-year prospective study. Nutr Metab Cardiovasc Dis 2013;23:677-83.
17. Fogli-Cawley JJ, Dwyer JT, Saltzman E, McCullough ML, Troy LM, Meigs JB, Jacques PF. The 2005 Dietary Guidelines for Americans and risk of the metabolic syndrome. Am J Clin Nutr 2007;86:
1193-201.
18. Babio N, Bulló M, Basora J, Martínez-González MA, Fernández-Ballart J, Márquez-Sandoval F, Molina C, Salas-Salvadó J; Nureta-PREDIMED Investigators. Adherence to the Mediterranean diet and risk of metabolic syndrome and its components. Nutr Metab Cardiovasc Dis 2009;19:563-70.
19. Esmaillzadeh A, Kimiagar M, Mehrabi Y, Azadbakht L, Hu FB, Willett WC. Fruit and vegetable intakes, C-reactive protein, and the metabolic syndrome. Am J Clin Nutr 2006;84:1489-97.
20. Azadbakht L, Mirmiran P, Esmaillzadeh A, Azizi F. Dairy consumption is inversely associated with the prevalence of the metabolic syndrome in Tehranian adults. Am J Clin Nutr 2005;82:523-30.
21. Park MH, Kim D, Park MS, Kim MY, Paik HY, Kim OS, Oh SY, Lee SS, Ok SH. Cultural Life in Korea. Seoul: Kyomunsa; 2003.
22. Song S, Jung HJ, Shim JE, Paik HY. Assessment of food group intake in Korean population with a newly developed food group database.
J Food Compost Anal 2014;36:72-8.
23. Kim J. Dairy food consumption is inversely associated with the risk of the metabolic syndrome in Korean adults. J Hum Nutr Diet 2013;26 Suppl 1:171-9.
24. Lee CJ, Joung H. Milk intake is associated with metabolic syndrome:
using data from the Korea National Health and Nutrition Exami- nation Survey 2007-2010. Korean J Community Nutr 2012;17:
795-804.
25. Cho GJ, Park HT, Shin JH, Hur JY, Kim YT, Kim SH, Lee KW, Kim T. Calcium intake is inversely associated with metabolic syndrome in postmenopausal women: Korea National Health and Nutrition Survey, 2001 and 2005. Menopause 2009;16:992-7.
26. Jung HJ, Han SN, Song S, Paik HY, Baik HW, Joung H. Association between adherence to the Korean Food Guidance System and the risk of metabolic abnormalities in Koreans. Nutr Res Pract 2011;5:
560-8.
27. Jung HJ, Lee SE, Kim D, Noh H, Song S, Kang M, Song Y, Paik HY.
Development and feasibility of a web-based program 'Diet Evaluation System (DES)' in urban and community nutrition survey in Korea. Korean J Health Promot 2013;13:107-15.
28. Jung HJ, Lee SE, Kim D, Noh H, Song S, Kang M, Song YJ, Paik HY. Improvement in the technological feasibility of a web-based dietary survey system in local settings. Asia Pac J Clin Nutr 2015;24:
308-15.
29. Rural Resources Development Institute (KR). Food Composition Table. 7th rev. ed. Suwon: Rural Development Administration; 2006.
30. The Korean Nutrition Society. Dietary Referece Intakes for Koreans.
1st rev. ed. Seoul: The Korean Nutrition Society; 2010.
31. Lee SY, Park HS, Kim DJ, Han JH, Kim SM, Cho GJ, Kim DY, Kwon HS, Kim SR, Lee CB, Oh SJ, Park CY, Yoo HJ. Appropriate waist circumference cutoff points for central obesity in Korean adults.
Diabetes Res Clin Pract 2007;75:72-80.
32. Shin H, Yoon YS, Lee Y, Kim CI, Oh SW. Dairy product intake is inversely associated with metabolic syndrome in Korean adults:
Anseong and Ansan cohort of the Korean Genome and Epidemio- logy Study. J Korean Med Sci 2013;28:1482-8.
33. Hosseinpour-Niazi S, Mirmiran P, Sohrab G, Hosseini-Esfahani F, Azizi F. Inverse association between fruit, legume, and cereal fiber and the risk of metabolic syndrome: Tehran Lipid and Glucose Study.
Diabetes Res Clin Pract 2011;94:276-83.
34. Hu FB. Dietary pattern analysis: a new direction in nutritional epidemiology. Curr Opin Lipidol 2002;13:3-9.
35. Otsuka R, Imai T, Kato Y, Ando F, Shimokata H. Relationship between number of metabolic syndrome components and dietary factors in middle-aged and elderly Japanese subjects. Hypertens Res 2010;33:548-54.
36. Shin SK, Kim MK, Lee YH, Shin DH, Shin MH, Chun BY, Choi BY.
The cross-sectional relationship between dietary calcium intake and metabolic syndrome among men and women aged 40 or older in rural areas of Korea. Nutr Res Pract 2015;9:328-35.
37. Dugan CE, Barona J, Fernandez ML. Increased dairy consumption differentially improves metabolic syndrome markers in male and female adults. Metab Syndr Relat Disord 2014;12:62-9.
38. Shin A, Lim SY, Sung J, Shin HR, Kim J. Dietary intake, eating habits, and metabolic syndrome in Korean men. J Am Diet Assoc 2009;109:
633-40.
39. Cohen DA, Sturm R, Lara M, Gilbert M, Gee S. Discretionary calorie intake a priority for obesity prevention: results of rapid participatory approaches in low-income US communities. J Public Health (Oxf) 2010;32:379-86.
40. Malik VS, Popkin BM, Bray GA, Després JP, Hu FB. Sugar-sweetened beverages, obesity, type 2 diabetes mellitus, and cardiovascular disease risk. Circulation 2010;121:1356-64.