a부교수, 가톨릭대학교 의과대학 성모병원 교정과.
b조교수, 울산대학교 공과대학 조선해양공학부.
c대학원생, 울산대학교 대학원 의학과 교정학.
d부교수, 울산대학교 의과대학 서울아산병원 이비인후과.
e교수, g부교수, 울산대학교 의과대학 서울아산병원 교정과.
f부교수, UCLA 치과대학 교정과.
교신저자: 성상진.
서울시 송파구 풍납2동 388-1 서울아산병원 교정과.
02-3010-3845; e-mail, [email protected].
원고접수일: 2009년 10월 7일 / 원고최종수정일: 2010년 2월 28일 / 원고채택일: 2010년 3월 3일.
DOI:10.4041/kjod.2010.40.2.66
폐쇄성 수면무호흡 환자의 상기도 형태의 특징과 압력강하에 관한 3차원 전산유체역학해석
모성서aㆍ안형택bㆍ이정선cㆍ정유삼dㆍ문윤식eㆍ배응권fㆍ성상진g
폐쇄성 수면무호흡(obstructive sleep apnea, OSA)은 수면 중에 반복적으로 상기도의 완전폐쇄나 부분폐쇄가 일어 나는 질환으로서 흡기된 공기는 반드시 상기도라는 연조직 관(tube) 구조를 통과해야 하므로 상기도의 폐쇄경향은 관의 형태 및 관을 통과하는 공기의 유체역학적 특성에 따라서도 큰 영향을 받을 수 있다. 본 연구에서는 OSA 환자 3인의 치료 전 상기도 CT 이미지를 이용하여 개별화된 3차원 유한요소모델 A, B, C를 제작하고, 비공 당 170, 200, 230 ml/s의 흡기유량에 대하여 3차원 전산유체역학 해석을 시행하였다. 상기도의 유속, 음압 그리고 압력강하를 측정 한 결과 관찰된 3개의 모델에서 모두 단면적이 가장 작은 부위에서 유속이 증가하였고, 음압이 크게 나타났다. 기도의 형태는 구개인두와 구인두 부위에서 좁아지는 형태를 가지며, 최소 단면적 영역과 하인두 단면적의 차이가 클수록 유속과 음압의 변화가 크게 나타났다. 비강 부위의 최고 압력과 최소 단면적 영역의 최저 압력의 차이를 의미하는 압력강하는 상기도 저항을 종합적으로 판단할 수 있는 유용한 지표이며, 유량에 따라 증가하였다. (대치교정지 2010;
40(2):66-76)
주요 단어: 폐쇄성 수면무호흡, 상기도, 전산유체역학, 압력강하
서론
상기도(upper airway)는 비강, 인두(pharynx), 후두 (epiglottis), 기관지로 구성되며, 좌, 우의 비강은 하 비갑개의 후방부에서 하나로 합쳐지면서 비인두 (nasopharynx)를 형성하게 된다. 인두는 비인두, 구 개인두(velopharynx), 구인두(oropharynx), 하인두(hy- popharynx)의 네 부분으로 나눌 수 있으며, 20개 이 상의 근육으로 구성된, 발음, 연하, 호흡에 관여하는 복잡한 구조물이다.
수면무호흡증후군(sleep apnea syndrome, SAS)은 7시간의 수면 중에 무호흡(10초 이상 지속되는 기 류정지)이 30회 이상 또는 수면 1시간당 무호흡수 (apnea index, AI)가 5회 이상인 경우로 진단되며, 중 추형, 폐쇄형(말초형), 혼합형의 세 가지로 분류된 다.1 폐쇄성 수면무호흡(obstructive sleep apnea, OSA)은 수면 중에 반복적으로 상기도의 완전폐쇄 나 부분폐쇄가 일어나는 질환으로 남성에서 약 2 - 4%, 여성에서 약 0.5 - 2%의 유병률을 보인다.2 수 면 중 반복되는 상기도의 폐쇄는 수면 중 동맥혈 산 소포화도의 저하, 고탄산가스 혈증, 호흡성 산증을 일으키고, 임상적으로는 숙면을 방해하여 한 낮의 졸음, 호흡 순환 장애, 심혈관계 질환, 정신신경계 장애 등의 다양한 증상을 유발한다.3
SAS의 확정진단 및 병형 판정을 위해서는 야간 수면다원검사(polysomnography, PSG)가 실시된다.
OSA의 경우 폐쇄부위 및 폐쇄기전을 밝히는 것이 원인의 진단, 치료법의 선택, 치료 효과의 평가에 있어서 중요하며, 이비인후과적인 검사, 측모두부계 측 방사선사진이나 CT, MRI 등을 진단에 활용할 수 있다.2-5 수면 중 상기도는 비강, 아데노이드, 구
개편도, 연구개나 구개수(uvula) 영역 또는 설근부에 서 협착되거나 폐쇄될 수 있으며, 이를 개선하기 위 한 다양한 수술적 치료법들이 소개되고 있다.6 보존 적 치료법으로 체중 감량, 원인 제거, 약물 요법과 함께 수면 중에 지속적 양압공급장치(continuous positive airway pressure, CPAP), 치과 구강장치(oral appliance, sleep splint, mandible advancement device 등으로 지칭됨)가4 널리 사용되고 있다. 구강장치는 상기도 설근부를 확장시키는 효과가 있는데, 하악 이 전방으로 위치함에 따라 이설골근(genioglossus muscle)의 근활성이 증대되어 흡기 시의 기도 내 음 압에 의해 혀가 말려 들어가는 것을 보상하는 것으 로 보고되고 있으며, CPAP 치료에 대한 거부감이 있는 환자에서 보존적인 치료법으로 많이 사용되고 있다.
OSA 환자의 기도폐쇄에 대한 병인론은 다양한 데,7-9 흡기 시 공기가 반드시 상기도라는 연조직 관 (tube) 구조를 통과해야 한다면, Bernoulli의 정리에 따라 상기도의 가장 좁은 부위에서 기류 속도가 최 대로 증가하고 음압 또한 최대에 이르게 된다. 또한 단면이 일정한 긴 원관 내 유동에 관하여 기술한 Poiseuille의 법칙에 따른다면, 유량이 일정하다고 할 때 기도 관내의 압력강하는 관의 길이에 비례하 고 관의 반지름의 4승에 비례하므로, 상대적으로 좁 고 긴 구간을 통과하는 공기의 유동은 기도폐쇄를 더 악화시키는 요인이 될 수 있다. 따라서 상기도 폐쇄경향은 관의 형태 및 이 관을 통과하는 공기의 유체역학적 특성에 따라서도 큰 영향을 받을 수 있 다. 이전에는 비강 또는 인두 부위만을 대상으로 20 배 크기의 Styrofoam 모델,10 3배 크기의 Plexiglass plate 모델11 그리고 전산유체역학(computational fluid dynamics, CFD) 모델을12 이용한 연구가 시도되었 다. 최근에는 환자의 두경부 CT 영상으로부터 관심 영역(region of interest - airway)을 3차원 입체로 재 구성 해주는 프로그램을 이용하여, 비강과 인두가 해부학적으로 잘 재현된 환자별 상기도 유체해석모 델을 제작하고, 전산유체역학 프로그램을 이용하여 흡기와 호기 시의 상기도 내 기류(air flow) 특성과 기류의 기도벽(airway wall)에 대한 영향을 유체역학 적인 면에서 해석할 수 있게 되었다.13
하지만 성인 OSA 환자에서 개별화된 3차원 모델 을 제작하고, 해부학적으로 다양한 형태의 상기도 를 대상으로 CFD 해석을 시행하여, 그 특성을 비교 한 보고는 이제까지 없었다.
본 연구에서는 치과 구강장치 치료를 시행한 환
자 중에서 상기도의 형태적 특징이 상이한 환자 3 인의 상기도 CFD 모델을 대상으로 170, 200, 230 ml/s의 흡기 유량에 대하여 전산유체역학 해석을 시 행하여 흡기 시 상기도 내 유속(flow velocity)의 변 화, 음압(negative pressure) 분포, 압력강하(pressure drop) 값을 구하고, 기도의 해부학적 형태와의 관련 성을 비교하여 OSA 환자에서 기도 폐쇄 요인을 생 체유체역학(Bio-Fluid Mechanics)적 관점에서 살펴보 았다.
연구방법 연구대상
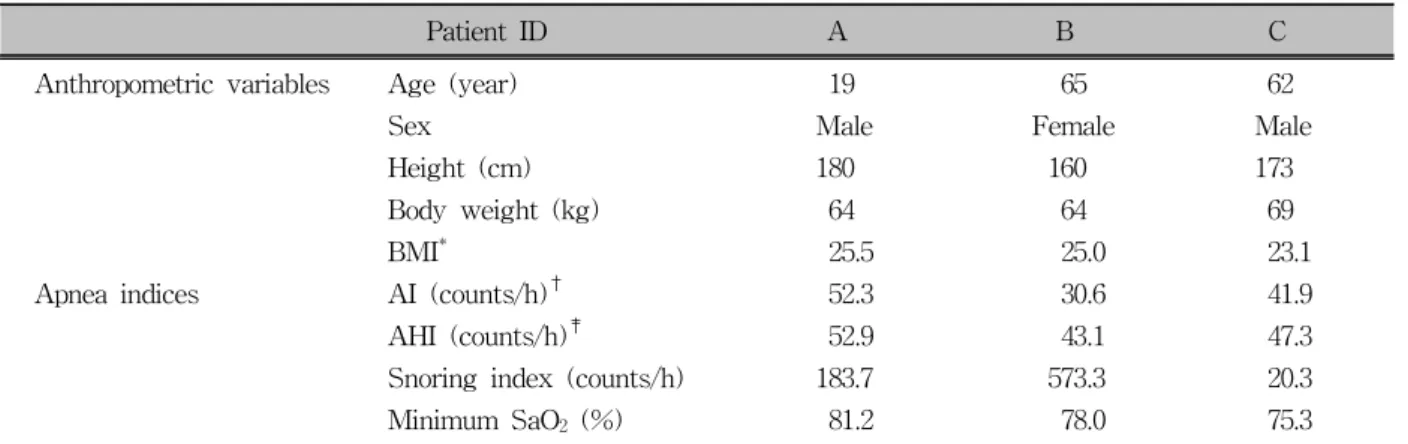
서울아산병원 이비인후과에서 PSG 검사를 실시 하여 중등도 이상의 OSA증상이 있는 것으로 평가 되어, 치과에서 구강장치 치료를 시행한 환자 30명 중 PSG 검사에서 AI, AHI 항목에서 비슷한 정도의 severity를 가지지만, 상기도의 길이가 다른 환자 3 인을 선정하였다 (Tables 1 and 2).
연구방법 전산화 단층촬영
치과 구강장치 시술 전 상기도의 3차원적인 형태 를 파악하기 위하여, 환자를 앙와위 자세에서 head cradle에 후두부를 위치시키고, 환자의 정중 시상면 과 FH 평면을 촬영장비의 guiding laser light와 일치 시킨 상태에서, General Electric Light Speed QX/i (DOTmed Inc., WI, USA)로 컴퓨터단층촬영(CT)을 시행하였다. 상안와연에서 설골 2 cm 하방까지 총 12초 간, 호기 마지막 시기에 인두부위가 촬영되도 록 실시하였다. 이 때 촬영조건은 120 kVp, 360 mA, rotation time 0.5 s, pitch 3, HQ mode이며, slice thick- ness는 1.25 mm였다.
3D 유한요소모델 제작과 형태 비교
촬영된 상기도 CT 이미지는 1 mm 간격으로 re- construction되었다. 상기도는 Bionix Body Builder (version 3.0, CANTIBio Inc., Suwon, Korea) 프로그 램으로 모니터 상에서 관찰 시, air 부분은 완전히 선택되면서 연조직 부분은 전혀 선택되지 않으며, 비강 내 가장 좁은 부위의 air 영역까지(region of in-
Patient ID A B C
Anthropometric variables Age (year) 19 65 62
Sex Male Female Male
Height (cm) 180 160 173
Body weight (kg) 64 64 69
BMI* 25.5 25.0 23.1
Apnea indices AI (counts/h)† 52.3 30.6 41.9
AHI (counts/h)‡ 52.9 43.1 47.3
Snoring index (counts/h) 183.7 573.3 20.3
Minimum SaO2 (%) 81.2 78.0 75.3
*BMI (body mass index), weight, kg/height² in m2; †AI (apnea index), the number of apneas per 1 hour of sleep; ‡AHI (apnea-hypopnea index), the number of apneas and hypopneas per 1 hour of sleep; SaO2, O2 saturation.
Table 1. Anthropometric variables and Apnea indices
Model (patient ID) SMA-W (mm) SMA-T (mm) AWL (mm) In-A (mm2) SMA-A (mm2) Out-A (mm2)
A 13.7 3.0 113 87.0 34.9 260.2
B 13.4 7.2 93 109.5 83.5 372.7
C 17.6 5.8 100 172.3 86.1 198.8
SMA-W, Lateral width of the section of minimum area; SMA-T, anterior-posterior thickness of the section of minimum area; AWL, length of airway; In-A (inlet area), sum of the cross-sectional area of left and right nostrils;
SMA-A (SMA area), area of the section of minimum area; Out-A (outlet area), cross-sectional area of hypopharynx in the model.
Table 2. Morphological characteristics of upper airway models for 3 subjects
terest, ROI) 자동선택(segmentation) 될 수 있도록 0 - 800 구간의 threshold를 사용하여 지정하였다.
외비공의 입구는 각각의 CT 이미지를 안와에서 설골 방향으로 관찰 시, alar의 외형이 소실되기 직 전 이미지에서 관찰되는 외비공 영역을 기준으로 설정하였으며, 하인두 하단의 출구(상기도 모델의 설골 방향 최하부)는 시상면으로 재구성된 CT 이미 지 중에서, 정중 시상면 상에서 관찰되는 upper eso- phageal sphincter의14 상부 이미지에서 관찰되는 기 도영역을 기준으로 설정하였다.
상악동 등 호흡과 관련 없는 부분들은 수작업으로 제거하여 3 dimensional (3D) surface model을 생성하 였다(Bionix에서 적용한 air 영역의 threshold 구간은 V works 4.0 (Cybermed, Seoul, Korea)을 기준으로 대략 −1024 - −220의 CT number에 해당함).
3D surface model의 내부는 Hypermesh (version 6.0, Altair Engineering, Troy, MI, USA) 프로그램을 이용하여, standard growth and normal mesh gen-
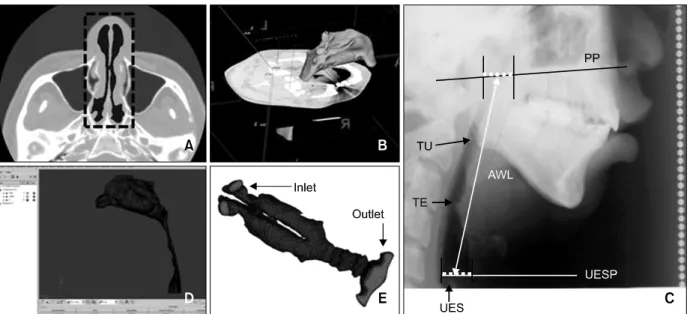
eration 옵션으로 사면체요소(tetrahedron element)로 분할하였다 (Fig 1).
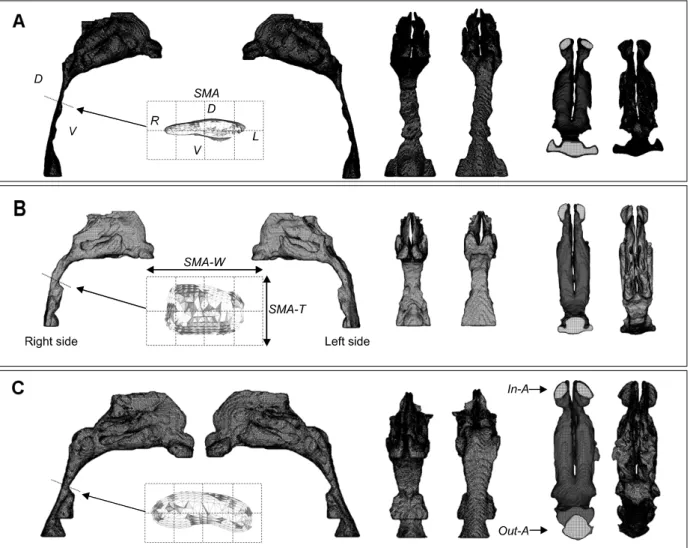
3D 유한요소모델 A, B, C는 공통적으로 구개인 두에서 구인두로 이행되는 부위에서 단면적이 점차 감소하는 형태를 가진다. 3D 모델을 측면에서 관찰 시 전후방(ventral-dorsal)으로 기도의 두께가 가장 좁은 위치에서 전후방 기도벽(wall)을 최단거리로 연결하는 직선에 의하여 형성된 기도 내부의 최소 단면적 영역을 section of minimum area (SMA)로 정 의하였다 (Fig 2). Airway length (AWL)는 자연두부 자세로 촬영된 측모두부계측방사선 사진 상에서 구 개평면 높이에서 비인두강의 전후방 폭경의 중점으 로부터 상부 식도괄약근 평면(진성수직선에 직각으 로 upper esophageal sphincter 상부를 지나는 평면, UESP) 높이의 하인두 전후방 두께의 중점까지의 길이로 정의하여 계측하였다 (Fig 1). 3D 모델에서 SMA 부위의 폭, 두께 그리고 단면적을 계측하였으 며, 공기가 유입되는 외비공의 입구를 inlet 그리고
Fig 1. Construction of 3D upper airway. A, Segmentation of the air region. The black color in the dotted box shows the nasal cavity; B, 3D surface model. 3D surface model of the upper airway constructed from the segmented images using Bionix body builder software. Smoothing was performed two times with the built-in options of Laplacian and boundary-edge smoothing algorithms for the most optimal model; C, AWL (airway length) measurements were done on the lateral cephalogram. Palatal plane (PP), tip of the uvular (TU), tip of the epiglottis (TE), upper esophageal sphincter (UES), upper esophageal sphincter plane (UESP); D, 3D model generation. The inside of the 3D surface model was meshed into the tetrahedron element; E, the inlet (nostril) and outlet (on the UESP) regions were assigned respectively.
공기가 나가는 하인두 하단의 출구를 outlet으로 구 분하여 (Fig 1) inlet 및 outlet에서의 단면적을 계측 하였다 (Table 2).
유체해석 및 결과분석
Fluent (Version 6.3, Fluent Inc., Ann Arbor, MI, USA) 프로그램과 64 bit Linux-based Workstation (Intel Xeon 2.26 G Quad-Core Dual-Processor, 24 GB memory)을 이용하여 비공 당 170, 200, 230 ml/sec의 흡기 유량에 대하여 유체해석을 수행하였다. 복잡 한 형상을 가지는 상기도를 지나는 유체의 난류영 향을 고려하기 위하여 Standard k-ε 난류모델을 이 용하여 해석을 수행하였다. 전산유체해석 결과를 바탕으로 상기도 유속(flow velocity)의 변화, 음압 (negative pressure)의 분포를 해석하고 압력강하 (pressure drop) 값을 구하였다. 상기도 형태는 AWL, SMA의 형태와 단면적 그리고 inlet, outlet의 단면적 비율로 비교하였다.
연구성적
해석 모델 A, B, C의 상기도 형태 비교
각 모델은 각기 다른 형태적 특징을 보였다 (Fig 2). A모델의 SMA는 좌우로 길죽한 타원형이며, B 모델에서는 단면적이 좌우로 직사각형이었다. C모 델은 전후방 폭경이 좁고 측방으로 길이가 길며 전 방부위가 오목한 강낭콩 형태였다. SMA의 단면적 은 A모델이 가장 작아(34.9 mm2) 모델 B나 C의 약 41%에 불과하였고, SMA 부위의 두께도 모델 A에 서 2.97 mm로 가장 작았다.
Inlet의 단면적은 외비공 입구의 좌, 우 면적을 합 한 값이며 모델 C에서 172.3 mm2로 모델 A의 경우 보다 약 2배 가량 넓었다. Outlet의 단면적은 모델 B 가 372.7 mm2로 가장 컸으며 모델 C보다 1.87배 컸 다 (Figs 2 and 3, Table 2).
AWL는 모델 A에서 113 mm로 가장 길었으며, 모 델 B와 C는 각각 93, 100 mm였다 (Figs 2 and 4, Table 2).
Fig 2. Morphological characteristics of upper airway models for 3 subjects. Section of minimum area (SMA) is in- dicated by the dotted line in the right side of the model. A, Model A; B, model B; C, model C. The shapes of the SMA were compared by a 5 mm unit mesh diagram. The left (L), right (R), ventral (V), dorsal (D), inferior and superi- or views were compared. SMA, The area of the section of minimum area; SMA-W, the lateral width of the SMA;
SMA-T, the anterior-posterior thickness of the SMA; In-A, the cross-sectional area of left and right nostrils; Out-A, the area of hypopharynx in the model.
모델 A, B, C의 유속과 음압 분포
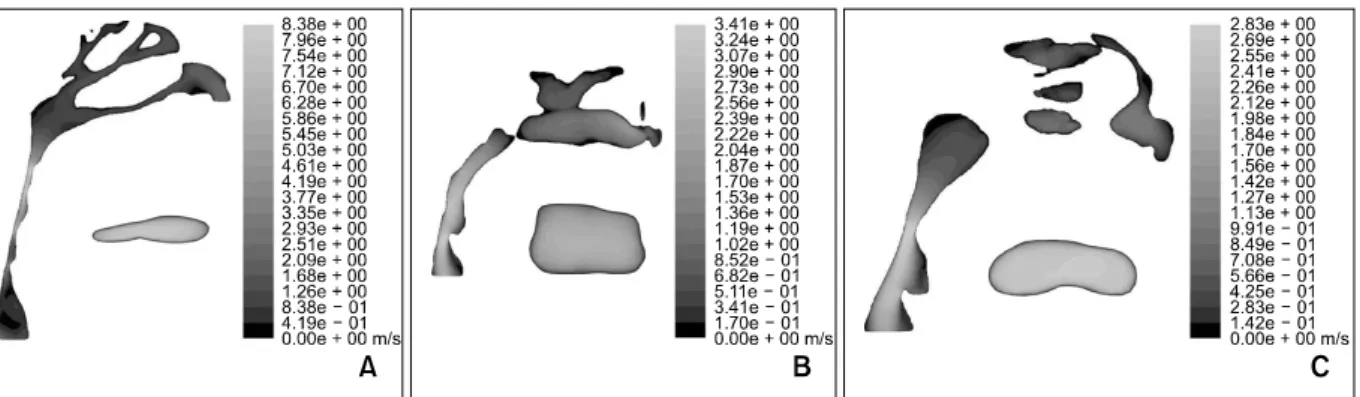
200 ml/s 유량으로 흡기 시 SMA 부위에서 최대 유속은 모델 A의 경우 7.96 m/s, 모델 C의 경우 2.83 m/s로 나타났다. 모델 B의 경우 구개인두와 구인두 부위보다 기도 단면이 가장 좁은 후두덮개의 tip 부 위에서 최고 유속(3.41 m/s)이 발생하였으나, SMA 부 위의 유속도 2.90 m/s로 다른 부위에 비하여 매우 빠른 편이었다 (Fig 5).
SMA 부위에서의 음압의 분포는 모델 A, B, C에 서 각각 −60.8 Pa, −8.97 Pa, −6.81 Pa로서, 모델
A에서 음압이 가장 크게 나타났다. A와 C 모델에서 는 SMA 부위에서 최대 음압이 관찰되었으나, 모델 B에서는 후두덮개 tip 직하방에서 최대음압(−11.5 Pa)이 발생하였다 (Fig 6).
170과 230 ml/s 유량에서의 유속과 유압의 분포 는 200 ml/s 경우와 매우 유사하였고, 유량이 증가 함에 따라 유속과 음압의 절대 값도 증가하였다(경 향이 유사하여 그림은 생략함).
Fig 3. Comparison of the area measurements of upper airway models. In-A, Cross-sectional area of the left and right nostrils; SMA-A, the area of the section of minimum area; Out-A, the area of hypopharynx in the model.
Fig 4. Comparison of the linear measurements of up- per airway models. SMA-W, The lateral width of the SMA (section of minimum area); SMA-T, the ante- rior-posterior thickness of the SMA; AWL, the length of upper airway.
Fig 5. Comparison of the changes of the airflow velocity at the flow rate of 200 ml/s. A, Maximum velocity was ob- served at the SMA (section of minimum area) region. More airjet regions were observed; B, maximum velocity was observed near the tip of the epiglottis, but the maximum velocity magnitude was lower than those in model A; C, maximum airflow velocity was observed at the narrowest portions at the SMA.
Fig 6. Axes and negative pressure patterns of model A, B, and C at the flow rate of 200 ml/s. A, Negative pressure increases at the collapsed regions. The maximum negative pressure occurs at the narrowest region below the SMA (section of minimum area) region; B, the maximum negative pressure occurs at the epiglottis region; C, the maximum negative pressure were observed at the SMA which is narrowest region and the epiglottis tip region.
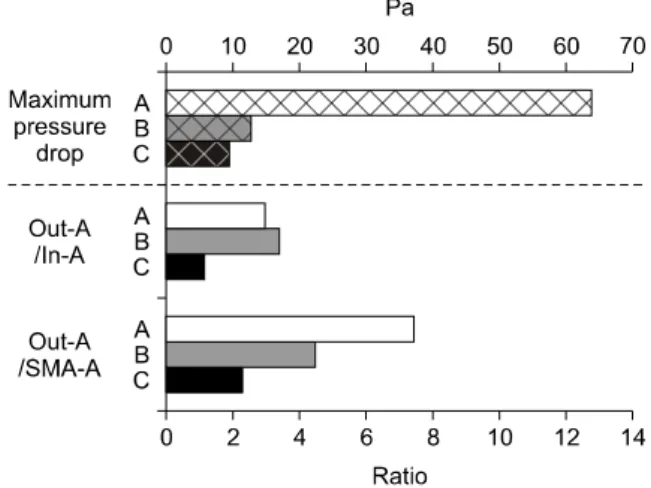
Fig 7. Comparison of the cross sectional area ratio and pressure drop of upper airway models. SMA-A, The area of the section of minimum area; In-A, the cross-sectional area of left and right nostrils; Out-A, the area of hypopharynx in the model.
Fig 8. Changes of the maximum pressure drop by the air flow rate. In all models, maximum pressure drop (differences between the highest pressure in the inlet region and the lowest pressure in the section of mini- mum area region) increased as the air flow rate in- creased, and the largest pressure drop occurred in model A.
압력강하와 상기도 형태적 특징 비교
압력강하(pressure drop)는 모델 A에서 가장 컸으 며(63.83 Pa), 모델 B와 C에 비하여 약 6배 가량 크 게 나타났고, 상기도의 형태적 특징 중에서 outlet의 단면적과 SMA의 단면적의 비율(Out-A/SMA-A)이 이와 같은 차이를 가장 유사하게 반영하였다 (Fig 7). 또한 모델 A는 상기도 길이가 가장 길면서 압력 강하도 가장 큰 특징이 있었다 (Fig 3). 각 모델에서 흡기유량이 170, 200, 230 ml/s로 증가될 때 압력강 하도 거의 비례적으로 증가하였으며, 세 가지 유량 에 대하여 모델 B와 C에 비하여 모델 A의 압력강 하가 급격하게 증가하였다 (Fig 8).
고찰
사람의 인두는 발성을 위한 진화의 과정으로 인 하여 개나 침팬지와는 다르게 후두개-구개수 폐쇄 (epiglottic-soft palate lock-up)가 소실되고, 후두(la- rynx)의 하강(유아에서 성인으로 성장함에 따라 caudal 방향으로 후두가 더 이동되며 인두부가 더 길어짐)이 일어나며, 흡입된 공기가 더 긴 기도로 이동하기 때문에, 매우 폐쇄성이 높은 구조로 생각 되고 있다.15 반대로 중추신경계로부터의 반사반응 은 인두 내의 인두 확장근의 활성도를 증가시켜서 인두의 확장성(patency)을 유지할 수 있게 한다.9 상 기도의 폐쇄에 대한 병인론은 다양하다. Schwab7은
선천적 혹은 후천적 상기도의 구조적 이상 (abnormalities), 즉 좁거나 폐쇄되기 쉬운 기도와 같 은 해부학적 이상이 원인이라고 주장한 반면, Strohl8은 근활성(muscle tone)의 감소나 감소된 EMG 활성도가 무호흡을 유발하며, 기도의 폐쇄는 수면 시에만 나타나므로 수면 중 인두 확장근의 근활성 의 감소가 OSA의 원인이라고 하였고, Fogel 등9과 O'Cornnor 등16은 선천적 혹은 후천적인 상기도의 구조적 이상과 수면 중 상기도 근육의 활성도 감소 가 조합되어 상기도의 폐쇄가 일어나는 것이라고 하였다. 대부분의 OSA 환자(56 - 75%)에서 기도 폐 쇄는 구인두(oropharyngeal) 부위에서 시작되며 25 - 44%에서 혀의 기저부까지 폐쇄가 일어난다.17 하인 두 부위까지 폐쇄가 일어나는 경우는 0 - 33%이고, 소수의 환자에서는 하인두(hypopharynx)에서 처음 폐쇄가 시작되는 것으로 알려져 있다. 호기 초기에 는 관내 압력이 양압이므로 기도가 확장되는데, OSA에서 더 많은 확장이 일어나며, 이는 정상적인 기도에 비해 OSA 환자의 기도가 압력에 의해 확장 되기가 더 쉽다는 것을 보여준다. 호기 말기에는 양 압이 감소하면서 기도가 좁아지는데, 정상인이나 OSA 환자 모두 이 시기에 기도가 가장 좁아지며, OSA 환자의 경우 더 많이 좁아지게 된다. 따라서 상기도의 폐쇄는 호기(expiration) 말기 또는 흡기 (inspiration) 초기에 일어나게 된다.18
OSA 환자들은 정상인에 비해 상기도의 특정 부
위가 좁은 것으로 알려져 있으며, 좁은 관으로 정상 인의 1회 호흡량(tidal volume)에 해당하는 공기를 흡입해야 하므로, 폐쇄가 주로 일어나는 좁은 부위 의 흡기유속은 더욱 빨라지게 된다.19 Bernoulli의 정 리에 의하면 관 내에서의 압력은 기류의 속도에 의 해 결정되므로, 유속이 빠를수록 기도 내 좁은 부위 의 압력은 더 떨어지고, 폐쇄성이 강한 기도부는 음 압에 의하여 더 좁아지는 악순환이 일어나고 결국 기도가 폐쇄되는 것으로 생각되며,9 이번 연구 결과 도 SMA 부위의 단면적이 가장 작은 모델 A에서 유 속이 가장 빨랐으며, 다른 모델에 비하여 7 - 9배 큰 최대 음압이 발생하였다 (Fig 3). Jeong 등20은 상기 도가 SMA 부위에서 급격하게 좁아지면서 pharyng- eal jet이 발생되며, 인두 벽에 높은 shear stress를 발 생시킨다고 하였고, pharyngeal jet에 의한 shear force 는 SMA가 있는 구개인두에서 높고 인두의 후방벽 을 따라서 내려가면서도 높게 나타나는데 phar- yngeal jet이 후방벽을 따라서 아래로 떨어지면서 높 은 속도(higher velocity gradient)를 보이기 때문이라 고 하였다. 본 연구에서는 200 ml 유량에서 A, C 모 델의 경우 SMA 부위에서 최대 음압이 발생하였다.
모델 B의 경우는 다른 모델들과 다르게 단면적이 가장 좁아지는 부위가 분명하지 않고, 상기도 관의 형태가 비교적 비슷한 단면적을 유지하고 있어서, 유체의 흐름에 pharyngeal jet 효과가 적게 나타났지 만, 후두개 tip 부위에서 단면적이 다시 감소하고 유 속이 빨라지며 최대 음압이 분포하였다 (Fig 6). 모 델 B는 비슷한 기류 특성 값을 보이는 모델 C에 비 하여 SMA 부위의 유속이나 음압이 약간 큰 것으로 나타났는데 (Figs 5 and 6), 이는 inlet에 대한 흡기유 량 조건이 동일한 반면, inlet 면적의 크기가 모델 C 의 63.6%에 불과하여 흡기유속의 증가 효과가 모델 B의 해석 결과에 영향을 미친 것으로 판단된다.
외비공 입구 내부의 nasal valve는 비강에서 가장 좁고(편측 55 - 100 mm2), 500 ml/sec 이상의 흡기 유량 하에서 폐쇄되기 쉬운 flow-limiting structure로 서 작용하는 것으로 알려져 있지만,21 본 연구에서 는 해석모델의 inlet의 단면적을 해석 결과와 관련 된 형태조건의 한 요인으로 관찰하였다. 하지만 해 석상 airflow 조건 입력관련 경계조건을 통일하기 위하여, inlet을 Bionix 모델링 시 axial 방향에 직각 으로 단순화시켰으므로, 해석 모델만을 기준으로 산출한 inlet의 단면적은 실제 면적과 차이가 있을 수 있다.
Pae 등22은 측모두부계측방사선사진 연구에서 인
두의 길이가 긴 경우가 그렇지 않은 경우보다 OSA 의 중요한 유발인자가 될 수 있음을 보고하였고, Malhotra 등23은 남성과 여성의 상기도를 비교한 연 구에서 깨어있을 때 상기도가 생리적으로 성별에 따른 차이를 보이지는 않으며 인두 확장근의 activa- tion, responsibility 등은 차이가 없으나, 남성이 여성 보다 인두부 기도 길이가 더 길고 연구개 부위가 더 넓으며 pharyngeal volume이 더 크다고 하였다. 즉 남성의 상기도가 여성에 비해 길이가 길고 협착되 기가 더 쉬워서 남성에서 OSA 환자가 더 많이 발생 한다고 보고하였고, 이번 연구에서도 여성 모델 B (65세 여자)는 남성 모델 A, C에 비하여 AWL가 짧 았으며, 모델 A (19세 남자)는 모델 C (62세 남자)에 비하여 AWL가 13 mm 더 길어 상기도 길이 증가에 따른 OSA의 악화 요인이 있을 수 있음을 추측할 수 있었다. 또한 Polo 등24은 좁은 구개인두(velopha- rynx)와 넓은 하인두(hypopharynx)가 동반되면, 흡기 시 가해지는 흡입력에 대하여 좁은 구개인두가 더 직접적으로 노출되므로, 기도 폐쇄가 더 잘 일어난 다고 하였고, 이번 연구에서 모델 A는 Out-A/SMA- A가 세 모델 중에서 7.45로 가장 높았고, 이러한 형 태적 특성 또한 기도폐쇄 가능성을 더 악화시킬 수 있을 것으로 판단된다 (Fig 7).
이번 연구에서 측정한 압력강하(pressure drop)량 은 상기도 CFD 모델에서 inlet 부위의 최고 압력과 SMA 부위의 최저 압력의 차이로서, 압력강하량은 공기와 기도벽 사이의 마찰에 의한 기류의 운동에 너지 소실(dissipated kinetic energy of airflow)과 유동 내부에 발생되는 전단력(shearing forces)과 상관관계 가 있고 또한, 기류의 유동이 층류(laminar)인지 난 류(turbulent)인지 또는 도관의 형태(직경, 만곡 정도, 길이) 등에도 영향을 받는 것으로 알려져 있다.25 Weinhold와 Mlynski26는 인간의 한 쪽 비강에 200 ml/sec의 유량으로 전산유체해석을 통하여, 10 Pa의 압력강하가 있음을 보고하였고, Stapleton 등12은 mouth- throat 모델에 대한 실험연구와 해석연구를 통하여 471.7 ml/sec의 난류 조건에서 각각 25.2 Pa, 22.3 Pa의 압력강하가 발생함을 보고하였다. 또한 Olson 등25은 400 ml/sec의 유량에서 구강부터 기관 지까지 약 30 Pa의 압력강하가 발생하며 이러한 압 력강하에는 상기도의 형태적 특성의 영향이 크다고 하였다. 이번 연구에서 모델 A의 최대 압력강하는 63.83 Pa로 모델 B, C에 비하여 큰 경향을 보였으며, 다른 모델과 비교 시 inlet의 단면적 크기 순과는 반 대이고, Out-A/SMA-A의 크기 순에는 일치하는 경
향을 보였다 (Figs 3, 4 and 7).
호흡 시 intra-alveolar pressure는 대기압(760 mm Hg 또는 101300 Pa)에 비하여 1 mm Hg 가량 낮으 므로27 133 Pa의 압력강하가 발생되는 것으로 추정 할 수 있으며, 대기압의 절대치에 비하여 0.13%에 해당하는 작은 압력차이로 호흡이 이루어짐을 알 수 있다. 본 연구에서 해석된 상기도 내의 압력강하 량은, OSA로 인하여 SMA가 점점 좁아지며 최종적 으로 폐쇄되기까지, 본 연구의 해석치보다도 현격 히 증가하며 기도폐쇄에 큰 영향을 줄 수 있을 것이 다.
즉 압력강하는 호흡 시에 발생되는 일종의 기도 저항이며, 기도의 형태적 특성에 기인할 수 있는 모 든 요소를 종합적으로 반영하는 지표로 이용할 수 있으므로, OSA 환자에서 복잡한 병태생리 기전을 설명하는 데 유용할 것으로 기대된다.
170, 200, 230 ml/s로 유량을 달리하여 유체역학 분석을 시행한 결과 유량이 증가할수록 압력강하도 커졌다 (Fig 8). 단면적이 좁은 부위를 공기가 더 빠 르게 지나갈 경우 압력강하가 그만큼 많이 일어나 므로 이 때 관이 폐쇄될 가능성도 더 커진다고 볼 수 있다. 그러나 Jeong 등20의 연구에 의하면 흡기 유량 증가 시 비강 부위 압력강하는 무시할 만한 수 준의 작은 변화만 있었다. 즉, 흡기 유량의 증가는 인두 부위에서 기도 폐쇄를 가져오는 주요 인자 중 의 하나라고 볼 수 있으며, SMA의 단면적이 가장 적고, 기도의 길이가 긴 모델 A에서 가장 압력강하 가 크게 나타났고, 유량 증가에 따른 압력강하의 폭 도 다른 모델에 비해 더 컸다.
이번 연구는 호기 말기에 CT 촬영을 하여 이를 바탕으로 CFD model을 제작하고 상기도 벽은 pas- sive하고 rigid한 것으로 가정하고 유체 분석을 시행 하였다. 실제 상기도 단면은 호기와 흡기의 호흡 주 기에 따라 동적인 형태 변화를 보이지만, 이번 연구 에서는 이런 동적인 변화는 반영되지 못하였다.
또한 모델 A의 경우 재구성된 시상면에서 FH 평 면이 axial scan 방향과 평행하지 않아, inlet과 outlet 의 단면적 값이 실제보다 약간 증가되었을 수 있다.
특정 치료 전후 상기도 형태 변화 중 inlet과 oulet의 단면적을 기도폐쇄의 기여 요인으로서 관찰하고자 할 경우, 재현성 높은 골 구조물을 이용한 상기도 모델의 3차원 계측을 위한 좌표축 설정에 대한 기 준도 필요할 것으로 보인다.28
Surface 모델 제작을 위한 전단계로 air 영역을 자 동선택(segmentation)할 경우 다음과 같은 사항을 고
려할 필요가 있다. DICOM 화일에 포함된 4096 단 계의 CT number를 window와 level을 조절하여 모니 터 상에서 관찰하는 것과 CT number의 절대값을 이 용한 masking 과정은 독립적이며, Bionix 상에서 적 절한 surface 모델을 얻기 위해서는, air가 존재하는 영역을 내부까지 완전히 균일하게 masking 되도록 threshold level을 충분히 넓게 지정해줄 필요가 있 다. 단 이 과정에서 적어도 다른 인체 조직부위가 미세하게나마 masking 영역에 포함되지는 않는 조 건을 적용하는 것이 바람직할 것이다.
한편 최근 CBCT (conebeam CT)가 치과 임상에서 널리 활용되고 있으므로, OSA 환자를 앙와위로 촬 영할 수 있는 기종을 사용한다면 적은 방사선 피폭 량으로29 진단에 도움을 줄 것으로 생각한다. 향후 각 개인의 상기도 형상을 그대로 재현하고, 주위 연 조직과 근육들에 관한 모델링과 이들에 대한 기계 적 물성치가 추가된 상기도 전산유체해석을 통하여 OSA 환자의 기도의 형태에 따른 폐쇄경향을 비침 습적으로 진단하거나, 외과적 airway augmentation을 필요로 하는 경우, 치료 효과 여부에 대한 평가 및 사전 simulation 기법으로도 활용될 수 있을 것으로 생각한다.
결론
OSA 환자 3인의 CT data를 활용하여 개인별 상 기도 3-D 유한요소모형을 제작하여 그 형태적 특성 과 전산유체해석을 통하여 유속과 음압, 압력강하 의 특성을 분석한 결과 다음과 같은 결론을 얻었다.
1. 관찰된 3개의 모델에서 모두 단면적이 가장 작은 부위에서 유속이 증가하고, 음압이 크게 나타났 다.
2. 기도의 형태는 구개인두와 구인두 부위에서 좁아 지는 형태를 가지며, 일반적으로 구개수와 설근 부위가 겹쳐지는 곳에서 단면적이 가장 작게 나 타났다. 특히, Out-A/SMA-A가 크면 클수록 유속 과 음압의 변화가 크게 나타났다.
3. 압력강하는 상기도 저항을 종합적으로 판단할 수 있는 유용한 지표이며, 유량에 따라 증가하였다.
참고문헌
1. Wynne JW, Block AJ, Hemenway J, Hunt LA, Flick MR.
Disodered breathing and oxygen desaturation during sleep in
patients with chronic obstructive lung disease (COLD). Am J Med 1979;66:573-9.
2. Young T, Palta M, Dempsey J, Skatrud J, Weber S, Badr S.
The occurrence of sleep-disordered breathing among middle- aged adults. N Engl J Med 1993;328:1230-5.
3. Remmers JE, deGroot WJ, Sauerland EK, Anch AM. Patho- genesis of upper airway occlusion during sleep. J Appl Phsiol 1978;44:931-8.
4. Sung SJ. Oral appliances. J Clin Otolaryngol 2008;19:160-7.
5. Hwang SH, Park IS, Nam KY, Kim JB, Cho YW, Suh YS, et al. Cephalometric differences in obstructive sleep apnea be- tween obese and non-obese Korean male patients. Korean J Orthod 2008;38:202-13.
6. Shepard JW Jr, Thawley SE. Evaluation of the upper airway by computerized tomography in patients undergoing uvulopala- topharyngoplasty for obstructive sleep apnea. Am Rev Respir Dis 1989;140:711-6.
7. Schwab RJ. Pro: sleep apnea is an anatomic disorder. Am J Respir Crit Care Med 2003;168:270-1.
8. Strohl KP. Con: sleep apnea is an anatomic disorder. Am J Respir Crit Care Med 2003;168:271-2.
9. Fogel RB, Malhotra A, White DP. Sleep 2: pathophysiology of obstructive sleep apnea/hypopnea syndrome. Thorax 2004;59:
159-63.
10. Hahn I, Scherer PW, Mozell MM. Velocity profiles measured for airflow through a large-scale model of human nasal cavity.
J Appl Phsiol 1993;75:2273-87.
11. Schreck S, Sullivan KJ, Ho CM, Chang HK. Correlations be- tween flow resistance and geometry in a model of the human nose. J Appl Phsiol 1993;75:1767-75.
12. Stapleton KW, Guentsch E, Hoskinson MK, Finlay WH. On the suitability of k-εturbulence modeling for aerosol deposi- tion in the mouth and throat: a comparison with experiment.
J Aerosol Sci 2000;31:739-49.
13. Sung SJ, Jeong SJ, Yu YS, Hwang CJ, Pae EK. Customized three-dimensional computational fluid dynamics simulation of the upper airway of obstructive sleep apnea. Angle Orthod 2006;76:791-9.
14. Tso HH, Lee JS, Huang JC, Maki K, Hatcher D, Miller AJ.
Evaluation of the human airway using cone-beam compu- terized tomography. Oral Surg Oral Med Oral Pathol Oral Radiol Endod 2009;108:768-76.
15. Davidson TM. The Great Leap Forward: the anatomic basis for the acquisition of speech and obstructive sleep apnea. Sleep
Med 2003;4:185-94.
16. O'Cornnor C, Thornley KS, Hanly PJ. Gender differences in the polysomnographic features of obstructive sleep apnea. Am J Respir Crit Care Med 2000;161:1465-72.
17. Katsantonis GP, Moss K, Miyazaki S, Walsh J. Determining the site of airway collapse in obstructive sleep apnea with air- way pressure monitoring. Laryngoscope 1993;103:1126-31.
18. Schwab RJ, Gefter WB, Hoffman EA, Gupta KB, Pack AI.
Dynamic upper airway imaging during awake respiration in normal subjects and patients with sleep disordered breathing.
Am Rev Respir Dis 1993;148:1385-400.
19. Gleeson K, Zwillich CW, White DP. The influence of increas- ing ventilatory effort on arousal from sleep. Am Rev Respir Dis 1990;142:295-300.
20. Jeong SJ, Kim WS, Sung SJ. Numerical investigation on the flow characteristics and aerodynamic force of the upper air- way of patient with obstructive sleep apnea using computa- tional fluid dynamics. Med Eng Phys 2007;29:637-51.
21. Schlosser RJ, Park SS. Functional nasal surgery. Otolaryngol Clin North Am 1999;32:37-51.
22. Pae EK, Lowe AA, Fleetham JA. A role of pharyngeal length in obstructive sleep apnea patients. Am J Ortho Dentofacial Orthop 1997;111:12-7.
23. Malhotra A, Huang Y, Fogel RB, Pillar G, Edwards JK, Kikinis R, et al. The male predisposition to pharyngeal col- lapse: importance of airway length. Am J Respir Crit Care Med 2002;166:1388-95.
24. Polo OJ, Tafti M, Fraga J, Porkka KV, Déjean Y, Billiard M.
Why don't all heavy snorers have obstructive sleep apnea? Am Rev Respir Dis 1991;143:1288-93.
25. Olson DE, Dart GA, Filley GF. Pressure drop and fluid flow regime of air inspired into the human lung. J Appl Physiol 1970;28:482-94.
26. Weinhold I, Mlynski G. Numerical simulation of airflow in the human nose. Eur Arch Otorhinolaryngol 2004;261:452-5.
27. Lauralee S. Fundamentals of physiology: a human perspective.
London: Thomson Brooks/Col; 2005. p. 372.
28. Park JW, Kim NK, Chang YI. Formulation of a reference co- ordinate system of three dimensional head and neck images:
Part II. Reproducibitity of the horizontal reference plane and midsagittal plane. Korean J Orthod 2005;35:475-84.
29. Kim YI, Kim SS, Son WS, Park SB. Pharyngeal airway analy- sis of different craniofacial morphology using cone-beam com- puted tomography (CBCT). Korean J Orthod 2009;39:136-45.
Morphological characteristics of the upper airway and pressure drop analysis using 3D CFD in OSA patients
Sung-Seo Mo, DDS, MSD, PhD,
aHyung Taek Ahn, PhD,
bJeong-Seon Lee, DDS, MSD,
cYoo-Sam Chung, MD, PhD,
dYoon-Shik Moon, DDS, MSD, PhD,
eEung-Kwon Pae, DDS, MSc, PhD,
fSang-Jin Sung, DDS, MSD, PhD
gObjective: Obstructive sleep apnea (OSA) is a common disorder which is characterized by a recurrence of entire
or partial collapse of the pharyngeal airway during sleep. A given tidal volume must traverse the soft tissue tube structure of the upper airway, so the tendency for airway obstruction is influenced by the geometries of the duct and characteristics of the airflow in respect to fluid dynamics. Methods: Individualized 3D FEA models were re- constructed from pretreatment computerized tomogram images of three patients with obstructive sleep apnea. 3D computational fluid dynamics analysis was used to observe the effect of airway geometry on the flow velocity, negative pressure and pressure drop in the upper airway at an inspiration flow rate of 170, 200, and 230 ml/s per nostril. Results: In all 3 models, large airflow velocity and negative pressure were observed around the sec- tion of minimum area (SMA), the region which narrows around the velopharynx and oropharynx. The bigger the Out-A (outlet area)/ SMA-A (SMA area) ratio, the greater was the change in airflow velocity and negative pressure. Conclusions: Pressure drop meaning the difference between highest pressure at nostril and lowest pressure at SMA, is a good indicator for upper airway resistance which increased more as the airflow volume was increased. (Korean J Orthod 2010;40(2):66-76)
Key words: OSA, Upper airway, Computational fluid dynamics, Pressure drop
aAssociate Professor, Division of Orthodontics, Department of Dentistry, College of Medicine, The Catholic University of Korea, St. Mary’s Hospital.
bAssistant Professor, School of Naval Architecture & Ocean Engineering, University of Ulsan.
cGraduate Student, Department of Medicine Orthodontics, The Graduate School of the University of Ulsan.
dAssociate Professor, Department of Otolaryngology, University of Ulsan College of Medicine, Asan Medical Center.
eProfessor, gAssociate Professor, Department of Orthodontics, University of Ulsan College of Medicine, Asan Medical Center.
fAssociate Professor, Section of Orthodontics in the Division of Associated Clinical Specialties at the UCLA School of Dentistry.
Corresponding author: Sang-Jin Sung.
Division of Orthodontics, Department of Dentistry, Asan Medical Center, 388-1, Pungnap-2 dong, Songpa-gu, Seoul 138-736, Korea
+82 2 3010 3845; e-mail, [email protected].
Received October 7, 2009; Last Revision February 28, 2010; Accepted March 3, 2010.