• 검색 결과가 없습니다.

Application of imputation methods with adjusting multi-center effect on Crohns disease data in Korea<sup>†</sup>

N/A
N/A
Protected

Academic year: 2021

Share "Application of imputation methods with adjusting multi-center effect on Crohns disease data in Korea<sup>†</sup>"

Copied!
9
0
0

로드 중.... (전체 텍스트 보기)

전체 글

(1)

Application of imputation methods with adjusting multi-center effect on Crohns disease data in Korea

Hanna Yoo 1

1 Department of Computer Software, Busan University of Foreign Studies

Received 15 January 2018, revised 8 March 2018, accepted 19 March 2018

Abstract

The purpose of this study is to assess the risk factors for recurrence time after the first abdominal surgery in Korean patients with Crohns disease (CD). CD patients who underwent abdominal surgery from January 2000 to December 2009 were collected from seventeen university hospitals (Lee et al. 2012). We assessed the risk factors for recurrence time after the first abdominal surgery CD using Cox regression analysis with imputing the missing covariates using single and multiple imputation methods and also adjusting for the multi-center effect. We compared our results with the complete case analysis. Using imputation methods with considering the multi-center effect, model performance was improved. Comparing between the imputation methods, multiple im- putation method showed better performance than single imputation method.

Keywords: Crohns disease, imputation methods, missing covariates, multi-center effect.

1. Introduction

In many epidemiological studies, missing data is a common problem. For survival data which deals with time to a certain event, censoring occurs due to many reasons (loss to follow up, drop out etc.) and this censoring is what makes survival analysis special and differentiated from other analytical methods. There are many statistical methods considering censoring at the time to event. However few studies have been dealt with missing covariates. Furthermore, when the data is clustered (eg. multi-center data), studies dealing with missing covariates are rare. Burton and Altman (2004) reviewed 100 articles of cancer prognostic studies with missing covariates assessing potential prognostic factors using multivariate survival analysis.

In the review, 81 articles had missing covariates, 15 articles reported complete data and the remaining 4 articles were unknown of the presence of missing covariates. Of the 81 articles that reported missing covariates only 38% mentioned for handling missing covariates.

Complete and available case analysis was the most commonly used methods and three articles used single imputation and multiple imputations were used in only one article. Disregarding

† This work was supported by the research grant of the Busan University of Foreign Studies in 2018.

1
Assistant professor, Department of Computer Software, Busan University of Foreign Studies, 65

Geumsaem-ro 485 beon-gil, Geumjeong-gu, Busan, Korea. Email: [email protected]

(2)

the missing covariates and deleting the missing cases will lead to biased estimates with low power and thus proper imputation methods should be applied.

Addition to adjusting for missing data, in a multi-center study where patients are recruited from different hospitals and this multi-center effect should be incorporated in the analysis.

Glidden and Vittinghoff (2004) proposed a clustered survival model using gamma frailty for multi-center data and showed if center effects are powerful, ignoring the nature of clustering will seriously mislead the results. Therefore the purpose of our paper is to impute the missing covariates in clustered survival data using single and multiple imputation methods and adjust the multi-center effect in assessing the risk factors for the recurrence time for the Crohns disease.

2. Statistical model

2.1. Methods for handling missing data

The simplest way to handle missing values in the data is the complete case (CC) analysis.

This method deletes the missing values and uses only the complete case. This approach is used widely in most analytical procedures however, it is appropriate only when the missing mechanism is missing compete at random (MCAR), that is missing values occur indepen- dently with the explanatory variables and/or the outcome. Although it can yield unbiased results under MCAR, MCAR is rather a strong assumption and is usually not satisfied in real datasets and also using only the observed cases will lose statistical power (Carpenter et al. 2006). Therefore, proper imputation methods should be applied to missing data.

Single imputation is a simple method for handling missing data. It replaces each missing value that matches well with other variables (hot-deck imputation) or imputes with the predicted value using regression analysis (Little and Rubin, 2002). There are many methods in single imputation. Kang (2004) compared 5 different single imputation methods in general missing pattern. In this paper predictive mean matching methods is used. This method is used to impute a value randomly from a set of observed values whose predicted values are closest to the predicted value from a specified regression model (Heitjan and Little 1991;

Schenker and Jeremy, 1996).

Let Y = (Y 1 , ..., Y n ) 0 be a matrix composed of n subject with p variables. Let Y i = (Y i1 , · · · , Y ip ) 0 be one of the incomplete variables and denote Y obs = (Y 1 obs , · · · , Y r obs ) 0 , Y mis = (Y 1 mis , · · · , Y s mis ) 0 as the observed and missing data in Y respectively. For each incomplete subject, the conditional expected value ˆ µ = E(Y mis |Y obs ) is estimated and the missing value is imputed through the nearest neighborhood subject. When a continuous random variable is imputed, this method is straightforward, but it may be more complicated for a categorical variable.

Single imputation is rather easy to implement however a common problem exists. Since it treats the imputed value as it were the true value, it does not consider uncertainty and the variance is usually underestimated. Multiple imputation overcomes this problem by considering the within-imputation uncertainty and the between-imputation uncertainty.

Multiple imputation is a three-step approach in estimating incomplete data (Rubin, 1987).

The first step is to create plausible values for missing observations from a specifically modeled

distribution that can reflect uncertainty about the nonresponse model. Usually five to ten

imputed datasets are created and denote the imputed dataset as where is the number of

(3)

imputations. The next step is to analyze the imputed data using typical methods we would have used for the complete data. The last step is to combine the results for each imputed datasets and obtain the pooled estimate.

The MI-MICE is a imputation method using the multivariate imputation by chained equations (MICE). MICE is a software for imputing incomplete multivariate data by fully conditional specification. It appeared in the R package library in 2001. Fully conditional method specifies the multivariate imputation model on a variable-by-variable basis by a set of conditional densities, one for each incomplete variable (van Buuren, 2007). Under the assumption that a multivariate distribution exists from which these conditional distri- butions can be derived, MICE constructs a Gibbs sampler from the specified conditionals.

This method has been used with different names: regression switching (van Buuren et al., 1999), variable-by-variable imputation (Brand, 1999) and chained equations (van Buuren et al., 2011). We will follow the notations of van Buuren et al. (2011). Let θ θ θ = (θ 1 , · · · , θ p ) denote the vector of p unknown parameters of the multivariate distribution of Y . That is, starting from observed marginal distributions, the i th iteration of chained equations is a Gibbs sampler that successively draws

θ ∗(t) 1 ∼ P (θ 1 |Y 1 obs , Y 2 (t−1) , · · · , Y p (t−1) ), Y 1 ∗(t) ∼ P (Y 1 |Y 1 obs , Y 2 (t−1) , · · · , Y p (t−1) , θ 1 ∗(t) ), .. .

θ p ∗(t) ∼ P (θ p |Y p obs , Y 1 (t) , · · · , Y p−1 (t) ), Y p ∗(t) ∼ P (Y p |Y p obs , Y 1 (t) , · · · , Y p (t) , θ p ∗(t) ), (2.1) where Y i (t) = (Y i (obs) , Y i (t) ) is the imputed variable at iteration t. In our paper we use imputation methods that are built in the MICE software in the R package library. Compared with single imputation, multiple imputation method minimizes standard error and increases efficiency of the estimates although they are more difficult to perform then single imputation methods.

2.2. Clustered failure time data with multi-center effect

Clustered failure time data occur when the study subjects from the same cluster share common characteristics. Clustered failure time data can be found in many studies for exam- ple in a Diabetic Retinopathy study (Diabetic Retinopathy Study Research Group, 1981) which was conducted by the national eye institute to assess the effectiveness of laser pho- tocoagulation in delaying the onset of blindness in patients with diabetic retinopathy. The time to occurrence of visual loss in patients were recorded for the two eyes from the same patient. In this case, one can expect dependency between the recorded times of the same patient. Another example of clustered failure time arise in a multi-center study. In a multi- center clinical trial, patients are recruited from different hospitals and patients from the same center lead to form a cluster. Thus patients from the same hospital tend to have some characteristics common compared to other patients from different hospitals. Recently, Kim et al. (2016) analyzed multi-center survival data using multi-level frailty models.

In clustered failure time data the failure times in the same cluster are correlated and there

is two approaches generally used to account for the correlation. The first approach is the

(4)

random effects model (Heagerty and Zeger, 1996; Liu and Hedeker, 2006) and the second approach is the marginal approach (Wei et al., 1989).

For the clustered failure time, let X ij and C ij denote the failure time and censoring time of the j (= 1, · · · , n i ) t h subject in the i (= 1, · · · , M ) th cluster respectively. Let Z ij (•) be the covariate process associated with the j th subject of the i th cluster. The observed subject takes the form T ij = min(X ij , C ij ) and δ ij = I(X ij ≤ C ij ).

Random effects models (frailty models) explicitly formulate the underlying dependence via a cluster specific variable U U U known as the random effect (frailty) representing the het- erogeneity in each cluster. For the random effect model, The hazard function for subject in cluster is given by

λ(t; U, Z U, Z U, Z ij ij ij ) = U i λ 0 (t)exp(β β β 0 0 0 Z Z Z ij ij ij (t)), j = 1, · · · , n i ; i = 1, · · · , M, (2.2) where U = (U 1 , · · · , U M ) 0 , β β β is the vector of regression coefficients and λ 0 (t) is an arbitrary baseline hazard function.

Marginal models focus on the population average on the margins of the joint distribution of data from one cluster treating the correlation as a nuisance parameter to reduce the de- pendence of marginal models on the specification of unobservable correlation structures of clustered data. Lee, Wei and Amato (1992) estimate the regression parameters in the Cox model by the maximum partial likelihood estimates under an independent working assump- tion and use a robust sandwich covariance matrix estimate to account for the intracluster dependence.

Then the marginal Cox model is given by

λ(t; Z Z Z ij ij ij ) = λ 0 (t)exp(β β β 0 0 0 Z Z Z ij ij ij (t)), j = 1, · · · , n i ; i = 1, · · · , M. (2.3) Lee et al. (1992) estimate β β β by the maximum partial likelihood as below,

P L(β) =

M

Y

i=1 n

i

Y

j=1

( exp(β β β 0 0 0 Z Z Z ij ij ij (t)) P M

l=1

P n

l

k=1 I(t lk ≥ t ik )exp(β β β 0 0 0 Z Z Z ij ij ij (t)) ) δ

ij

. (2.4)

The maximum partial likelihood estimate ˆ β β β is estimated under the independent working assumption and a robust sandwich covariance estimate is used to account for the intracluster dependence.

In our paper we use the marginal model approach to account for the multi-center effect.

We also impute the missing covariates using single and multiple imputation methods and then assess the risk factors that fasten the time to recurrence after the first abdominal surgery using Cox regression analysis. For the multiple imputation the basic scheme of the process is given as follows:

Step1: For each cluster i = 1, · · · , M , fill in the missing values using MI-MICE multiple imputation method and make Q Q Q plausible imputed data sets.

Step2: For Q Q Q imputed data sets, use the marginal Cox model and obtain the maximum par- tial likelihood estimate in each Q Q Q imputed data sets and denote them as ˆ β β β ˆ ˆ (1) (1) (1) , ˆ β β β ˆ ˆ (2) (2) (2) , · · · , ˆ β β β ˆ ˆ (Q) (Q) (Q) .

Step3: Combine the estimates Q Q Q into one estimate ˆ β β β.

(5)

For single imputation, only step 1 is needed.

All statistical analysis was performed using the R program (v.2.15.1, www.r-project.

org).

3. Real example

3.1. Data description

We used the data of Crohn’s Disease patients who underwent abdominal surgery from January 2000 to December 2009 in Korea. Patients were collected from 17 different hospitals.

The risk factors were decided at a meeting held before the collection of the data. A total of 754 patients were initially collected and 47 patients were excluded due to duplication or unmet criteria. Thus 707 patients were used to determine the risk factors for the recurrence time after the first abdominal surgery. The mean follow up period was 72 months and the variables we used were gender, family history, age at diagnosis, tumor location, tumor behavior, type of surgery, indication of surgery, the use of steroid, the use of 5 ASA and the time interval between diagnosis and surgery. In order to investigate the multi-center effect we also consider the hospital identification variable. We compared the results of complete case analysis with using single and multiple imputation methods.

3.2. Results

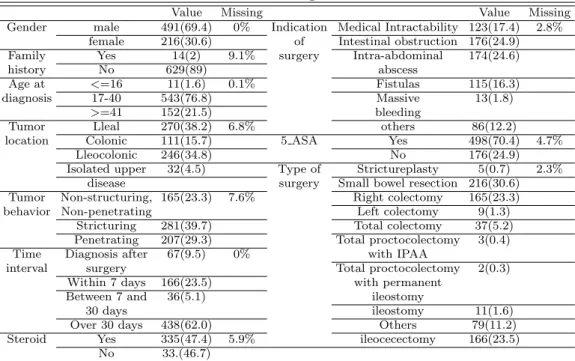
Table 3.1 gives an overview of the percentage of missing covariates and the frequency (%) of each covariates. Family history, Tumor location and Tumor behavior has rather high missing rates (9.1%, 6.8%, 7.6%) than other covariates. There was no missing values in covariates gender and time interval between diagnosis and surgery. Statistical analysis is done with a list-wise deletion method thus due to missing covariates in the data 23.6% cases were deleted and only 76.4% of patients could be included in the analysis for the complete case analysis.

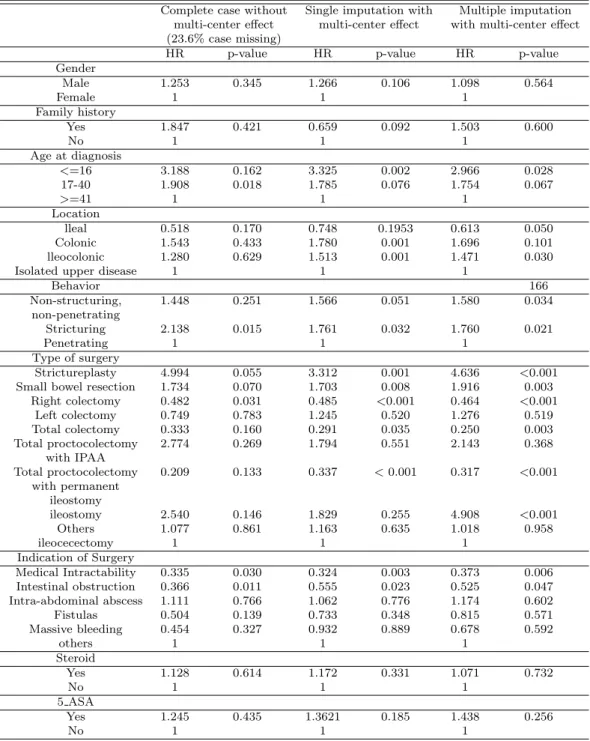
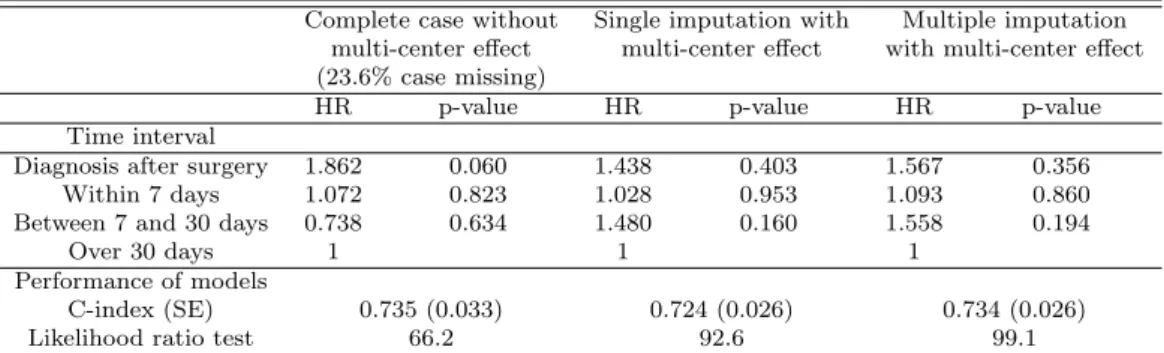
Tables 3.2 ∼ 3.3 shows the results of the complete case analysis ignoring the multi-center effect also with the results using single and multiple imputation methods incorporating the multi-center effect. Under complete case analysis, age at diagnosis, behavior, type and in- dication of surgery showed significance in time to recur after the first abdominal surgery.

Through the use of imputation methods all cases can be included in the survival analysis and

it is shown that the variables that show significance is similar between the single imputation

and multiple imputation methods. For comparing the model performance the C-index and

the likelihood ratio test was held. The C-index which is a scale for measuring the discrimina-

tion for model validation, multiple imputation method had higher value compared to single

imputation (0.734 versus 0.724). Also comparing the likelihood ratio test statistic which

shows the goodness of fit test, multiple imputation showed better performance compared

to single imputation (99.1 versus 92.6). Since multiple imputation method showed better

performance than the single imputation we compared the risk factors that revealed signifi-

cant of multiple imputation with the complete case analysis. Additionally, we investigated

the convergence of the posterior mean through setting different initial values and updated

the model for 10000 iterations and monitored the convergence. The plot is not shown here

but the different streams freely intermingled with each other without showing any definite

trends.

(6)

Table 3.1 Covariates and missing rates for the CD data

Value Missing Value Missing

Gender male 491(69.4) 0% Indication Medical Intractability 123(17.4) 2.8%

female 216(30.6) of Intestinal obstruction 176(24.9)

Family Yes 14(2) 9.1% surgery Intra-abdominal 174(24.6)

history No 629(89) abscess

Age at <=16 11(1.6) 0.1% Fistulas 115(16.3)

diagnosis 17-40 543(76.8) Massive 13(1.8)

>=41 152(21.5) bleeding

Tumor Lleal 270(38.2) 6.8% others 86(12.2)

location Colonic 111(15.7) 5 ASA Yes 498(70.4) 4.7%

Lleocolonic 246(34.8) No 176(24.9)

Isolated upper 32(4.5) Type of Strictureplasty 5(0.7) 2.3%

disease surgery Small bowel resection 216(30.6)

Tumor Non-structuring, 165(23.3) 7.6% Right colectomy 165(23.3)

behavior Non-penetrating Left colectomy 9(1.3)

Stricturing 281(39.7) Total colectomy 37(5.2)

Penetrating 207(29.3) Total proctocolectomy 3(0.4)

Time Diagnosis after 67(9.5) 0% with IPAA

interval surgery Total proctocolectomy 2(0.3)

Within 7 days 166(23.5) with permanent

Between 7 and 36(5.1) ileostomy

30 days ileostomy 11(1.6)

Over 30 days 438(62.0) Others 79(11.2)

Steroid Yes 335(47.4) 5.9% ileocecectomy 166(23.5)

No 33.(46.7)

After imputing missing covariates, tumor location was revealed as another risk factor.

Furthermore, among behavior, Hazard Ratio (HR) for patients with Non-structuring, non- penetrating compared to penetrating also reached a significant level. Also concerning the type of surgery, patients with strictureplasty, small bowel resection, total colectomy, total colectomy, total proctocolectomy with permanent ileostomy and ileostomy also had a signif- icant HR with ileocecectomy as reference category. On the other hand, patients only with right colectomy were significant in complete case analysis. The C-index had similar values however comparing the likelihood ratio test statistic, using multiple imputation with in- corporating the multi-center effect method showed further improvement (99.1 versus 66.2) compared to complete case analysis ignoring the multi-center effect.

4. Conclusion

This paper considered the risk factors for the recurrence time after the first surgery of Crohns patients. The data had several missing covariates and due to missing values only 76.4% of patients could be included in the statistical analysis. Exclusion of missing data leads to loss of power therefore missing data cannot be ignored and proper missing data methods should be used. We used single and multiple imputation methods to impute the missing covariates.

In our paper through imputing the missing values, several sub-categories of covariates reached the significant level compared to the complete-case analysis. In our analysis we also considered the multi-center effect since the patients were recruited from different hospitals.

Robust sandwich covariance matrix estimate was used to account for the dependence of the

(7)

Table 3.2 Multivariate Cox regression result comparing complete case analysis, imputation single and multiple imputation methods

Complete case without Single imputation with Multiple imputation multi-center effect multi-center effect with multi-center effect (23.6% case missing)

HR p-value HR p-value HR p-value

Gender

Male 1.253 0.345 1.266 0.106 1.098 0.564

Female 1 1 1

Family history

Yes 1.847 0.421 0.659 0.092 1.503 0.600

No 1 1 1

Age at diagnosis

<=16 3.188 0.162 3.325 0.002 2.966 0.028

17-40 1.908 0.018 1.785 0.076 1.754 0.067

>=41 1 1 1

Location

lleal 0.518 0.170 0.748 0.1953 0.613 0.050

Colonic 1.543 0.433 1.780 0.001 1.696 0.101

lleocolonic 1.280 0.629 1.513 0.001 1.471 0.030

Isolated upper disease 1 1 1

Behavior 166

Non-structuring, 1.448 0.251 1.566 0.051 1.580 0.034

non-penetrating

Stricturing 2.138 0.015 1.761 0.032 1.760 0.021

Penetrating 1 1 1

Type of surgery

Strictureplasty 4.994 0.055 3.312 0.001 4.636 <0.001

Small bowel resection 1.734 0.070 1.703 0.008 1.916 0.003

Right colectomy 0.482 0.031 0.485 <0.001 0.464 <0.001

Left colectomy 0.749 0.783 1.245 0.520 1.276 0.519

Total colectomy 0.333 0.160 0.291 0.035 0.250 0.003

Total proctocolectomy 2.774 0.269 1.794 0.551 2.143 0.368

with IPAA

Total proctocolectomy 0.209 0.133 0.337 < 0.001 0.317 <0.001 with permanent

ileostomy

ileostomy 2.540 0.146 1.829 0.255 4.908 <0.001

Others 1.077 0.861 1.163 0.635 1.018 0.958

ileocecectomy 1 1 1

Indication of Surgery

Medical Intractability 0.335 0.030 0.324 0.003 0.373 0.006

Intestinal obstruction 0.366 0.011 0.555 0.023 0.525 0.047

Intra-abdominal abscess 1.111 0.766 1.062 0.776 1.174 0.602

Fistulas 0.504 0.139 0.733 0.348 0.815 0.571

Massive bleeding 0.454 0.327 0.932 0.889 0.678 0.592

others 1 1 1

Steroid

Yes 1.128 0.614 1.172 0.331 1.071 0.732

No 1 1 1

5 ASA

Yes 1.245 0.435 1.3621 0.185 1.438 0.256

No 1 1 1

(8)

Table 3.3 Conti.

Complete case without Single imputation with Multiple imputation multi-center effect multi-center effect with multi-center effect (23.6% case missing)

HR p-value HR p-value HR p-value

Time interval

Diagnosis after surgery 1.862 0.060 1.438 0.403 1.567 0.356

Within 7 days 1.072 0.823 1.028 0.953 1.093 0.860

Between 7 and 30 days 0.738 0.634 1.480 0.160 1.558 0.194

Over 30 days 1 1 1

Performance of models

C-index (SE) 0.735 (0.033) 0.724 (0.026) 0.734 (0.026)

Likelihood ratio test 66.2 92.6 99.1

correlated survival time. After imputing the missing covariates we used the Cox regression analysis with adjusting for the multi-center effect. Based on model performance imputation methods with incorporating the multi-center effect had better performance than the com- plete case. Between the multiple and single imputation, multiple imputation methods had better performance. Based on the result of multiple imputation the risk factors for the re- currence time revealed as age at diagnosis, tumor location, tumor behavior, type of surgery and operative indications. The risk of recurrence time was 3 time higher in young patients (under 16 years old) than older patients. Stricturing, Non-stricturing and non-penetrating behavior at diagnosis was also a risk factor compared to penetrating behavior. In location, ileocolonic increased the recurrence risk compared to isolated upper disease. Among the type of surgery strictureplasty, small bowel resection, ileostomy increased the risk of recur- rence time, however right colectomy, total colectomy, total proctocolectomy with permanent ileostomy decreased the risk of recurrence time compared to ileocecectomy. Concerning op- erative indications, medical intractability and intestinal obstruction decreased the risk of recurrence time compared to others.

This work has several limitations. This paper only compared the performance of the complete-case analysis with two imputation methods (predictive mean matching and MI- MICE) under of total missing rate 23.6%. The performance of the model is known to depend on missing rate, missing pattern (Kang, 2005; Heo, 2016) imputation methods and also the sample size (Musil et al., 2002). Thus further works might be to compare with different data settings also with different imputation methods and the performance can be compared through various settings of simulation works. Sensitive analysis will be another future work.

Through sensitive analysis robustness of the model against misspecifications of the random effect distribution can be checked. Also the multiple imputation methods assumes that a multivariate distribution exists and is based on fully conditional specification. Thus for fur- ther study we could apply a non-parametric bootstrap method that does not depend on the distribution assumption.

References

Brand, J. P. L. (1999). Development, implementation and evaluation of multiple imputation strategies for the statistical analysis of incomplete data sets, Erasmus University, Rotterdam.

Burton, A. and Altman, D. G. (2004). Missing covariate data within cancer prognostic studies: A review of

current reporting and proposed guidelines. British Journal of Cancer , 91, 4-8.

(9)

Carpenter, J. R., Kenward, M. G. and Vansteelandt, S. (2006). A comparison of multiple imputation and inverse probability weighting for analyses with missing data. Journal of Royal Statistical Socciety, Series A, 169, 571-584.

Glidden, D. V. and Vittinghoff, E. (2004). Modelling clustered survival data from multicentre clinical trials.

Statistics of Medicine, 23, 369-388.

Heagerty, P. J. and Zeger, S. L. (1996). Marginal regression models for clustered ordinal measurements.

Journal of American Statistical Association, 91, 1024-1036.

Heitjan, D. F. and Little, R. J. A. (1991). Multiple imputation for the fatal accident reporting system.

Applied Statistics, 40, 13-29.

Heo, S.Y. (2017). Variance estimation for distribution rate in stratified cluster sampling with missing values.

Journal of the Korean Data & Information Science Society, 28, 443-449.

Kang, S. H. (2004). Comparison of five single imputation methods in general missing pattern. Journal of the Korean Data & Information Science Society, 15, 945-955.

Kang, S. H. (2005). Comparison of EM and multiple imputation methods with traditional methods in monotone missing pattern. Journal of the Korean Data & Information Science Society, 16, 95-106.

Kim. B. H., Ha, I. D., Lee, D.H.(2016). Analysis of multi-center bladder cancer survival data using variable- selection method of multi-level frailty models. Journal of the Korean Data & Information Science Society, 27, 499-510.

Lee, K. Y., Yu, C. S., Lee, K. Y., Cho, Y. B., Park, K. J., Choi, G. S,, Yoon, S. N. and Yoo, H. (2012). Risk factors for repeat abdominal surgery in Korean patients with Crohns disease: A Multiple-center study of a Korean inflammatory bowel disease study group. Journal of the Korean Society of Coloproctology, 28, 188-194.

Little, R. J. A. and Rubin, D. B. (2002). Statistical analysis with missing data, John Wiley & Son, New York.

Liu, L. and Hedeker, D. (2006). A mixed-effects regression model for longitudinal multivariate ordinal data.

Biometrics, 62, 261-268.

Musil, C. M., Warner, C. B., Yobas, P. K. and Jones, S. L. (2002). A comparison of imputation techniques for handling missing data. Western Journal of Nursing Research, 24, 815-829.

Rubin, D. B. (1987). Multiple imputation for nonresponse in surveys, John Wiley & Sons, New York.

Schenker, N. and Jeremy, M. G. T. (1996). Partially parametric techniques for multiple imputation. Com- putational Statistics & Data Analysis, 22, 425-446.

The Diabetic Retinopathy Study Research Group. (1981). Photocoagulation treatment of proliferative di- abetic retinopathy: Clinical application of diabetic retinopathy study (DRS) findings: DRS report number 8. Ophthalmology, 88, 583-600.

Van Buuren, S. (2007). Multiple imputation of discrete and continuous data by fully conditional specifica- tion. Statistical Methods in Medical Research, 16, 219-242.

Van Buuren, S., Boshuizen, H. C. and Knook, D. L. (1999). Multiple imputation of missing blood pressure covariates in survival analysis. Statistics in Medicine, 18, 681-694.

Van Buuren, S. and Groothuis-Oudshoorn, K. (2011). mice: Multivariate imputation by chained equations in R. Journal of statistical software, 45.

Wei, L. J., Lim, D. Y. and Weissfeld, L. (1989). Regression analysis of multivariate incomplete failure time

data by modeling marginal distributions. Journal of American Statistical Association, 84, 1065-1073.

수치

Table 3.1 Covariates and missing rates for the CD data
Table 3.2 Multivariate Cox regression result comparing complete case analysis, imputation single and multiple imputation methods
Table 3.3 Conti.

참조

관련 문서