• 검색 결과가 없습니다.

Genetic Diversity Analyses of Asian Duck Populations using 24 Microsatellite Markers

N/A
N/A
Protected

Academic year: 2021

Share "Genetic Diversity Analyses of Asian Duck Populations using 24 Microsatellite Markers"

Copied!
7
0
0

로드 중.... (전체 텍스트 보기)

전체 글

(1)

Genetic Diversity Analyses of Asian Duck Populations using 24 Microsatellite Markers

Hasina Sultana

1

, Dongwon Seo

1

, Nu-Ri Choi

1

, Yeon-Su Kim

1

, Prabuddha Manjula

1

, Md. Shamsul Alam Bhuiyan

1,2

, Kang-Nyeong Heo

3

and Jun-Heon Lee

1

1

Department of Animal and Dairy Science, Chungnam National University, Daejeon 34134, Korea

2

Department of Animal Breeding and Genetics, Bangladesh Agricultural University, Mymensingh-2202, Bangladesh

3

Poultry Research Institute, National Institute of Animal Science, RDA, Pyengchang 25342, Korea

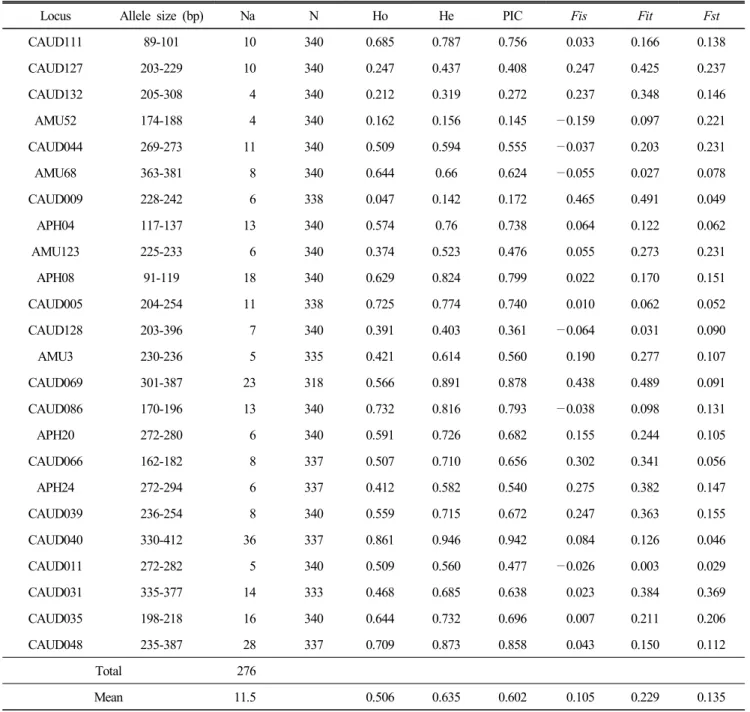
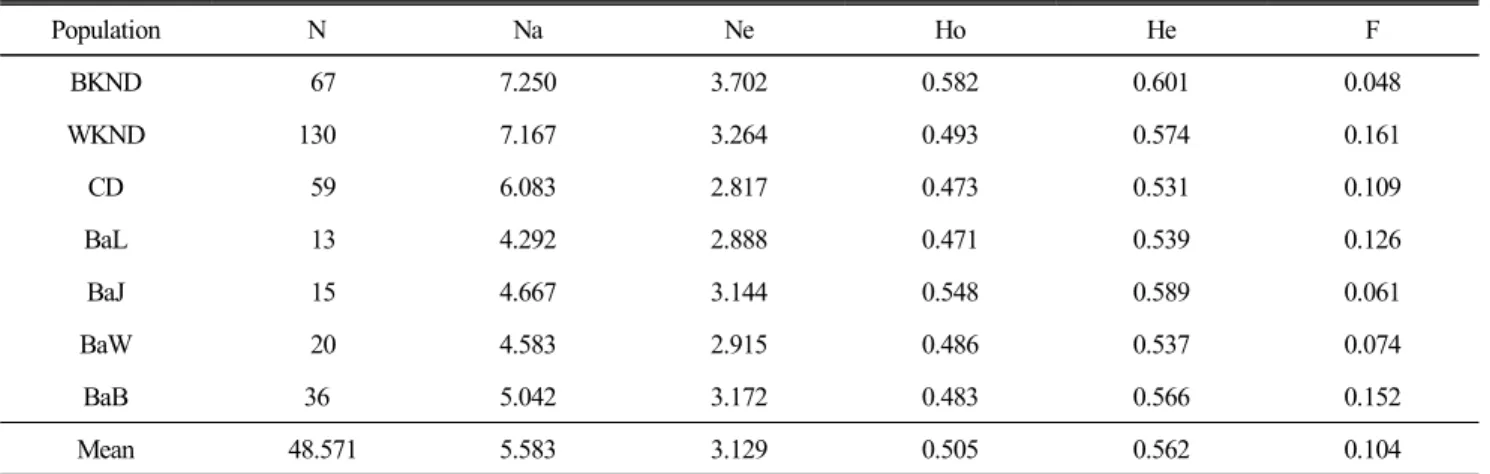
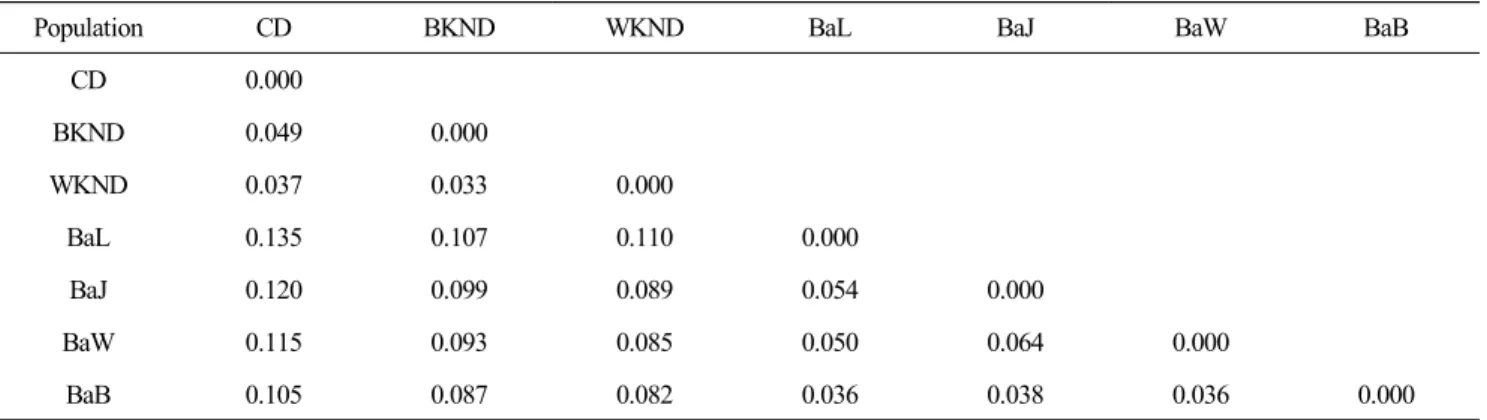
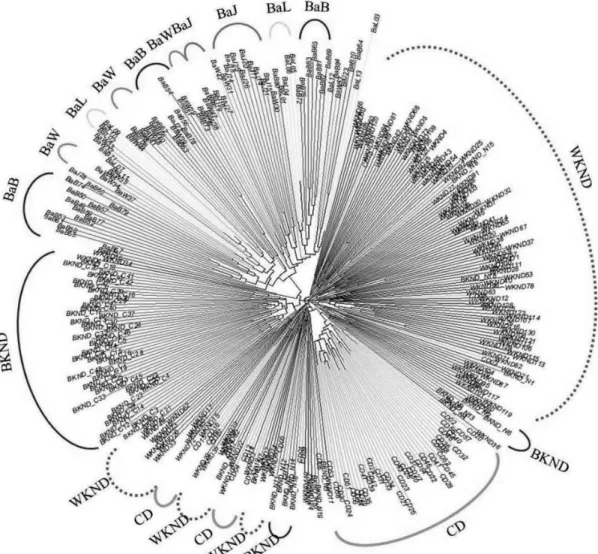
ABSTRACT A total of 340 individuals from seven duck populations were studied using 24 polymorphic microsatellite (MS) markers to identify plumage colors with genetic diversity. The estimated average number of alleles (Na), polymorphic information content (PIC) value, and expected heterozygosity (He) per locus of all populations were 11.5, 0.602, and 0.635, respectively. The calculated population genetic distance (Fst), inbreeding coefficient of individuals within duck populations (Fis), and total inbreeding among populations (Fit) were 0.135, 0.105, and 0.229, respectively. Statistical analyses for each population using 24 marker combinations, revealed that the estimated average number of effective alleles (Ne), observed heterozygosity (Ho), and fixation index of inbreeding within populations (F) were 3.129, 0.505, and 0.104, respectively. The results of genetic distance and phylogenetic analysis revealed that Korean native duck populations were clearly separated from all Bangladeshi duck populations. Moreover, all populations clustered well according to their genetic distance, but could not be clearly separated according to black and white plumage colors or plumage color pattern. The combination of these 24 MS markers can be used for discrimination and determination of the genetic diversity of native duck breeds in further investigations for conservation and special development purposes.

(Key words: Asian duck population, microsatellite, genetic diversity, plumage color)

To whom correspondence should be addressed : [email protected]

INTRODUCTION

Microsatellites (MS), highly polymorphic, abundant in the genome, are powerful and excellent as molecular markers for QTL mapping, parentage determination, population diversity, evolutionary and ecological studies (Edwards et al., 1991;

Hedrick, 1999). MS markers are widely used for confirmation of genetic relationships between and among breeds or varie- ties in agricultural sector. Native livestock breeds, valuable genetic resources are adapted in different environments and geographical locations and plays an important role in eco- nomic development to the local countries. However, native breeds are going to become extinct by subsequently reducing in numbers and the genetic diversity within and between po- pulations. Nowadays, duck meats become popular day by day in Asian countries and have been increased commercial duck farms and food processing industries. According to consumer’s demand and economic profits, indigenous breeds have been replaced by the high producing commercial breeds or varieties.

In this point of view, MS markers could be convenient tools

for investigation of genetic relationships between and within populations.

In Korea, there are two types of indigenous duck popula- tions known as Korean native duck (KND). These populations consist of black and white color duck breeds are important genetic resources and many people like those duck meats for its unique flavor and taste than commercial ducks (Kim et al., 2012). National Institute of Animal Science (NIAS) in Korea has been conducted projects for conservation and improvement of duck genetic resources. As consumers have high demand for Korean native duck meats, NIAS has started the production of Korean native ducks commercially. Among Asian indigenous duck breeds, most of the Chinese duck breeds are characterized and discriminated by MS markers (Wu et al., 2008) in the previous studies. Previously, highly polymorphic MS markers were investigated to identify the population structure and genetic diversity of Korean native white duck and Bangladeshi indigenous duck breeds (Seo et al., 2016).

In current study, we used 24 polymorphic markers to assess

the genetic diversity and plumage color differences of seven

(2)

Asian duck populations. The aim of this study was to discri- minate the Asian duck breeds using MS markers for their genetic and plumage color differences.

MATERIALS AND METHODS

1. Sample Collection and DNA Extraction The blood samples of 67 black Korean native duck (BKND) (n=48, BKND_C from Chungnam National University farm and n=19, BKND_N from the Poultry Science Division, NIAS; Korea) and 39 commercial duck blood (CD) samples from Cherry Velley Company, Korea were collected. The genomic DNA was extracted from blood samples of BKND and CD using PrimePrep

TM

genomic DNA isolation kit for blood (GeNetBio, Korea). DNA concentration of each sample was checked using NanoDrop 2000c UV-Vis Spectrophoto- meter (Thermo Fisher Scientific Inc., USA) to confirm the quantity and quality of the extracted DNA.

2. Microsatellite Marker and Genotyping Multiplex polymerase chain reaction (Multiplex PCR) was carried out in total volume of 20 µL and reaction buffer con- taining 50 ng genomic DNA, 8 pmol of four fluorescent dye (FAM, VIC, NED, PET) labeled forward primers and normal reverse primers, 2X multi HS Prime Taq Premix (GeNetBio, Korea) and distilled water. Twenty four primer pairs, the PCR reaction conditions and genotyping which used in our present study were followed by Seo et al. (2016). Twenty four primer pairs were used in our present study (Seo et al., 2015). The PCR was performed in a My-Genie 96 Thermal Block (Bio- neer Co., Korea) using the following conditions: 95 ℃ for 10 minutes for pre-denaturation followed by 31 cycles of denatu- ration at 95℃ for 30 seconds, annealing at 63℃ for 30 seconds, and extension at 72℃ for 30 seconds, and a final extension at 72 ℃ for 10 minutes. A total volume of 11.1 µL genotyping reaction mixture contained 1 µL diluted PCR products, 10 µL of Hi-Di

TM

Formamide (Applied Biosystems, USA), and 0.1 µl GeneScan

TM

-500LIZ

TM

size standard marker (Applied Bio- systems, USA). The genotyping mixture was denatured at 95

℃ for 3 minutes.

3. Statistical Analysis

A total of 340 individuals genotype data were carried out from seven Asian duck populations for statistical analysis.

Among them, 106 individuals genotype data (67 BKND and 39 CD) from our present experiment and 130 white Korean native duck (WKND); 20 commercial duck (CD); and 84 Bangladeshi ducks of four populations [36 Nageswari duck (BaB), 20 Deshi white duck (BaW), 13 Bangladeshi local duck (BaL) and 15 Jinding duck (BaJ)] from our previous study (Seo et al., 2016) were used in this study. The genotyping data were used to calculate the basic statistics, such as mean number of alleles (Na), observed and expected heterozygosity (Ho and He), and polymorphic information content (PIC) values were calculated using Cervus (ver 3.0.7) program (Mar- shall et al., 1998). F-statistics were estimated for each markers using GenAlEx version 6.501 (Peakall and Smouse, 2012).

The average number of effective alleles (Ne), average hetero- zygosity (Ho and He) values and fixation index over loci of each population were estimated using GenAlEx version 6.501 program. The Nie’s standard genetic distance was estimated by allele frequency between pairs of population over loci for describing the genetic distance of populations using GenAlEx program. The Neighbor-joining tree was constructed based on resulting genetic distance matrix using R package (ver: 3.4.0) ape (Paradis et al., 2004) for phylogenetic analysis among individuals.

RESULTS AND DISCUSSION

1. Genetic Diversity among Loci and Populations

The number of alleles, allele size, and polymorphic infor-

mation content (PIC), heterozygosity and F-statistic values in

each microsatellite locus are summarized in Table 1. A total

of 276 alleles were calculated from 24 microsatellite (MS)

markers in research populations ranging from 4 (CAUD132

and AMU52) to 36 (CAUD040) alleles with an average of

11.5 per locus. The PIC value, a vital index for marker selec-

tion of all loci varied from 0.145 (AMU52) to 0.946 (CAUD-

040). The obtained average value of observed heterozygosity

(Ho) and estimated heterozygosity (He) per locus were 0.506

and 0.635 respectively. Botstein et al. (1980) in their study,

PIC value categorized MS loci in three types: low, interme-

diate and high diversity locus when PIC < 0.25, between 0.25

(3)

Table 1. The statistical analysis of number of alleles (Na), heterozygosity values (Ho and He), polymorphic information content (PIC) and F-statistic value per locus of all duck populations.

Locus Allele size (bp) Na N Ho He PIC Fis Fit Fst

CAUD111 89-101 10 340 0.685 0.787 0.756 0.033 0.166 0.138

CAUD127 203-229 10 340 0.247 0.437 0.408 0.247 0.425 0.237

CAUD132 205-308 4 340 0.212 0.319 0.272 0.237 0.348 0.146

AMU52 174-188 4 340 0.162 0.156 0.145 —0.159 0.097 0.221

CAUD044 269-273 11 340 0.509 0.594 0.555 —0.037 0.203 0.231

AMU68 363-381 8 340 0.644 0.66 0.624 —0.055 0.027 0.078

CAUD009 228-242 6 338 0.047 0.142 0.172 0.465 0.491 0.049

APH04 117-137 13 340 0.574 0.76 0.738 0.064 0.122 0.062

AMU123 225-233 6 340 0.374 0.523 0.476 0.055 0.273 0.231

APH08 91-119 18 340 0.629 0.824 0.799 0.022 0.170 0.151

CAUD005 204-254 11 338 0.725 0.774 0.740 0.010 0.062 0.052

CAUD128 203-396 7 340 0.391 0.403 0.361 —0.064 0.031 0.090

AMU3 230-236 5 335 0.421 0.614 0.560 0.190 0.277 0.107

CAUD069 301-387 23 318 0.566 0.891 0.878 0.438 0.489 0.091

CAUD086 170-196 13 340 0.732 0.816 0.793 —0.038 0.098 0.131

APH20 272-280 6 340 0.591 0.726 0.682 0.155 0.244 0.105

CAUD066 162-182 8 337 0.507 0.710 0.656 0.302 0.341 0.056

APH24 272-294 6 337 0.412 0.582 0.540 0.275 0.382 0.147

CAUD039 236-254 8 340 0.559 0.715 0.672 0.247 0.363 0.155

CAUD040 330-412 36 337 0.861 0.946 0.942 0.084 0.126 0.046

CAUD011 272-282 5 340 0.509 0.560 0.477 —0.026 0.003 0.029

CAUD031 335-377 14 333 0.468 0.685 0.638 0.023 0.384 0.369

CAUD035 198-218 16 340 0.644 0.732 0.696 0.007 0.211 0.206

CAUD048 235-387 28 337 0.709 0.873 0.858 0.043 0.150 0.112

Total 276

Mean 11.5 0.506 0.635 0.602 0.105 0.229 0.135

Na: number of alleles, N: Number of genotyped duck, Ne: number of effective alleles, Ho: observed heterozygosity, He: expected hetero- zygosity, PIC: polymorphic information content, Fis: inbreeding within population, Fit: total indreeding, Fst: genetic distance.

and 0.5, and > 0.5 respectively. Moreover, Berthouly et al.

(2008) reported that MS loci are considered as suitable mar- kers for individual and breed discrimination and selection purposes when PIC and He values more than 0.5 and 0.6, respectively. In this study, the average PIC value in each MS locus was 0.602 in studied populations which indicating these

MS loci are reliable markers for identifying genetic relation-

ship and discriminating breeds. Among these markers, the

identified 17 highly polymorphic markers which marked as

bold (Table 1) can be used for accurate estimation of diver-

sity and population structure analysis in future large resource

populations. CAUD040 was the highest polymorphic marker

(4)

Table 2. The distribution of the number of alleles (Na), number of effective alleles (Ne), heterozygosity (Ho and He) values and fixation index over loci of seven Asian duck populations

Population N Na Ne Ho He F

BKND 67 7.250 3.702 0.582 0.601 0.048

WKND 130 7.167 3.264 0.493 0.574 0.161

CD 59 6.083 2.817 0.473 0.531 0.109

BaL 13 4.292 2.888 0.471 0.539 0.126

BaJ 15 4.667 3.144 0.548 0.589 0.061

BaW 20 4.583 2.915 0.486 0.537 0.074

BaB 36 5.042 3.172 0.483 0.566 0.152

Mean 48.571 5.583 3.129 0.505 0.562 0.104

BKND: Black Korean native duck, WKND: White Korean native duck, CD: Commercial (Peking) duck, BaL: Common indigenous duck, BaJ: Jinding, BaW: Deshi white, BaB: Nageswari (Deshi black), N: population size, Na: average number of alleles, Ne: number of effective alleles, Ho: observed heterozygosity, He: expected heterozygosity and F: fixation index of inbreeding within population.

which has highest number of alleles, Ho, He and PIC values across seven duck populations. The highest number of alleles (Na) was observed in BKND (7.25) and average Na value was 5.583 among all populations. The number of effective alleles (Ne), Ho and He over 24 loci among populations ranged from 2.817 (CD) to 3.702 (BKND), 0.471 (BaL) to 0.582 (BKND) and 0.531 (CD) to 0.601 (BKND), respectively (Ta- ble 2).

F-statistic, a fixation index for estimating the inbreeding within population (Fis), total inbreeding among populations (Fit) and genetic distance (Fst) were calculated for 24 MS loci and each value are presented in Table 1. The obtained mean value of Fis, Fit and Fst were 0.105, 0.229 and 0.135, respectively. The average Fst value was 0.135, indicating medium genetic differentiation among populations (Wright, 1978) and admixture of these breeds for crossbreeding which supported by the findings of Liu et al. (2008). Wright (1978) suggested four categories genetic differentiation considering the range of Fst value; little (0.0 to 0.05), moderate (0.05 to 0.15), great (0.15 to 0.25) and very great (above 0.25). In our study, the results of Fis value had negative values in 6 cases.

The negative values for Fis indicated that high heterozygosity in outbreeding while positive values for low heterozygosity due to inbreeding within population (Wright, 1965). The fixa- tion index of inbreeding within population over all loci varied from 0.048 (BKND) to 0.161 (WKND) and the mean value

was confirmed 0.104 (Table 2). The result of polymorphism information of each MS locus and genetic diversity of studied duck populations were quite similar with the results of Chi- nese duck breeds (Liu et al., 2008; Wu et al., 2008), which consisting a little lower value compared with chicken and geese (Choi et al., 2015; Tu et al., 2006).

2. Genetic Distances

The Nei’s genetic distances considering pairwise popula- tion matrix was calculated based on allele frequencies and the results are shown in Table 3. The highest genetic distance was observed between CD and BaL populations (0.475) and the lowest genetic distance was found between BaB and BaL populations (0.096). Table 4 shows the highest genetic dis- tance according to Fst value was also observed between CD and BaL populations (0.135), while the lowest genetic distance was between BKND and WKND (0.033). The results of ge- netic distances between pairwise populations described that BKND population had low genetic distances with WKND and CD populations whereas high genetic distances showed with Bangladeshi duck populations (BaB, BaW, BaJ and BaL).

These results also revealed that CD and WKND populations

had low genetic distances with BKND and high genetic dis-

tances with Bangladeshi duck populations. However, the

genetic distances among Bangladeshi duck populations showed

closer than Korean duck populations.

(5)

Table 3. Pairwise population matrix of Nei’s genetic distance

Population CD BKND WKND BaL BaJ BaW BaB

CD -

BKND 0.148 -

WKND 0.111 0.101 -

BaL 0.475 0.422 0.400 -

BaJ 0.429 0.412 0.348 0.159 -

BaW 0.377 0.327 0.272 0.141 0.200 -

BaB 0.342 0.329 0.298 0.096 0.118 0.103 -

BKND: Black Korean native duck, WKND: White Korean native duck, CD: Commercial (Peking) duck, BaL: Common indigenous duck, BaJ: Jinding, BaW: Deshi White, BaB: Nageswari (Deshi black).

Table 4. Nei’s genetic distance by Fst values between every two populations

Population CD BKND WKND BaL BaJ BaW BaB

CD 0.000

BKND 0.049 0.000

WKND 0.037 0.033 0.000

BaL 0.135 0.107 0.110 0.000

BaJ 0.120 0.099 0.089 0.054 0.000

BaW 0.115 0.093 0.085 0.050 0.064 0.000

BaB 0.105 0.087 0.082 0.036 0.038 0.036 0.000

BKND: Black Korean native duck, WKND: White Korean native duck, CD: Commercial (Peking) duck, BaL: Common indigenous duck, BaJ: Jinding, BaW: Deshi White, BaB: Nageswari (Deshi black).

3. Phylogenetic Analysis of Seven Populations A phylogenetic (NJ) tree was constructed using 24 MS marker variations for 340 individuals from seven duck popula- tions (Fig. 1). Three populations of Korean ducks which are consist of BKND, WKND and CD were separated with four Bangladeshi duck populations (BaB, BaW, BaJ and BaL) but mixed with small clustered group among themselves. Further- more, NJ tree revealed that the individual samples from BaB, BaW, BaJ and BaL populations were not separated and con- tained mixture clade with small groups. Also, the phylogenetic tree showed that Korean native duck populations were not clearly separated on the basis of black and white plumage color, whereas they formed mixture clade with groups and same pattern was observed in Bangladeshi duck populations.

Korean native black and white duck populations, which had

close genetic distance, may be originated from one breed but

different variety. The results of phylogenetic analysis indicated

that Korean and Bangladeshi duck populations might have

originated from common ancestor but different subpopulation,

domesticated in different environment and geographical loca-

tion (Seo et al., 2016). Bangladeshi duck populations had

very close genetic distance because of interbreeding among

them. Also, special long term breeding system selecting pure-

bred was not followed by the government and small scale

duck breeding farms. Therefore, interbreeding among Bangla-

deshi duck varieties are common feature and had admixture

among the populations. Previous studies of phylogenetic ana-

lysis of Korean native duck breeds using mitochondrial DNA

D-loop region sequences reveled that they had close genetic

distance with Mallard duck (Anas platyrhynchos) and Spot-

(6)

Fig. 1. Phylogenetic tree based on the genetic distances among individuals from seven populations. The population acronyms are as follows: BKND (Black Korean native duck), WKND (White Korean native duck), CD (Commercial (Peking) duck), BaL (Common indigenous duck), BaJ (Jinding), BaW (Deshi White), BaB (Nageswari [Deshi black] duck).

billed duck (Anas zonorhyncha) (Jin et al., 2014; Sultana et al., 2016). Crossbreeding among commercial and native duck varieties usually practice for the development of rapid and quality meat production and as well as better egg production.

Therefore, we hypothesis that results of phylogenetic analysis and membership probability of admixed individuals within groups showed mixed small clusters because of the common ancestor (migratory wild mallard duck) in our studied do- mestic ducks and crossbreeding.

In conclusion, our results revealed that these 17 MS mar- kers have high discrimination power to identify breeds and can be used for investigation of population structure and phylogenetic relationship of breeds.

ACKNOWLEDGMENTS

This work was supported by a grant from the “Cooperative Research Program for Agriculture Science & Technology De- velopment (Project No. PJ010114012015),” Rural Development Administration (RDA), Republic of Korea.

REFERENCES

Berthouly C, Bed'Hom B, Tixier-Boichard M, Chen CF, Lee

YP, Laloe D, Legros H, Verrier E, Rognon X 2008 Using

molecular markers and multivariate methods to study the

genetic diversity of local European and Asian chicken

(7)

breeds. Anim Genet 39:121-129.

Botstein D, White RL, Skolnik M, Davis RW 1980 Construc- tion of a genetic linkage map in man using restriction fragment length polymorphisms. Am J Hum Genet 32:314- 331.

Choi NR, Seo DW, Jemma SB, Sultana H, Heo KN, Jo C, Lee JH 2015 Discrimination of the commercial Korean native chicken population using microsatellite markers. J Anim Sci Technol 57(5):1-8.

Edwards A, Civitello A, Hammond HA, Caskey CT 1991 DNA typing and genetic mapping with trimeric and tetrameric tandem repeats. Am J Hum Genet 49(4): 746-756.

Hedrick PW 1999 Perspective: Highly variable loci and their interpretation in evolution and conservation. Evolution 53 (2):313-318.

Jin SD, Hoque MR, Seo DW, Paek WK, Kang TH, Kim HK, Lee JH 2014 Phylogenetic analysis between domestic and wild duck species in Korea using mtDNA D-loop sequences.

Molecular Biology Report 41:1745-1752.

Kim HK, Kang BS, Hwangbo J, Kim CD, Heo KN, Choo HJ, Park DS, Suh OS, Hong EC 2012 The study on growth performance and carcass yield of meat-type Korean native ducks. Korean J Poult Sci 39:45-52.

Liu W, Hou ZC, Qu LJ, Huang YH, Yao JF, Li N, Yang N 2008 Population structure and biodiversity of Chinese in- digenous duck breeds revealed by 15 microsatellite markers.

Asian Australasian Journal of Animal Science 21:314-319.

Marshall TC, Slate J, Kruuk LEB, Pemberton JM 1998 Stati-

stical confidence for likelihood-based paternity inference in natural populations. Mol Ecol 7: 639-655.

Paradis E, Claude J, Strimmer K 2004 APE: analyses of phy- logenetics and evolution in R language. Bioinformatics 20:

289-90.

Peakall R, Smouse PE 2012 GenAlEx 6.5: genetic analysis in Excel. Population genetic software for teaching and re- search- an update. Bioinformatics 28:2537-2539

Seo DW, Bhuiyan MSA, Sultana H, Heo KN, Lee JH 2016 Genetic diversity analysis of South and East Asian duck populations using highly polymorphic microsatellite mar- kers. Asian-Aust J Anim Sci 29(4):471-478.

Tu YJ, Chen KW, Zhang SJ, Tang QP, Gao YS, Yang N 2006 Genetic diversity of 14 indigenous grey goose breeds in china based on microsatellite markers. Asian-Aust J Anim Sci 19:1-6.

Wright S 1978 Evolution and the Genetics of Populations.

Vol. 4. Variability within and among Natural Populations.

Univ. of Chicago Press, Chicago.

Wright S 1965 The interpretation of population structure by fstatistics with special regard to systems of mating. Evol 19:395-420.

Wu Y, Lui XL, Hou SS, Huang W 2008 Study on genetic diversity of six duck populations with Microsatellite DNA.

Asian-Aust J Anim Sci 21(4):776-783.

Received Apr. 5, 2017, Revised Jun. 20, 2017, Accepted Jun.

22, 2017

수치

Table  1.  The  statistical  analysis  of  number  of  alleles  (Na),  heterozygosity  values  (Ho  and  He),  polymorphic  information  content  (PIC)  and  F-statistic  value  per  locus  of  all  duck  populations
Table  2.  The  distribution  of  the  number  of  alleles  (Na),  number  of  effective  alleles  (Ne),  heterozygosity  (Ho  and  He)  values  and  fixation  index  over  loci  of  seven  Asian  duck  populations
Table  4.  Nei’s  genetic  distance  by  Fst  values  between  every  two  populations
Fig.  1.  Phylogenetic  tree  based  on  the  genetic  distances  among  individuals  from  seven  populations

참조

관련 문서

1 John Owen, Justification by Faith Alone, in The Works of John Owen, ed. John Bolt, trans. Scott Clark, &#34;Do This and Live: Christ's Active Obedience as the

23) CCFL의 의제로서 제목은 “Labeling of Foods and Food Ingredients Obtained through Certain Techniques of Genetic Modification/Genetic

Background : The E133K genetic variation of AGGF1 gene that is a potent angiogenetic factor have been assumed genetic susceptible factor for Klippel-Trenaunay

XRD analysis, surface roughness test, FE-SEM imaging, and biaxial flexural strength test were performed... Results: In the result of XRD analysis, an phase change occurred

Tullio Scovazzi, “Open Questions on the Exploitation of Genetic Resources in Areas Beyond National Jurisdiction”, Am. Nagoya Protocol on Access to Genetic Resources and the

Therefore, in this study, genetic tests were performed to investigate and identify the infections of Orientia tsutsugamushi, Ricekttsia genus, Anaplasma phagocytophilum ,

Statistical analyses were performed using SPSS software (version 12.0, SPSS Inc, Chicago, IL, USA). Measurements of the alveolar bone thickness from the root

Based on this research, I hope that the direction of Korean classical music education, diversity of teaching materials and teaching method of contents area