•Received 08 November 2013, revised 30 November 2013, accepted 02 December 2013.
* Corresponding author: Tel : +82-33-250-6353 Fax : +82-33-254-6357 E-mail : [email protected]
Bacterial growth and carbon-to-phosphorus consumption in drinking water with different carbon and phosphorus levels
수돗물의 탄소와 인 농도에 따른 세균의 생장과 C/P 소모율
Sung-Chan Choi
1·Se-Keun Park
2·Yeong-Kwan Kim
2*최성찬1·박세근2·김영관2*
1
Department of Environmental Science & Biotechnology, Hallym University
2
Department of Environmental Engineering, Kangwon National University
Abstract : Bacterial growth and corresponding consumption of carbon and phosphorus were examined in which tap water samples containing a very low concentration of free chlorine were supplemented with organic carbon and/or phosphorus. The experiments were performed in a fed-batch mode under a controlled temperature of 20℃. In the phosphorus alone-added water, there was no significant increase in bacterial numbers measured as heterotrophic plate count (HPC) in the bulk water. However, bacterial growth was stimulated by the addition of carbon (e.g., bulk HPC levels increased to 10
3CFU/mL) and further stimulated by the combined addition of carbon and phosphorus (e.g., bulk HPC to 10
5CFU/mL). The same effects were observed in biofilm HPC and biomass formed on polyethylene (PE) slide surfaces. In the water where organic carbon and phosphorus were added together, the highest biofilm HPC and biomass (measured as extracellular polymeric substance components) densities were observed which were 7.6×10
5CFU/cm
2and 5.3 μg/cm
2, respectively. In addition to the bacterial growth, additions of organic carbon and/or phosphorus resulted in different bacterial carbon-to-phosphorus (C/P) consumption ratios. Compared to a typical bacterial C/P consumption ratio of 100:1, a higher C/P ratio (590:1) occurred in the carbon alone-added water, while a lower ratio (40:1) in phosphorus alone-added water. Comparative value (80:1) of C/P ratio was also observed in the water where organic carbon and phosphorus were added together. At the given experimental conditions, bacterial growth was deemed to be more sensitive to microbially available organic carbon than phosphorus. The effect of phosphorus addition, which resulted in a lower C/P consumption ratio, seemed to be tightly associated with the presence of microbially available organic carbon. These results suggested that the control of extrinsic carbon influx seemed to be more important to minimize bacterial regrowth in drinking water system, since even low content of phosphorus naturally occurring in drinking water was enough to allow a bacterial growth.
요약문 : 잔류염소 농도가 상당히 낮은 수돗물에서 유기탄소(organic carbon)와 인(phosphorus)의 증가가 세균 생장에 미치는 영향과 세균에 의한 유기탄소와 인의 소모를 fed-batch 실험조건(20℃ 수온)에서 조사하였다. 수돗물에서 단지 인의 증가만으로는 부유성 세균 의 현저한 수적 증가는 나타나지 않았다. 그러나 유기탄소의 증가는 부유성 세균을 10
3CFU/mL 수준까지 증가시켰으며, 특히 유기탄소 와 함께 동반된 인의 증가는 부유성 세균을 10
5CFU/mL 수준까지 증가시켰다. 이러한 효과들은 polyethylene (PE) slide 표면에 형성된 생물막 세균과 생물량 측정에서도 동일하게 나타났다. 유기탄소와 함께 인 농도가 높은 수돗물에서 PE slide 표면에 형성된 생물막 세균 과 세포외 중합체(extracellular polymeric substance) 구성 성분으로 측정된 생물량은 각각 7.6×10
5CFU/cm
2와 5.3 μg/cm
2로 가장 높았다. 세균 생장과 더불어, 수돗물에서 유기탄소와 인의 증가는 세균에 의한 탄소와 인의 이용 패턴에 영향을 미치는 것으로 나타났 다. 전형적인 세균의 C/P 소모비율(100:1)과 비교했을 때, 상대적으로 높은 C/P 소모비율(590:1)은 유기탄소 농도가 높은 수돗물에서, 그리고 상대적으로 낮은 C/P 소모비율(40:1)은 인 농도가 높은 수돗물에서 관찰되었다. 또한 유기탄소와 함께 인 농도가 높은 수돗물에
서도 상대적으로 낮은 C/P 소모비율(80:1)이 관찰되었다. 주어
진 실험조건에서는 수돗물과 생물막내 세균 생장이 인의 증가보
다는 유기탄소의 증가에 더욱 민감하게 반응하는 것으로 나타났
다. 수돗물에서 인의 증가는 세균의 낮은 C/P 소모비율을 가져
1. Introduction
It is well-documented that microorgan- isms in drinking water distribution sys- tems can grow in bulk water and become attached to pipe walls as biofilms, which contribute to the deterioration of water quality (Srinivasan and Harrington, 2007;
Sim
õ
es and Simõ
es, 2013). In drinking water, bacterial growth is affected by the availability of nutrients such as organic carbon, nitrogen, and phosphorus (Je- gatheesan et al., 2004), since all bacte- ria have specific nutritional requirements in order to carry out regular functions of growth and metabolism. The importance of organic carbon and/or phosphorus lim- itation to bacterial growth has been ad- dressed in many drinking water studies.It is known that biodegradable organic matter (BOM), especially assimilable or- ganic carbon (AOC) or biodegradable dis- solved organic carbon (BDOC) is a key factor for regulating bacterial growth in drinking water (Volk and LeChevallier, 2000; Chandy and Angles 2001; Escobar et al., 2001; Tsai et al., 2004; Ndiongue et al., 2005). Previous studies have shown that AOC and BDOC levels correlate to controlling or enhancing bacterial growth (van der Kooij, 1999; Volk and LeCheval- lier, 2000; Escobar et al., 2001; Jegathee-
san et al., 2004; Ndiongue et al., 2005). A high level of BOM is associated with pro- moting bacterial growth, but its poten- tial impact to stimulate bacterial growth may be moderated by other factors such as residence time, temperature, and dis- infectant residual concentrations (van der Kooij, 1999; Volk and LeChevallier, 2000;
Ndiongue et al., 2005).
Phosphorus is one of the key elements of bacterial cells constituting around 1% of the dry weight (Appenzeller et al., 2001).
It is a constituent of bio-molecules such as nucleic acids, ATP and phospholipids, and participates in various vital functions including energy delivery and regulation of cellular physiology (Kornberg and Fra- ley, 2000; Rashid et al., 2000). The usual source of phosphorus for bacteria is in- organic phosphate, which is vital to their survival and multiplication. Since phos- phorus can be removed by water treatment process such as coagulation/sedimentation and adsorption, its concentration seems to be very low in drinking water. It has been reported that the phosphorus levels in drinking water seldom exceed 5 μg/l (Mi- ettinen et al., 1997; Lehtola et al., 2003, 2004; Chu et al., 2005). In some countries such as Finland and Japan, phospho- rus has been shown to promote bacterial growth in drinking water (Miettinen et al.,
오지만, 세균 생장에 미치는 인의 영향은 세균이 쉽게 이용할 수 있는 유기탄소의 존재와 밀접하게 관련되어 있는 것으로 보인다. 그 러므로 수돗물에 자연적으로 존재하는 낮은 농도의 인만으로도 세균 생장을 위해 필요한 인 요구량을 만족시킬 수 있기 때문에, 수돗 물에서 세균 생장의 최소화를 위해서는 인보다는 유기탄소의 외부적인 유입을 제어하는 것이 더욱 중요한 것으로 판단된다.
Key words : Drinking water, Organic carbon, Phosphorus, Bacterial growth, Biofilm, C/P consumption ratio
주제어 : 수돗물, 유기탄소, 인, 세균 생장, 생물막, C/P 소모비율
1997; Sathasivan et al., 1997; Sathasivan and Ohgaki, 1999; Lehtola et al., 2001;
2002a,b). This finding drew attention to the importance of phosphorus as a limiting nutrient for bacterial proliferation, even though its potential effect may be only ob- served in certain drinking water, i.e. high level of BOM and very low level of phos- phorus. In addition, the large increase in concern is seen with the use of phosphate- based corrosion inhibitor in drinking water distribution system. Orthophosphate and polyphosphate are widely used to control pipe corrosion. While providing effective corrosion control, these compounds may serve as a potential phosphorus source for microorganisms leading to a significant change in biomass (Batt
é
et al., 2003a).Although the impacts of BOM and phos- phorus on bacterial growth in drinking wa- ter have received a great deal of attention, little is known about bacterial consumption of carbon and phosphorus in drinking wa- ter which contains autochthonous bacteria adapted to the oligotrophic environment.
This study focused on the bacterial growth and corresponding consumption of carbon and phosphorus in drinking water with various carbon and phosphorus concen- trations. Further information about bac- terial carbon-to-phosphorus consumption would provide a better understanding on the impact of carbon and/or phosphorus on bacterial regrowth in a nutrient-limit- ed drinking water environment.
2. Materials and Methods 2.1. Experimental setup
Laboratory-scale experiments employed four 1 l reagent bottles (Schott-DuranⓇ).
Prior to use, the following procedure was adopted to remove any residual phospho- rus and organic carbon: all the bottles were first washed with phosphate-free liquid detergent (Liqui-noxⓇ, Sigma-Al- drich), then immersed in 2% HCl solution for 2 h and finally rinsed with Milli-Q water. After the rinse, bottles were heated for 6 h at 550℃. Polyethylene (PE) slides (BST-503-PE, Biosurface Technologies Corporation, MT, USA), having a surface area of 46.6 cm2 (L 15.0 × W 1.4 × D 0.14 cm), were used to allow the colonization of bacterial cells onto the surface. They were rinsed thoroughly with Milli-Q water and autoclaved at 121℃, 15 psi for 15 min be- fore immersing in the bottles.
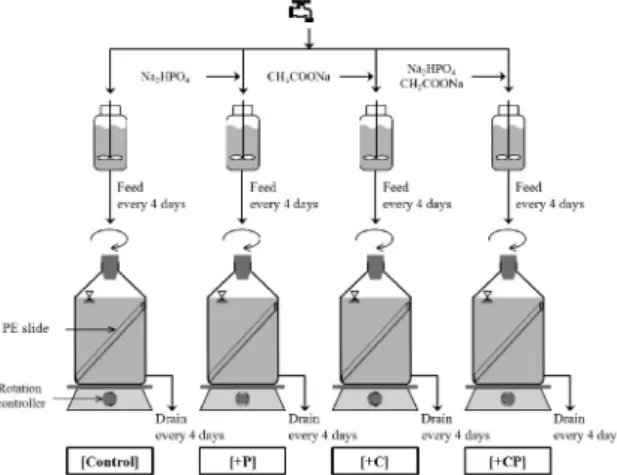
Four laboratory-scale experimental set- up was prepared (Fig. 1), which was de- noted as [Control] (no nutrient addition), [+P], [+C], and [+CP]. Each set contained one pre-sterilized PE slide. The experi- ments were performed in parallel under fed-batch conditions with intermittent
Fig. 1. Schematic diagram of the experimental set-up.
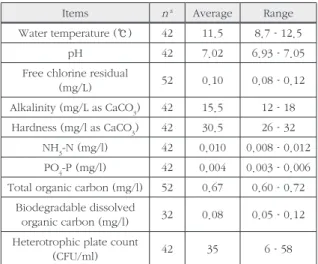
feed and decantation of bulk water. The characteristics of tap water used in the experiments are shown in Table 1. The tap water was supplied through a service res- ervoir that held drinking water produced from a nearby water treatment plant that had a process train of coagulation-floccu- lation, sedimentation, sand filtration and chlorination. At the beginning of the run, the bottles were filled up to 1 l with tap water having indigenous bacterial popula- tions which may be resulted from bacterial regrowth in distribution system such as service reservoir. In case of the [+C] and [+CP], high levels of organic carbon were provided by adding 3.0 ml of sodium ac- etate (CH3COONa, Sigma-Aldrich) solu- tion (500 mg/l total organic carbon (TOC), pH 7.0) to 1 l tap water, resulting in final TOC approximately 2.2 mg/l. In case of the [+P] and [+CP] which were designed to examine the effects of orthophosphate additions, tap water samples were supple- mented with 80 μl of sodium phosphate dibasic (Na2HPO4, Sigma-Aldrich) solution
(500 mg/l PO4-P, pH 7.0), and thereby had about 45 μg/l PO4-P. As a background, the [Control] bottle received neither extrinsic acetate nor orthophosphate.
All the sets were placed in a shaking in- cubator at 20℃ and stirred at a speed of 50 rpm for 20 days. Intermittent decanta- tion and feeding were provided at 4-day intervals after the start-up. The 4-day interval indicated one cycle, and each ex- perimental period consisted of 20 days.
For the scheduled decantation and feeding during 20 days, 100 ml of the bulk water sample in the bottle were replaced by the same volume of tap water. For [+P] and [+CP] sets, 100 ml of tap water for in- termittent feeding were spiked with 80 μl of Na2HPO4 solution (500 mg/l PO4-P, pH 7.0). In addition, 3 ml of CH3COONa solu- tion (500 mg/l TOC, pH 7.0) was added to 100 ml of feeding tap water for the [+C]
and [+CP] sets. Parameters including to- tal organic carbon (TOC), orthophosphate, and heterotrophic plate counts (HPC) in bulk water samples were monitored ev- ery 4 days. PE slides were removed from the bottles after 20 days to enumerate the biofilm-forming bacteria.
2.2. Biofilm sampling and analysis
Biofilm formation was evaluated based on the quantification of HPC and biomass. PE slides were aseptically retrieved from the bottle at the end of the experiment, washed gently with sterile distilled water to elimi- nate loosely attached bacteria, and then transferred to a glass tube containing 50 ml of sterile distilled water. The tubes were
Table 1. Characteristics of the tap water used in this study Items n
aAverage Range Water temperature (℃) 42 11.5 8.7–12.5
pH 42 7.02 6.93–7.05
Free chlorine residual
(mg/L) 52 0.10 0.08–0.12
Alkalinity (mg/L as CaCO
3) 42 15.5 12–18 Hardness (mg/l as CaCO
3) 42 30.5 26–32
NH
3-N (mg/l) 42 0.010 0.008–0.012 PO
4-P (mg/l) 42 0.004 0.003–0.006 Total organic carbon (mg/l) 52 0.67 0.60–0.72
Biodegradable dissolved
organic carbon (mg/l) 32 0.08 0.05–0.12 Heterotrophic plate count
(CFU/ml) 42 35 6–58
a Number of measurements
then placed in an ultrasonic cleaning bath (Model 8210, Bransonic) and sonicated for 10 min. Finally, biofilm was scraped manu- ally from surface of the slide using a sterile cell scraper (Becton Dickinson & Co.).
HPCs in biofilm suspensions were an- alyzed based on the spread plate method (9215 C) and/or the membrane filter meth- od (9215 D) described in Standard Methods (APHA, 2005) using R2A agar (Difco Lab- oratories). The membrane filter technique was applied for biofilm samples which were suspected to be unacceptable count (≺ 30 CFU) on the spread plate. R2A agar plates and membrane filters were incubated for 7 days at 25℃ and colonies were counted and averaged from duplicated samples.
For the estimation of biofilm bio- mass, total protein and carbohydrate were summed up and expressed as μg/cm2 (Chandy and Angles, 2001). To perform the carbohydrate assay biofilm suspension was concentrated by centrifugation (4,000 x g, 30 min). The concentrated biomass was then disaggregated by adding 10 ster- ile glass beads (3 mm dia.) and vortexing for 3 min. The amount of carbohydrate in the biofilm extracts was quantified colo- rimetrically at 485 nm (Cary 3 UV/Vis Spectrophotometer, Varian Inc.) using the phenol-sulfuric acid method (AOAC, 1995). Measurements were performed in duplicate, and the carbohydrate concen- tration was calculated from a calibration curve using glucose (Sigma-Aldrich) as a standard. Total protein was measured by coomassie blue protein assay (Stoscheck, 1990) using bovine serum albumin (Sig- ma-Aldrich) as a standard.
2.3. Scanning electron microscopy (SEM) ob- servations
Biofilm-formed PE specimens were fixed in glutaraldehyde solution (2.5%), washed in phosphate-buffered saline and gradu- ally dehydrated in ethanol series from 50%
to 100%. They were then dried at the criti- cal point of carbon dioxide and coated with Pt-Pd. SEM observations (Model S-4300, Hitachi) were documented through the ac- quisition of at least 20 representative mi- crophotographs for each experiment.
2.4. Water analysis
TOC concentrations were measured us- ing a TOC analyzer (Model Phoenix 8000, Tekmar-Dohrmann). Phosphate concen- trations were determined based on the ascorbic acid method (4500-P E) of Stan- dard Methods (APHA, 2005). HPC was de- termined by spread plate method and/or membrane filter method using R2A agar.
The latter was used for a sample which is suspected to be hard to enumerate low count (≺ 10 CFU/mL) by spread plate method. Incubation was performed for 7 days at 25℃ before counting the colonies.
BDOC levels were determined by an as- say that uses bacteria attached to sand (Park et al., 2004). Water qualities such as alkalinity, hardness, ammonia, and free chlorine residuals were analyzed with a titration method using mixed bromocre- sol green-methyl red indicator (2320 B), ethylenediaminetetraacetic acid titrimetric method (2340 C), phenate method (4500- NH3 F), and N,N-diethyl-p-phenylenedi- amine ferrous titrimetric method (4500-
Cl F) of Standard Methods (APHA, 2005), respectively.
3. Results and Discussion
3.1. Bacterial response to the addition of car- bon and phosphorus
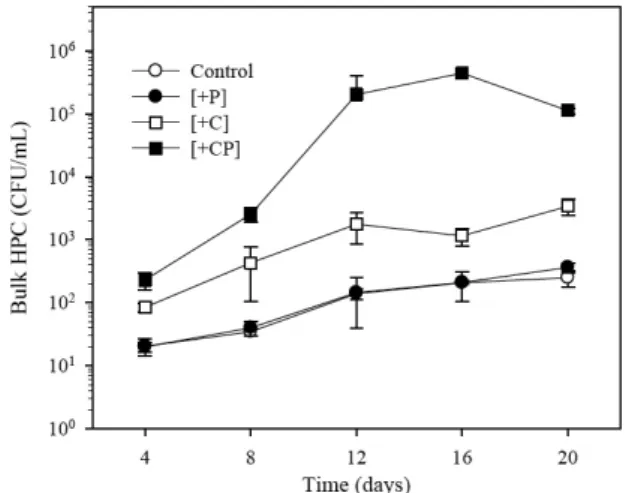
Fig. 2 shows bulk HPC increase in waters supplemented with organic carbon and/or phosphorus under a controlled tempera- ture of 20℃. In the control water, bulk HPC increased by one order of magnitude (from 101 to 102 CFU/ml), which repre- sented the bacterial growth potential of the original tap water. In such tap water supplied through a service reservoir, low free chlorine at or below 0.1 mg/l (Table 1) was deemed insufficient to control bac- terial growth. Bulk HPC increase in [+P]
water to which phosphorus was added was similar to that observed in the con- trol water. Apart from the [+P] water in which HPC increase did not respond to the phosphorus-alone addition, bulk HPC was
stimulated by the carbon-alone addition and further stimulated by the combined addition of carbon and phosphorus (Fig.
2). Bulk HPC levels increased to 103 CFU/
ml and to 105 CFU/ml in [+C] and [+CP]
water, respectively.
Biofilm HPC and biomass formed on PE surfaces were quantified after 20 days, and the results were compared in Fig. 3.
The addition of phosphorus alone [+P]
appeared to have no significant effect on bacterial biofilm growth. However, biofilm HPC and biomass were increased by the addition of carbon alone [+C] and fur- ther increased by the addition of carbon and phosphorus [+CP]. As shown in Fig. 3, biofilm HPC were higher about two orders of magnitude in [+C] water compared to the control and [+P] water. Biofilm bio- mass measured as a sum of carbohydrate and protein is related to the production of extracellular polymeric substance (EPS) which is responsible for keeping biofilm together. Typically, carbohydrate and pro-
Fig. 2. Bulk HPC growth in waters supplemented with organic carbon and/or phosphorus under a controlled temperature of 20 ℃. [Control]: no addition, [+P]: phosphorus alone, [+C]: carbon alone, [+CP]: carbon and phosphorus.
Fig. 3. Biofilm HPC and biomass observed on PE slides im-
mersed in waters with different carbon and phosphorus
levels during 20 days of incubation. [Control]: no addition,
[+P]: phosphorus alone, [+C]: carbon alone, [+CP]: car-
bon and phosphorus.
tein have been identified as the dominant components of EPS (Nielsen et al., 1997;
Flemming and Wingender, 2001). Biofilm EPS production is known to be affected by nutritional conditions; the amount of EPS synthesis depends on the presence of available carbon and on the balance be- tween carbon and other nutrients such as phosphorus (Sutherland, 2001; Don- lan, 2002). This would be a possible rea- son why biofilm biomass significantly in- creased in [+C] and [+CP] water compared to the [Control] and [+P] water.
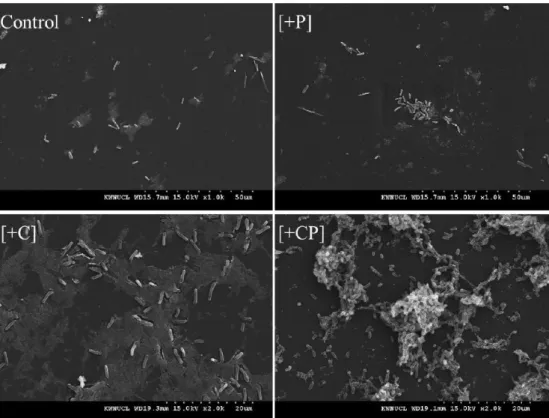
SEM images confirmed bacterial biofilm formation on the surfaces of PE coupons which were immersed in water samples with different carbon and phosphorus levels (Fig. 4). In particular, the presence
of large numbers of slime-encased bac- teria and large cluster of bacterial cells were observed in [+CP] water. Bacterial cells were sparsely distributed, however, on the surfaces exposed to the [Control]
and [+P] water. Upon comparison of the relative sizes of biofilm-forming bacterial cells between [+C] and [+CP] water, cells were larger (about 3 μm) in [+C] water than those (1 ~ 2 μm) in [+CP] water (Fig.
4). This can be explained by the fact that when bacteria are grown with excess car- bon under phosphorus-limited condition, the cells increase in size due to an increase in the amount of capsular material, al- lowing cells to maintain a constant DNA to cell mass ratio during bacterial growth (Wang and Levin, 2009).
Fig. 4. Images of scanning electron microscopy (SEM) of the biofilms formed on PE slides immersed in waters with different carbon and
phosphorus levels. [Control]: no addition, [+P]: phosphorus alone, [+C]: carbon alone, [+CP]: carbon and phosphorus.
It has been reported that phosphorus may influence the growth of bacteria in certain drinking waters, particularly with a relatively high carbon-to-phosphorus ratio and very low phosphorus content (Miettinen et al., 1997; Sathasivan et al., 1997; Sathasivan and Ohgaki, 1999; Leh- tola et al., 2001, 2002a,b). In such cases, bacterial growth in drinking water could be limited by phosphorus instead of organic carbon (Miettinen et al., 1997; Sathasi- van et al., 1997; Sathasivan and Ohgaki, 1999). In our study, however, the growth of heterotrophic bacteria in the bulk water and biofilm did not respond to the addition of phosphorus alone in which BOM was relatively poor (Figs. 2 and 3). These re- sults are not contradictory to the findings of other studies (Rompr
é
et al., 2000; Ap- penzeller et al., 2001; Chandy and Angles, 2001; Batté
et al., 2003b; Batté
et al., 2003c). A significant response in bacte- rial growth to the addition of phosphorus occurred when it was added together with microbially available carbon (Figs. 2 and 3). At least in the tap water used in our work, bacterial growth seemed to be more sensitive to microbially available carbon than phosphorus.3.2. Bacterial consumption of carbon and phos- phorus
During the experimental period, TOC and PO4-P concentrations in bulk water were measured every 4 days, and changes in TOC and PO4-P were observed with the bacterial growth. When carbon consump- tion was estimated for each time period
(4 days), the amount of carbon consumed was within the range of 0 ~ 0.05, 0 ~ 0.05, 0.03 ~ 0.89, and 0.07 ~ 3.64 mg for the [Control], [+P], [+C], and [+CP] wa- ter, respectively. These values account- ed for 0.0 ~ 6.8, 0.0 ~ 7.4, 0.7 ~ 18.7, and 2.0 ~ 78.3% of the amount of car- bon present at the beginning of each time period for the [Control], [+P], [+C], and [+CP], respectively. The amount of phos- phorus consumed for each time period was within the range of 0 ~ 0.22, 0.01 ~ 0.53, 0.17 ~ 1.79, and 6.00 ~ 31.84 μg for the [Control], [+P], [+C], and [+CP] water, respectively. Again these values accounted for 0 ~ 6.3, 0 ~ 1.5, 6.5 ~ 67.4, and 16.1
~ 43.0% of the phosphorus in water at the beginning of each period for the [Control], [+P], [+C], and [+CP] water, respectively.
Fig. 5a shows a cumulative consump- tion of carbon (∆C) in the [Control], [+P], [+C], and [+CP] water. During the entire period (20 days), carbon was consumed by 5.7%, 5.9%, 24.5%, and 79.6% of the total amount of carbon present in the [Control], [+P], [+C], and [+CP] water, respectively.
A highest consumption in carbon occurred in [+CP] water where extrinsic carbon and phosphorus were added together, and fol- lowed by in the order of [+C] ≻ [+P] ≈ [Control] (Fig. 5a). Significant difference in carbon consumption between [+C] (high BOM and low phosphorus) and [+CP] (high BOM and high phosphorus) indicated that when BOM was abundant in drinking water its consumption could be enhanced with an increase in bacterial numbers by the ad- dition of phosphorus. In [+P] water (low BOM and high phosphorus), a little con-
sumption of the added carbon also indicat- ed that the impact of phosphorus addition might be negligible in case available BOM was limited. These results highlighted that there was a balance between carbon and phosphorus consumptions for the effective bacterial regrowth in drinking water.
Fig. 5b shows a cumulative consump- tion of phosphorus (∆P) in the [Control], [+P], [+C], and [+CP] water. Phosphorus was consumed in lesser quantities than carbon for the growth of bacteria. During the entire period (20 days), phosphorus was consumed by 9.1%, 0.9%, 80.0%, and 50.0% of the total amount of phosphorus present in the [Control], [+P], [+C], and
[+CP] water, respectively. Identical to the carbon consumption, a highest consump- tion in phosphorus occurred in [+CP] wa- ter, and followed by in the order of [+C]
≻ [+P] ≻ [Control] water (Fig. 5b). These results indicated that bacterial consump- tion of phosphorus can be enhanced by the presence of microbially available carbon promoting further increase in bacterial growth. Moreover, the carbon alone-add- ed water [+C] stimulated both phosphorus consumption (Fig. 5b) and bacterial growth (Figs. 2 ~ 4) compared to the phospho- rus alone-added water [+P]. Therefore, it should be noted that even low content of phosphorus in tap water (4 μg/l; Table 1) was enough to allow a bacterial regrowth, and thus its consumption could be en- hanced by exogenous addition of carbon.
Based on the cumulative consumption data of carbon and phosphorus (Fig. 5),
∆C/∆P ratios were calculated and the results were shown in Fig. 6. During the first 4 days of experiment, ∆C/∆P ratio
Fig. 5. Cumulative consumption of (a) carbon and (b) phospho- rus in waters with different carbon and phosphorus lev- els. [Control]: no addition, [+P]: phosphorus alone, [+C]:
carbon alone, [+CP]: carbon and phosphorus.
Fig. 6. Ratios of cumulative consumption of carbon to phospho-
rus (∆C/∆P) in waters with different carbon and phospho-
rus levels. [Control]: no addition, [+P]: phosphorus alone,
[+C]: carbon alone, [+CP]: carbon and phosphorus.
was 234:1, 103:1, 232:1, and 38:1 in the [Control], [+P], [+C], and [+CP] water, respectively. After 12 days, with the ex- ception of [+C] water, they approached a constant value; approximately 120:1, 40:1, and 80:1 in the [Control], [+P], and [+CP]
water, respectively (Fig. 6). In the case of [+C] water, however, the ∆C/∆P ratio continue to increase until 20 days, reach- ing about 590:1, which suggested that heterotrophic bacteria had a rather low nutritional requirement for phosphorus.
It was previously reported that the growth of heterotrophic bacteria in drink- ing water distribution system needs carbon and phosphorus in relative proportion of 100 to 1 (LeChevallier et al., 1991). When compared to a typical bacterial growth with a C/P consumption ratio of 100:1, higher C/P ratio means a large consumption of carbon relative to phosphorus, while lower C/P ratio indicates the opposite situation.
In this study, a higher ∆C/∆P consump- tion ratio occurred in the [+C] water, in- dicating a large consumption of carbon with respect to phosphorus. In contrast, a lower ∆C/∆P ratio were observed in the [+P] and [+CP] water, indicating exces- sive phosphorus consumption. Bacteria can store phosphorus in excess as poly- phosphate (Weltin et al., 1996), but their storage capacity may not be so large that it could cover the phosphorus losses due to a reduction in RNA content that prob- ably occur during growth limitation stage (Vrede et al., 2002). On the other hand, it has been shown that phosphorus can be accumulated on EPS-containing biofilm
matrix in varying content of 0.02 ~ 0.05 μg phosphorus per μg biofilm biomass (Park and Hu, 2010). To some extent, the pres- ence of biofilm EPS is therefore thought to contribute to additional phosphorus con- sumption during bacterial growth.
4. Conclusions
Bacterial growth and corresponding consumption of carbon and phosphorus were examined in tap water samples con- taining a very low concentration of free chlorine. The experiments were performed in a fed-batch mode supplemented with organic carbon and/or phosphorus. In the phosphorus alone-added water, there was no significant increase in bacterial growth both in the bulk water and in the biofilm formed on polyethylene (PE) slide sur- faces. However, both bulk bacteria and bacterial biofilm growth were stimulated by the carbon-alone addition and fur- ther stimulated by the combined addition of carbon and phosphorus. In addition to the bacterial growth, additions of organic carbon and/or phosphorus resulted in dif- ferent bacterial carbon-to-phosphorus (C/P) consumption ratios. Compared to a typical bacterial C/P consumption ratio of 100:1, a higher C/P ratio (590:1) occurred in the carbon alone-added water, while a lower ratio (40:1) in phosphorus alone- added water. Comparative value (80:1) of C/P ratio was also observed in the wa- ter where organic carbon and phosphorus were added together.
At the given experimental conditions, bacterial growth was deemed to be more
sensitive to microbially available organ- ic carbon than phosphorus. The effect of phosphorus addition, which resulted in a lower bacterial C/P consumption ratio, seemed to be tightly associated with the presence of microbially available organic carbon. These results suggested that the control of extrinsic carbon influx seemed to be more important to minimize bacterial regrowth in drinking water system, since even low content of phosphorus naturally occurring in drinking water was enough to allow a bacterial growth.
Acknowledgments
This subject was supported by Korea Ministry of Environment as “Projects for Developing Eco-Innovation Technologies (GT-11-G-02-001-3)”.
![Fig. 5b shows a cumulative consump- consump-tion of phosphorus (∆P) in the [Control], [+P], [+C], and [+CP] water](https://thumb-ap.123doks.com/thumbv2/123dokinfo/4703309.506356/9.892.131.419.165.599/fig-shows-cumulative-consump-consump-phosphorus-control-water.webp)
