Original Article
561
Kor J Fish Aquat Sci 45(6),561-569,2012 한수지 45(6), 561-569, 2012
To evaluate the bacteriological water quality in Yongnam-Gwangdo, located in western Jinhae Bay, seawater samples were analyzed using sanitary indicator bacteria at 57 sampling stations. According to survey results from January 2007 to December 2009, the range of the geometric mean and the estimated 90th percentile for coliforms and fecal coliforms in the samples were <1.8-16.5 and 1.8-246.8 MPN/100 mL and <1.8-7.1 and 1.8-74.8 MPN/100 mL, respectively. The samples, including those taken from stations located in Wonmunman, Gwangdo, and Dangdong, showed high levels of microbial contamination caused by the climate and weather patterns in the marine environment. The bacteriological water quality in the area met Korean criteria for a designated shellf ish growing area for export and National Shellf ish Sanitation Program criteria for an approved shellf ish growing area, except at station #49. A total of 24 direct pollution sources were discharged into the shellf ish growing area.
The radius of impact was calculated for each pollution source to assess the effect on the shellfish growing area.
The calculated radius of impact for most of the pollution sources was below 300 m. However, the radius of impact for the combined pollution sources in Kyeonnaeryang was 93-1973 m. There were signif icant differences between the calculated closed sea area and actual monitoring results. The closed sea area values calculated from the fecal coliform load in drainage water tended to be higher than the actual monitoring results. Tidal currents and environmental factors such as salinity, water temperature, sunlight, and microbiological factors affect the survival of fecal indicator bacteria in seawater.
Key words: Shellfish growing area, The estimated 90th percentile, Coliform group, Fecal coliform, Yongnam- Gwangdo area
Article history;
Received 5 September 2012; Revised 14 November 2012; Accepted 26 November 2012
*Corresponding author: Tel: +82. 51. 720. 2671 Fax: +82. 51. 720. 2669 E-mail address: [email protected]
Kor J Fish Aquat Sci 45(6) 561-569, December 2012 http://dx.doi.org/10.5657/KFAS.2012.0561 pISSN:0374-8111, eISSN:2287-8815
ⓒ The Korean Society of Fishereis and Aquatic Science. All rights reserved
진해만 서부 용남·광도해역의 세균학적 수질에 미치는 육상 오염원의 영향
국립수산과학원 식품안전과, 1국립수산과학원 남동해수산연구소, 2국립수산과학원 남서해수산연구소
Kil Bo Shim*, Kwang Soo Ha1, Hyun Duk Yoo1, Tae Seek Lee2 and Ji Hoe Kim 심길보*ㆍ하광수1ㆍ유현덕1ㆍ이태식2ㆍ김지회
Impact of Pollution Sources on the Bacteriological Water Quality in the Yongnam-Gwangdo Shellf ish Growing Area
of Western Jinhae Bay, Korea
Food & Safety Research Division, National Fisheries Research & Development Institute, Busan 619-705, Korea
1Southeast Sea Fisheries Research Institute, National Fisheries Research & Development Institute, Tongyoung 650-943, Korea
2Southwest Sea Fisheries Research Institute, National Fisheries Research & Development Institute, Yeosu 556-823, Korea
서 론
정착성의패류는서식하는부유생물을여과섭취하여영양 분을공급받는다. 이에따라연안해역에서식하는패류는식 물플랑크톤등먹이생물뿐만 아니라인체에유해한세균이 나바이러스등도쉽게축적할수있다(Potasman et al., 2002;
Feldhusen, 2000; Cliver, 1997; Grimes, 1991). 패류를매개
로인체에해를끼치는미생물에는병원성비브리오와같이해 양에서자연적으로발생하는것도있지만많은종의세균이나 바이러스는육상온혈동물의분변에서유래한다. 연안산패류 의위생안전성확보를위해서는생산해역의위생관리가무엇 보다중요하며, 이를위해서는배수유역내오염원의평가, 해 역내해수및패류의위생상태의지속적인모니터링, 오염원 과생산해역의종합적평가를통해생산해역의적정한분류가
심길보·하광수·유현덕·이태식·김지회 562
동시에이루어져야한다(Todd and Campbell, 2002). 이처럼 생산해역에대한위생조사는당해해역에서생산되는수산물 이인체건강에해를끼칠수있는요인들을평가하는수단이 며, 수산물의안전성제고와소비자의신뢰성확보를위한효 율적인위생관리방안이다(Rees et al., 2010). 미국과유럽연 합에서는해수나서식수산물중의대장균을비롯한위생지표 세균의오염정도를평가하여수산물생산해역을관리하고있 다(US FDA, 2008; European Communities, 2004). 미국은패 류생산해역을크게허가해역, 조건부허가해역, 제한해역, 조 건부제한해역, 금지해역으로구분하여관리하고있다. 유럽연 합에서는패류중의대장균(Esherichia coli) 수에따라 A, B, C 해역으로구분된다. A 등급해역은생식할수있는패류의생산 이가능한해역, B 등급해역은정화처리후위생기준에부합 하는패류생산이가능한해역, C 등급해역은생산된패류는 2 개월이상장기자연정화를거친후위생기준에합당할때판 매할수있다. 우리나라에서도수출을목적으로하는패류양식
장에대하여 1960년대부터위생관리를실시하고있으며(Kim,
1975), 조사해역중미국이나유럽연합의패류생산해역위생
기준에부합하는해역에대해서는수출용패류생산지정해역( 이하 ‘지정해역’)으로관리하고있다(농림수산식품부고시제
2009-298호). 그러나최근우리나라연안해역에서생산되는
패류의안전성에대한중요성도대두되면서, 안전한수산물공 급을위한연안해역에대한위생조사가지속적으로이루어지 고있다.
우리나라굴의총생산량은 2011년 281,022톤이었으며, 통 영등남해안지역에서 80% 이상이생산되고있다(MIFAFF, 2012). 특히경상남도거제시, 통영시, 고성군에걸쳐있는진 해만서부의용남·광도해역은굴생산량이많은지역으로총 91건(566.36 ha)의양식어업권중 49건(245.33 ha)이굴양식 업이차지하고있다. 그러나동해역은 대단위아파트단지등 인구밀집지역이조성되었으며, 조선소, 액화천연가스생산기 지등의시설이있는안정일반산업단지가위치하고있다. 이러 한육상오염원은생산수산물의위생안정성에영향을미칠수 있다고보고된바있다(Ha et al., 2011; Lee et al., 2010; Shim et al., 2009; Song et al., 2008).
따라서본연구에서는우리나라에서굴생산량이많은연안 해역인진해만서부지역에위치한용남·광도해역의위생학적 상태를평가하고, 동해역의위생상태에육상오염원이미치는 영향을조사함으로써우리나라수산물의위생안전성확보를 위한기초자료로활용하고자하였다.
재료 및 방법 조사지점 및 시료채취
조사해역은경상남도진해만서부에위치하고있으며, 북쪽 으로는고성군거류면과동해면, 서쪽과남쪽은통영시광도면
과용남면, 동쪽은거제시사등면과접하고있으며, 수역면적 은약 96.3 km2이다 (Fig. 1).
해수시료채취지점은조사해역의지형적여건, 해류유동, 배수유역내오염원의분포등을고려하여 57개소설정하였으 며, 2007년 1월부터 2009년 12월까지매월 1회씩총 36회에 걸쳐시료를채취하였다. 해수는표층채수기를사용하여수면 에서약 10 cm 깊이에서멸균된 250 mL 유리병에채수한다
음, 10℃ 이하로유지하여실험실로운반한후즉시실험에사
용하였다. 실험방법
해수의염분은현장용수질분석기(YSI 556, YSI Life Sci-
ence, USA)를사용하여측정하였으며, 위생지표세균인대장
균군및분변계대장균은 Recommended Procedures for the Sea Water and Shellfish (APHA, 1970)에따라시험하였다. 시료를단계희석하여 5개시험관법으로측정하였으며, 추정 시험배지로는 Lauryl Tryptose Broth (Difco, USA), 확정시 험배지로는 Brilliant Green Lactose Bile Broth 2% (BGLB, Difco, USA)와 EC (Difco, USA) 배지를각각사용하였다. 위 생지표세균수는 100mL 당최확수(Most Probable Number, MPN)로표시하였다.
해수의 위생학적 평가
해수의위생상태는우리나라수출용패류생산해역의위생관 리기준(농식품부고시제2011-97호)과미국의패류양식장에
대한세균학적수질기준(US FDA, 2008)에준하여평가하였
으며, the estimated 90th percentile 값(계산된 90th 값)은다음 과같은방법으로계산하였다.
Est 90th = Antilog [(Slog)1.28 + Xlog]
Slog = 각자료그룹에서의각각의 MPN의대수값의표준편차 Xlog = 각자료그룹에서의각각의 MPN의대수값의평균 군집구조 분석
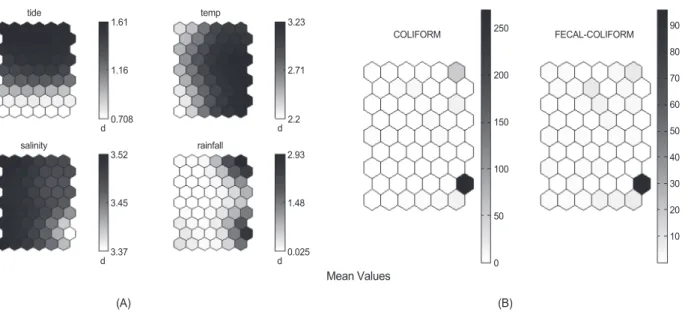
각조사지점에강우, 수온, 염분함량이위생지표세균농도에 미치는영향을분석하기위하여 Lim (2007) 방법에제시한군 집구조개념을도입하였다. 각지점별로 3년간강우, 수온, 염 분함량, 대장균군, 분변계대장균값을이용한군집분석을통 하여지점별로그룹화된값을각셀로표시하였다. 육상오염원이 해역에 미치는 영향 평가
동해역의배수유역에위치하고있는육상오염원중해역으 로하수등이직접유입되는오염원에대해서는유량과분변계 대장균농도를분석한후 1일간해역으로유입되는총분변계 대장균수를산출하였다. 산출된분변계대장균을최종농도 14
MPN/100 mL 이하로희석하는데필요한해수의용적을산출
용남·광도해역 패류양식장 위생안전성 평가 563
Station
Coliform group (MPN/100 mL)
0 20 40 60 80 100
HPL (MPN/100 mL)
0 100 200 300 400 500 600 700 800 900 10001500 2000
128˚25´30˝E 128˚29´30˝E 128˚31´30˝E
34˚53´30˝N34˚55´30˝N34˚57´30˝N
E D
C B
F
G A
34˚59´30˝N34˚61´30˝N
128˚27´30˝E
1 2
A
3 4 5 6 7 8 9 10 11 12
Station
Coliform group (MPN/100 mL) HPL (MPN/100 mL)
0 100 200 300 400 500 600 700 800 900 10001500 2000 Geometric mean
90th percentile HPL (Highest Pollution Level)
13 14
B
15 16 17 18 19 20 21
Station
Coliform group (MPN/100 mL)
0 20 40 60 80 100
0 20 40 60 80 100
0 20 40 60 80 100
HPL (MPN/100 mL)
0 100 200 300 400 500 600 700 800 900 10001500 2000
22 23
C
24 25 26 27 28 29 30 31 32
Station
Coliform group (MPN/100 mL) HPL (MPN/100 mL)
0 100 200 300 400 500 600 700 800 900 10001500 2000
33 34
D
35 36 37 38
Station
Coliform group (MPN/100 mL)
0 20 40 60 80 100
HPL (MPN/100 mL)
0 100 200 300 400 500 600 700 800 900 10001500 2000
39 40 41 42 43 44 45
E
Station
Coliform group (MPN/100 mL)
0 20 40 60 80 100200 250300
HPL (MPN/100 mL)
0 100 200 300 400 500 600 700 800 900 10001500 2000
46 47
F
48 49 50 51 52 53
Station
Coliform group (MPN/100 mL)
0 20 40 60 80 100
HPL (MPN/100 mL)
0 100 200 300 400 500 600 700 800 900 10001500 2000
54 55
G
56 57
Station
Fecal coliform (MPN/100 mL)
0 20 40 60 80 100
HPL (MPN/100 mL)
0 100 200 300 400 500 600 700 800 900 10001500
A 2000
1 2 3 4 5 6 7 8 9 10 11 12
Station
Fecal coliform (MPN/100 mL)
0 20 40 60 80 100
HPL (MPN/100 mL)
0 100 200 300 400 500 600 700 800 900 10001500
B 2000
13 14 15 16 17 18 19 20 21
Station
Fecal coliform (MPN/100 mL)
0 20 40 60 80 100
HPL (MPN/100 mL)
0 100 200 300 400 500 600 700 800 900 10001500
C 2000
22 23 24 25 26 27 28 29 30 31 32
Station
Fecal coliform (MPN/100 mL)
0 20 40 60 80 100
HPL (MPN/100 mL)
0 100 200 300 400 500 600 700 800 900 10001500
D 2000
33 34 35 36 37 38
Station
Fecal coliform (MPN/100 mL)
0 20 40 60 80 100
HPL (MPN/100 mL)
0 100 200 300 400 500 600 700 800 900 10001500 2000
39 40 41 42 43 44 45
E
Station
Fecal coliform (MPN/100 mL)
0 20 40 60 80 100
HPL (MPN/100 mL)
0 100 200 300 400 500 600 700 800 900 10001500
F 2000
46 47 48 49 50 51 52 53
Station
Fecal coliform (MPN/100 mL)
0 20 40 60 80 100
HPL (MPN/100 mL)
0 100 200 300 400 500 600 700 800 900 10001500
G 2000
54 55 56 57
Geometric mean 90th percentile HPL (Highest Pollution Level)
Geometric mean 90th percentile HPL (Highest Pollution Level)
Geometric mean 90th percentile HPL (Highest Pollution Level)
Geometric mean 90th percentile HPL (Highest Pollution Level)
Geometric mean 90th percentile HPL (Highest Pollution Level)
Geometric mean 90th percentile HPL (Highest Pollution Level)
Geometric mean 90th percentile HPL (Highest Pollution Level)
Geometric mean 90th percentile HPL (Highest Pollution Level)
Geometric mean 90th percentile HPL (Highest Pollution Level)
Geometric mean 90th percentile HPL (Highest Pollution Level)
Geometric mean 90th percentile HPL (Highest Pollution Level)
Geometric mean 90th percentile HPL (Highest Pollution Level)
Geometric mean 90th percentile HPL (Highest Pollution Level)
tide 1.61
1.16
0.708 d
temp
COLIFORM
Mean Values
(A) (B)
3.23 250
200
150
100
50
0
FECAL-COLIFORM
10 20 30 40 50 60 70 80 90
2.71
d 2.2 salinity
3.52
3.45
d3.37
rainfall
2.93
1.48
0.025 d
128˚25´30˝E 128˚29´30˝E 128˚31´30˝E
34˚53´30˝N34˚55´30˝N34˚57´30˝N34˚59´30˝N34˚61´30˝N
128˚27´30˝E
Fig. 1. Sampling station of Yongnam-Gwangdo area, located Western Jinhae bay, Korea. A, Kyeonnaeryang area (St. 1-12); B, Gajo area(St. 13-21); C, Jido area (St. 22-32); D, Dangdongman area (St. 33-38); E, Anjeong area (St. 39-45); F, Wonmunman area (St. 46- 53); G, Yongnam area (St. 54-57).
하고, 유입점주변의평균해수수심등을활용하여수면적을 계산하여각오염원이해역에미치는영향범위를산출하였다 (US FDA, 2008). Ha et al. (2011) 이보고한바와같이, 적용 된수심은해도를활용하여영향범위에따라간조시의최저수 심과평균수심을적용하였다.
▣ Determined loading (MPN/day)=Concentration of fecal coliform (MPN/100 mL)×Conversion factor (Liter to milliliter; 1,000 mL/L)×Conversion factor (Min per day;
1,440 min/day)×Flow (L/min)
▣ Dilution water required (m3/day)=Determined loading (MPN/day) / [Standard (14 MPN/100 mL)×Conversion factor (Milliliter to m3; 100,000 mL/m3)]
▣ Area required (m2/day)=Dilution water required (m3/day) / Average depth (m)
결과 및 고찰 해수 조사지점별의 위생지표세균 농도
경남진해만서부용남·광도해역의지형적여건, 해류유동,
배수유역내오염원의분포등을고려하여 7개의소해역으로 구분하였다. 동해역의남동쪽에위치하고있는 거제시사등 면인근해역(이하 ‘견내량해역’, 조사지점 1-12), 해역의동쪽 에위치하고있는가조도인근해역(이하 ‘가조도해역’, 조사지 점 13-21), 지도, 어의도, 수도의도서지역인근해역(이하 ‘지 도해역’, 조사지점 22-32), 해역의북쪽에위치하고있는고성 군동해면, 거류면인근해역(이하 ‘당동만해역’, 조사지점 33- 38), 해역서쪽의안정공단인근해역(이하 ‘안정해역’, 조사지
점 39-43), 해역남서방향의인구밀집지역인통영시광도면
(이하 ‘원문만해역’ 조사지점 45-53), 해역남쪽의통영시용 남면인근해역(이하 ‘용남해역’ 조사지점 54-57)이다. 이들해 역에설정된조사지점에대하여 2007년 1월부터 2009년 12 월까지 3년간조사한각조사지점별대장균군및분변계대장 균수의최대값, 기하평균및 90 th percentile값을 Fig. 2와 3에 나타내었다. 전체조사지점의해수시료중대장균군수의범 위는 <1.8~>1,600 MPN/100 mL이었으며, 기하학적평균치 및 90th percentile의범위는각각 <1.8-16.5 MPN/100 mL 및 1.8-246.8 MPN/100 mL이었다.
견내량해역은오량천하구인근에위치하고있는 2번조사 지점에서 대장균군의최대값과 90th percentile의값이각각
심길보·하광수·유현덕·이태식·김지회 564
Station
Coliform group (MPN/100 mL)
0 20 40 60 80 100
HPL (MPN/100 mL)
0 100 200 300 400 500 600 700 800 900 10001500 2000
128˚25´30˝E 128˚29´30˝E 128˚31´30˝E
34˚53´30˝N34˚55´30˝N34˚57´30˝N
E D
C B
F
G A
34˚59´30˝N34˚61´30˝N
128˚27´30˝E
1 2
A
3 4 5 6 7 8 9 10 11 12
Station
Coliform group (MPN/100 mL) HPL (MPN/100 mL)
0 100 200 300 400 500 600 700 800 900 10001500 2000 Geometric mean
90th percentile HPL (Highest Pollution Level)
13 14
B
15 16 17 18 19 20 21
Station
Coliform group (MPN/100 mL)
0 20 40 60 80 100
0 20 40 60 80 100
0 20 40 60 80 100
HPL (MPN/100 mL)
0 100 200 300 400 500 600 700 800 900 10001500 2000
22 23
C
24 25 26 27 28 29 30 31 32
Station
Coliform group (MPN/100 mL) HPL (MPN/100 mL)
0 100 200 300 400 500 600 700 800 900 10001500 2000
33 34
D
35 36 37 38
Station
Coliform group (MPN/100 mL)
0 20 40 60 80 100
HPL (MPN/100 mL)
0 100 200 300 400 500 600 700 800 900 10001500 2000
39 40 41 42 43 44 45
E
Station
Coliform group (MPN/100 mL)
0 20 40 60 80 100200 250300
HPL (MPN/100 mL)
0 100 200 300 400 500 600 700 800 900 10001500 2000
46 47
F
48 49 50 51 52 53
Station
Coliform group (MPN/100 mL)
0 20 40 60 80 100
HPL (MPN/100 mL)
0 100 200 300 400 500 600 700 800 900 10001500 2000
54 55
G
56 57
Station
Fecal coliform (MPN/100 mL)
0 20 40 60 80 100
HPL (MPN/100 mL)
0 100 200 300 400 500 600 700 800 900 10001500
A 2000
1 2 3 4 5 6 7 8 9 10 11 12
Station
Fecal coliform (MPN/100 mL)
0 20 40 60 80 100
HPL (MPN/100 mL)
0 100 200 300 400 500 600 700 800 900 10001500
B 2000
13 14 15 16 17 18 19 20 21
Station
Fecal coliform (MPN/100 mL)
0 20 40 60 80 100
HPL (MPN/100 mL)
0 100 200 300 400 500 600 700 800 900 10001500
C 2000
22 23 24 25 26 27 28 29 30 31 32
Station
Fecal coliform (MPN/100 mL)
0 20 40 60 80 100
HPL (MPN/100 mL)
0 100 200 300 400 500 600 700 800 900 10001500
D 2000
33 34 35 36 37 38
Station
Fecal coliform (MPN/100 mL)
0 20 40 60 80 100
HPL (MPN/100 mL)
0 100 200 300 400 500 600 700 800 900 10001500 2000
39 40 41 42 43 44 45
E
Station
Fecal coliform (MPN/100 mL)
0 20 40 60 80 100
HPL (MPN/100 mL)
0 100 200 300 400 500 600 700 800 900 10001500
F 2000
46 47 48 49 50 51 52 53
Station
Fecal coliform (MPN/100 mL)
0 20 40 60 80 100
HPL (MPN/100 mL)
0 100 200 300 400 500 600 700 800 900 10001500
G 2000
54 55 56 57
Geometric mean 90th percentile HPL (Highest Pollution Level)
Geometric mean 90th percentile HPL (Highest Pollution Level)
Geometric mean 90th percentile HPL (Highest Pollution Level)
Geometric mean 90th percentile HPL (Highest Pollution Level)
Geometric mean 90th percentile HPL (Highest Pollution Level)
Geometric mean 90th percentile HPL (Highest Pollution Level)
Geometric mean 90th percentile HPL (Highest Pollution Level)
Geometric mean 90th percentile HPL (Highest Pollution Level)
Geometric mean 90th percentile HPL (Highest Pollution Level)
Geometric mean 90th percentile HPL (Highest Pollution Level)
Geometric mean 90th percentile HPL (Highest Pollution Level)
Geometric mean 90th percentile HPL (Highest Pollution Level)
Geometric mean 90th percentile HPL (Highest Pollution Level)
tide 1.61
1.16
0.708 d
temp
COLIFORM
Mean Values
(A) (B)
3.23 250
200
150
100
50
0
FECAL-COLIFORM
10 20 30 40 50 60 70 80 90
2.71
d 2.2 salinity
3.52
3.45
d3.37
rainfall
2.93
1.48
0.025 d
128˚25´30˝E 128˚29´30˝E 128˚31´30˝E
34˚53´30˝N34˚55´30˝N34˚57´30˝N34˚59´30˝N34˚61´30˝N
128˚27´30˝E
Fig. 2. The geometric mean, estimated 90th percentile and highest pollution level of coliform group of seawater collected at the each station in Youngnam-Gwangdo area located in western of Jinhae bay, Korea from Jan. 2007 to Dec. 2009. The areas are the same as indicated in Fig. 1.
용남·광도해역 패류양식장 위생안전성 평가 565
Station
Coliform group (MPN/100 mL)
0 20 40 60 80 100
HPL (MPN/100 mL)
0 100 200 300 400 500 600 700 800 900 10001500 2000
128˚25´30˝E 128˚29´30˝E 128˚31´30˝E
34˚53´30˝N34˚55´30˝N34˚57´30˝N
E D
C B
F
G A
34˚59´30˝N34˚61´30˝N
128˚27´30˝E
1 2
A
3 4 5 6 7 8 9 10 11 12
Station
Coliform group (MPN/100 mL) HPL (MPN/100 mL)
0 100 200 300 400 500 600 700 800 900 10001500 2000 Geometric mean
90th percentile HPL (Highest Pollution Level)
13 14
B
15 16 17 18 19 20 21
Station
Coliform group (MPN/100 mL)
0 20 40 60 80 100
0 20 40 60 80 100
0 20 40 60 80 100
HPL (MPN/100 mL)
0 100 200 300 400 500 600 700 800 900 10001500 2000
22 23
C
24 25 26 27 28 29 30 31 32
Station
Coliform group (MPN/100 mL) HPL (MPN/100 mL)
0 100 200 300 400 500 600 700 800 900 10001500 2000
33 34
D
35 36 37 38
Station
Coliform group (MPN/100 mL)
0 20 40 60 80 100
HPL (MPN/100 mL)
0 100 200 300 400 500 600 700 800 900 10001500 2000
39 40 41 42 43 44 45
E
Station
Coliform group (MPN/100 mL)
0 20 40 60 80 100200 250300
HPL (MPN/100 mL)
0 100 200 300 400 500 600 700 800 900 10001500 2000
46 47
F
48 49 50 51 52 53
Station
Coliform group (MPN/100 mL)
0 20 40 60 80 100
HPL (MPN/100 mL)
0 100 200 300 400 500 600 700 800 900 10001500 2000
54 55
G
56 57
Station
Fecal coliform (MPN/100 mL)
0 20 40 60 80 100
HPL (MPN/100 mL)
0 100 200 300 400 500 600 700 800 900 10001500
A 2000
1 2 3 4 5 6 7 8 9 10 11 12
Station
Fecal coliform (MPN/100 mL)
0 20 40 60 80 100
HPL (MPN/100 mL)
0 100 200 300 400 500 600 700 800 900 10001500
B 2000
13 14 15 16 17 18 19 20 21
Station
Fecal coliform (MPN/100 mL)
0 20 40 60 80 100
HPL (MPN/100 mL)
0 100 200 300 400 500 600 700 800 900 10001500
C 2000
22 23 24 25 26 27 28 29 30 31 32
Station
Fecal coliform (MPN/100 mL)
0 20 40 60 80 100
HPL (MPN/100 mL)
0 100 200 300 400 500 600 700 800 900 10001500
D 2000
33 34 35 36 37 38
Station
Fecal coliform (MPN/100 mL)
0 20 40 60 80 100
HPL (MPN/100 mL)
0 100 200 300 400 500 600 700 800 900 10001500 2000
39 40 41 42 43 44 45
E
Station
Fecal coliform (MPN/100 mL)
0 20 40 60 80 100
HPL (MPN/100 mL)
0 100 200 300 400 500 600 700 800 900 10001500
F 2000
46 47 48 49 50 51 52 53
Station
Fecal coliform (MPN/100 mL)
0 20 40 60 80 100
HPL (MPN/100 mL)
0 100 200 300 400 500 600 700 800 900 10001500
G 2000
54 55 56 57
Geometric mean 90th percentile HPL (Highest Pollution Level)
Geometric mean 90th percentile HPL (Highest Pollution Level)
Geometric mean 90th percentile HPL (Highest Pollution Level)
Geometric mean 90th percentile HPL (Highest Pollution Level)
Geometric mean 90th percentile HPL (Highest Pollution Level)
Geometric mean 90th percentile HPL (Highest Pollution Level)
Geometric mean 90th percentile HPL (Highest Pollution Level)
Geometric mean 90th percentile HPL (Highest Pollution Level)
Geometric mean 90th percentile HPL (Highest Pollution Level)
Geometric mean 90th percentile HPL (Highest Pollution Level)
Geometric mean 90th percentile HPL (Highest Pollution Level)
Geometric mean 90th percentile HPL (Highest Pollution Level)
Geometric mean 90th percentile HPL (Highest Pollution Level)
tide 1.61
1.16
0.708 d
temp
COLIFORM
Mean Values
(A) (B)
3.23 250
200
150
100
50
0
FECAL-COLIFORM
10 20 30 40 50 60 70 80 90
2.71
d2.2 salinity
3.52
3.45
d 3.37
rainfall
2.93
1.48
0.025 d
128˚25´30˝E 128˚29´30˝E 128˚31´30˝E
34˚53´30˝N34˚55´30˝N34˚57´30˝N34˚59´30˝N34˚61´30˝N
128˚27´30˝E
Fig. 3. The geometric mean, estimated 90th percentile and highest pollution level of fecal coliform of seawater collected at the each station in Youngnam-Gwangdo area located in western of Jinhae bay, Korea from Jan. 2007 to Dec. 2009. The areas are the same as indicated in Fig. 1.