510
Copyright © 2018 The Korean Society of Fisheries and Aquatic Science pISSN:0374-8111, eISSN:2287-8815
서 론
해조류는 크게 미세조류와 거대조류로 구분한다
.
미세조류(phytoplankton)
는단세포성식물로현미경으로만관찰이가능 하고뿌리,
줄기,
잎등의구조가없고,
거대조류(seaweed)
는육 안으로관찰할수있는다세포성식물로광합성색소에따라 홍조류(red seaweed),
녹조류(green seaweed),
갈조류(brown
seaweed)
로나눠지며서식환경및구성성분에서도육안으로차이를보인다
(Lee, 2013).
해조류중에서대표적으로홍조류 인김은우리나라외에도일본,
중국,
대만,
등일부아시아국 가에서양식되고있다.
국내에서 김은12
월-
익년3
월에주로 서남해안에서양식형태로생산되어미국,
중국,
일본등에주로수출되고있으며
,
주요종은방사무늬김(Pyropia yezoensis Ueda),
참김(P. tenera Kjellman),
모무늬돌김(P. seriata Kjell- man),
잇바디돌김(P. dentate Kjellman)
등이있다(Kwon et al., 2018).
국내김산업중김양식업의경우점차대규모화되고있으며
,
양식생산성은높아지고있다.
또한국내김가공산업의현황은 과거마른김중심의가공에서소비시장이조미김중심으로변 화되면서조미김가공이증가하고있다.
특히,
해외수출로인 하여저칼로리건강스낵으로인기를끌면서2017
년김수출액 은5
억달러를돌파했다(MOF, 2017).
한편
,
마른김및조미김에대한연구로는물김원초의일반성 분및기타미량성분에대한연구로는국내가공해조류와물물김(Pyropia sp.)의 생산 시기별 및 지역별 주요 식품 성분 변화 분석
강민균·정민철·박슬기·이장원·조정형
1·엄성환
2·허만규
2·김영목*
부경대학교 식품공학과, 1부경대학교 공업디자인학과, 2동의대학교 식품공학과
Analysis of Seasonal and Regional Changes in Major Food Components of Raw Laver Pyropia sp.
Min-Gyun Kang, Min-Chul Jeong, Seul-Ki Park, Jang-Won Lee, Jeung-Hyung Cho
1
, Sung-Hwan Eom2
, Man-Kyu Huh2
and Young-Mog Kim*Department of Food Science and Technology, Pukyong National University, Busan 48513, Korea
1Department of Industrial Design, Pukyong University, Busan 48513, Korea
2Department of Food Science and Technology, Dongeui University, Busan 47340, Korea
The study investigated the seasonal and regional changes in the food components of raw laver Pyropia sp . . Samples were obtained monthly from December 2017 to March 2018 at auction markets located in Gangseo-gu, Busan (Na- kdong-raw laver), Seocheon-gun, Chungnam, Wando-gun, Jeonnam and Goheung-gun, Jeonnam. The general com- ponents, heavy metals and minerals, free amino acids, total phenolic compounds (TPC), and antioxidant activities of the samples were analyzed. No significant physicochemical changes in the moisture, crude lipid, and ash contents were observed in the raw lavers tested. However, the crude protein content of Nakdong-raw laver was the highest in December 2017 at 7.20±0.28% and the content was higher seasonally and regionally than those of the other raw lavers. In addition, the taurine, zinc, manganese and TPC contents of Nakdong-raw laver was higher seasonally and regionally than those of the other raw lavers. The ethanolic extract of Nakdong-raw laver also had higher antioxi- dant activity, including as DPPH (2,2'-diphenyl-1-picrylhydrazyl) and ABTS (2,2'-azino-bis [3-ethylbenzothiazoline- 6-sulphonic acid]) radical scavenging activity, although there was no significant correlation between TPC and the antioxidant activity. This study is the first analysis of seasonal and regional changes in the major food components of raw laver cultivated in Korea.
Key words: Bioactive compound, Food components, Raw laver, Regional changes, Seasonal changes
This is an Open Access article distributed under the terms of the Creative Commons Attribution Non-Commercial Licens (http://creativecommons.org/licenses/by-nc/3.0/) which permits unrestricted non-commercial use, distribution, and reproduction in any medium, provided the original work is properly cited.
https://doi.org/10.5657/KFAS.2018.0510 Korean J Fish Aquat Sci 51(5), 510-517, October 2018
Received 16 August 2018; Revised 14 September 2018; Accepted 19 September 2018
*Corresponding author: Tel: +82. 51. 629. 5832 Fax: +82. 51. 629. 5824
E-mail address: [email protected]
김의중금속함량및식품안전성평가
(Yang et al., 2016),
국 내산김(Pyropia tenera),
다시마(Saccharina japonicas),
미역(Undaria pinnatifida).
톳(Sargassum fusiforme)
의 생산지역 별따른미네랄함량분석및영양평가(Jung et al., 2017),
원산 지별김의일반성분및무기질,
아미노산함량비교(Jung et al., 2016),
김추출물의이화학적특성(Hong et al., 1997),
한국연 안산방사무늬김(Pyropia yezoensis)
의일반성분및미네랄함 량(Mok el al., 2011)
등의많은연구가진행되어왔다.
그러나 물김원초에대한일반성분,
기타미량성분에대한연구는부 족한실정이다.
따라서본연구에서는생산시기별및지역별물김원초를대 상으로일반성분
,
중금속및미량원소,
유리아미노산,
총페놀 성화합물분석및항산화활성을측정하여각생산시기별및 지역별물김원초의성분을평가하고자하였다.
또한앞으로의 물김원초의성분함량연구및수산자원개발을위한기초자료 로제공하고자한다.
재료 및 방법
재료
본실험에사용된물김원초는대표적인물김산지인부산강 서구
(
이하낙동김),
충남서천군(
이하서천김),
전남완도군(
이 하완도김),
전남고흥군(
이하고흥김)
에위치한위·
공판장에서12
월부터3
월까지월별1
회샘플을채취하여분석하였다.
분 석에사용된물김원초는필요시동결건조하여-70℃
에보관 하였다.
식품학적 일반 성분 분석
물김의일반 성분은
AOAC (2005)
또는식품공전(MFDS, 2018)
에따라측정하였다.
수분함량은105℃
상압가열건조 법에따라측정하였고(AOAC, 2005),
회분함량은550℃
고 온 회화법에따라측정하였고(AOAC, 2005),
조단백질함량 은시료의전처리및추출과정을거쳐서조단백질추출자동장 치(KjelFlex K-360; Buchi, Flawil, Switzerland)
를 이용하여Semimicro Kjeldahl
법에따라측정하였고(MFDS, 2018),
조 지방은n-hexane (Duksan Chemical Co., Yongin, Korea)
을용 매로Soxhlet
추출장치(Buchi extraction unit E-812; Buchi, Flawil, Switzerland)
를이용하여Soxhlet
추출법에따라측정하 였다(MFDS, 2018).
중금속 및 미량 성분 함량
중금속으로는수은
(Hg),
납(Pb)
및카드뮴(Cd)
을미량성분 으로는셀레늄(Se),
망간(Mn),
아연(Zn),
니켈(Ni)
및철(Fe)
을 분석하였다.
납(Pb),
카드뮴(Cd),
셀레늄(Se),
망간(Mn),
아연(Zn),
니켈(Ni)
및철(Fe)
은유도결합플라즈마질량분석기를 이용하여분석하였으며,
수은(Hg)
의경우gold-amalgam
법으Table 1. Physicochemical contents of raw laver Pyropia sp. according to production region and season in Korea (December 2017-March 2018)
Region Month Moisture (%) Crude protein (%) Crude lipid (%) Ash (%)
Gangseo-gu, Busan
December 86.09±1.91ab 7.20±0.28a 0.15±0.02a 4.10±0.04a January 86.65±0.01c 6.08±0.13a 0.13±0.01c 3.77±0.01c February 86.48±0.17d 4.26±0.12a 0.06±0.01ab 3.68±0.01a
March 88.43±0.02a 5.45±0.18a 0.05±0.02b 2.92±0.04b
Seocheon-gun, Chungnam
December 86.83±0.61ab 5.11±0.09b 0.16±0.02a 3.36±0.15b January 89.05±0.12a 3.92±0.03c 0.12±0.00c 3.85±0.00b February 91.55±0.13a 3.51±0.06ab 0.04±0.01b 3.24±0.09c March 87.47±0.08b 3.82±0.07c 0.06±0.00ab 4.06±0.63a
Wando-gun, Jeonnam
December 85.18±0.10b 4.66±0.25c 0.17±0.01a 3.14±0.06c January 89.32±0.41a 4.66±0.13b 0.25±0.00a 3.93±0.03a February 90.76±0.23b 3.34±0.27b 0.06±0.02ab 3.46±0.01b March 86.83±0.60b 4.98±0.09b 0.06±0.01ab 3.59±0.00ab
Goheung-gun, Jeonnam
December 88.11±0.14a 4.27±0.01c 0.10±0.01b 3.35±0.02b January 88.21±0.51b 3.92±0.03c 0.16±0.01b 3.70±0.02d February 89.16±0.32c 4.25±0.64a 0.08±0.01a 3.50±0.01b
March 89.01±0.13a 4.23±0.33c 0.08±0.00a 3.71±0.04a
a-dMeans with different superscripts within each column indicate significant differences by Duncan's multiple range test (P<0.05).
Table 2. Heavy metal and mineral content of raw laver Pyropia sp. according to production region and season in Korea (December 2017-March 2018)
(Unit: mg/100 g)
Region Month Mercury
(Hg) Cadmium
(Cd) Plumbum
(Pb) Selenium
(Se) Manganese
(Mn) Zinc
(Zn) Nickel
(Ni) Iron (Fe)
Gangseo-gu, Busan
December 0.002±0.21a -1 - - 2.546±0.87a 5.607±0.21a - 9.136±0.11b January 0.002±0.11a - - - 2.959±0.94a 6.275±0.19a - 10.75±0.24b February - 0.074±0.04b - - 3.376±0.41a 2.439±0.14b - 14.3±0.33c March 0.001±0.09a 0.194±0.09b - - 3.753±0.62c 3.961±0.31c - 9.03±0.51c
Seocheon-gun, Chungnam
December 0.002±0.57a - - - 2.228±0.37b 3.119±0.24c - 13.51±0.67a
January 0.001±0.05a - - - 2.424±0.52b 3.255±0.12c - 22.9±0.22a
February 0.001±0.34a 0.114±0.63a - - 3.061±0.20b 2.559±0.11b - 20.16±0.17a March 0.001±0.33a 0.118c - - 5.495±0.17a 4.595±0.37b - 46.08±0.19a
Wando-gun, Jeonnam
December 0.001±0.27a 0.033±0.21a - - 1.476±0.14d 3.330±0.20b - 7.956±0.16c January 0.001±0.37a 0.066±0.11a - - 1.828±0.11 c 4.503±0.11b - 7.743±0.11c February 0.001±0.24a - - - 2.171±0.21c 3.087±0.31a - 17.17±0.12b March 0.001±0.31a 0.129±0.30c - 0.06±0.11a 2.659±0.31d 3.855±0.36c - 9.801±0.25c
Goheung-gun, Jeonnam
December 0.001±0.67a 0.032±0.17a - 0.113±0.09a 1.693±0.67b 2.774±0.24d - 7.192±0.29d January 0.001±0.10a - - - 2.325±0.22b 2.432±0.14d - 11.73±0.37b February 0.001±0.71a - - - 1.772±0.17a 2.215±0.11c - 13.50±0.22c March 0.001±0.86a 0.294±0.31a - - 4.864±0.11c 6.090±0.09a - 22.36±0.55b
1Not detected. a-dMeans with different superscripts within each column indicate significant differences by Duncan's multiple range test P<0.05).
로
direct mercury analyzer (DMA-80 TRICELL; Milestone Inc., Sorisole, Italy)
를사용하여분석하였다.
분석은부경식품 분석센터(
부산시남구)
에의뢰하여분석을진행하였다. 유리아미노산 분석
물김원초의유리아미노산분석을위하여동결건조시료
0.5 g
을칭량하여3% TCA (trichloroacetic acid) 10 mL
를주입하고vortexing
후상온에서1
시간진탕하였다. 15,000 rpm, 15
분간 원심분리한후상등액을취하여0.45 μm millipore
여과막으 로여과한후에아미노산자동분석기(L-8900; Hitachi, Tokyo,
Japan)
를이용하여분석하였다.
분석은강릉원주대학교공동실험실습관
(
강원도강릉)
에의뢰하여분석을진행하였다. 총 페놀화합물 함량
총페놀화합물
(total phenolic compound)
은Folin-Ciocalteu
법으로측정하였다(Mahinda et al., 2010).
동결건조된물김원 초0.5 g
을취하여80%
아세톤용액50 mL
으로혼합한다음6
시간진탕한후3,350 rpm, 20
분간원심분리후,
상등액을사 용하여분석하였다(Han et al., 2015).
상등액0.5 mL
를10%
Folin-ciocalteu
용액2.5 mL
와7.5%
중탄산나트륨2.5 mL
를 혼합후45℃, 45
분동안활성화시켜분광광도계(Biochrom
Libra S22; Cambridge, UK)
를사용하여765 nm
에서측정하 였다.
표준물질로는gallic acid
를사용하였다.
항산화 활성 측정
동결건조된물김원초
5 g
에95% ethanol 50 mL
를가한뒤 상온에서3
시간 동안교반시킨 후여과시킨 과정을3
반복한 뒤감압농축하여에탄올을 날려버린후동결건조를통해남 은여액을제거하여항산화활성측정을위한시료로사용하 였다. DPPH radical
소거활성은감압농축후동결건조된 물김원초의2 mg
을에탄올용액1 mL
에녹인것을0.2 mM 2,2'-diphenyl-1-picrylhydrazyl (DPPH; Sigma-Aldrich Co., St. Louis, MO, USA) 0.05-1.00 mg/mL
농도로혼합하여실 온에서30
분간반응시킨후517 nm
에서흡광도를측정하였다.
측정된결과는아래의식으로DPPH radical
소거활성을계산 하였다.
DPPH radical scavenging activity (%) = Absorbance of control – absorbance of test
Absorbance of control ×100
Table 3. Free amino acid content of raw laver Pyropia sp. according to production region and season in Korea (December 2017-March 2018)
(Unit: mg/100 g) Free-
amino- acid
Gangseo-gu, Busan Seocheon-gun, Chungnam Wando-gun, Jeonnam Goheung-gun, Jeonnam
Dec Jan Feb Mar Dec Jan Feb Mar Dec Jan Feb Mar Dec Jan Feb Mar
Taurine 65.85 0.05± c
108.1 0.08± b
91.24 0.24± a
112.7 0.67± a
98.94 0.88± a
131.6 0.74± a
55.84 0.77± d
39.58 0.81± d
71.31 0.66± b
53.67 0.45± d
79.8± 0.51b
109.8 0.33± b
65.41 0.21± c
56.52 0.17± c
70.89 0.91± c
98.59 0.74± c
Threo- nine
1.819 0.21± b
1.732 0.31± b
1.662 0.27± c
2.976 0.24± a
1.929 0.34± b
2.848 0.26± a
1.276 0.75± d
2.373 0.88± b
2.296 0.95± a
1.559 0.41± b
2.296 0.56± a
1.559 0.37± c
1.396 0.24± c
1.141 0.32± c
1.88± 0.44b
1.728 0.47± c
Valine 2.421 0.33± c
2.147 0.21± b
2.501 0.54± c
2.422 0.66± a
2.744 0.29± b
2.691 0.31± a
1.724 0.25± d
1.926 0.57± b
3.302 0.44± a
1.83± 0.31c
2.973 0.19± b
1.454 0.67± c
1.769 0.36± d
1.938 0.94± c
3.233 0.74± a
1.992 0.45± b
Methio- nine
0.365 0.33± b
0.19± 0.18b
1.216 0.39± b
0.33± 0.36a
1.76± 0.24a
0.5± 0.57a
0.474
0.24± c -1 1.939 0.29± a
0.102 0.14± b
1.639
0.25± a - 0.234 0.11± b
0.223 0.24± b
1.473 0.44± a
0.136 0.56± b
Iso-leucine 1.303
0.22± c 1.336 0.25± b
2.285 0.57± c
1.032 0.24± d
3.75± 0.51a
3.203 0.36± a
0.632 0.21± d
5.897 0.48± a
3.226 0.61± b
0.778 0.57± c
3.405 0.49± b
3.035 0.11± b
0.84± 0.18d
0.853 0.27± c
3.005 0.33± a
1.332 0.01± c
Leucine 2.499 0.27± b
1.576 0.64± b
2.094 0.74± c
2.088 0.67± a
2.107 0.47± c
2.018 0.61± a
0.879 0.78± d
0.737 0.35± c
3.031 0.16± a
1.374 0.77± c
2.748 0.64± a
0.772 0.21±bc
1.382 0.64± d
1.373 0.17± c
2.349 0.22± b
0.947 0.24± b
Phenyl- alanine
1.071 0.11± c
0.844 0.34± a
0.641
0.44± b -1 2.475 0.27± a
0.997
0.37± a - - 1.471 0.45± b
0.342 0.33± b
1.115 0.97± a
1.782 0.77± a
0.607 0.74± d
0.473 0.46± b
1.05± 0.27a -
Lysine 1.072 0.14± b
0.835 0.28± b
0.855 0.14± b
1.155 0.34± a
0.811 0.18± c
1.466 0.34± a
0.454 0.44± c
0.708 0.67± b
2.591 0.45± a
0.747 0.74± b
1.131 0.15± a
0.516 0.33± b
0.522 0.58± d
0.373 0.65± c
1.109 0.41± a
0.566 0.54± b
Arginine 2.997 0.31± b
2.794 0.25± a
2.117
0.21± c - 1.915 0.34± d
2.017 0.51± b
0.959 0.41± d
2.086 0.63± a
4.041 0.17± a
1.773 0.11± c
3.734
0.34± a - 2.675 0.27± c
2.631 0.31± a
2.648 0.19± b -
1Not detected. a-d Means with different superscripts within each column indicate significant differences by Duncan's multiple range test (P
<0.05).
ABTS radical
소거 활성은2.4 mM potassium persulfate
를포함하는7 mM
의2,2'-azino-bis [3-ethylbenzothiazoline- 6-sulphonic acid] (ABTS; Sigma-Aldrich Co., St. Louis, MO, USA)
용액150 μL
와감압농축후동결건조된물김원초의2 mg
을에탄올용액1 mL
에녹인것50 μL
와혼합하여6
분간 상온에서방치한후734 nm
에서흡광도를측정하였다.
측정된 결과는아래의식으로ABTS radical
소거활성을계산하였다.
ABTS radical scavenging activity (%) = Absorbance of control – absorbance of test
Absorbance of control ×100
통계처리
모든 분석은
3
반복으로 진행하였고 유의성 검정은분산분 석(ANOVA)
을행한후, P<0.05
수준에서Duncan’s multiple range test
를실시하였다.
통계분석은IBM SPSS v 23.0 (SPSS Inc., Chicago, USA)
프로그램을이용하여처리하였다.
결과 및 고찰
물김 원초의 생산 시기별 및 지역별 일반 식품학적 성 분 함량
생산시기별및지역별물김원초의일반식품학적성분인수 분
,
조단백질,
조지방및회분은Table 1
에나타내었다.
본연구 에서분석된생산시기별및지역별물김원초의수분함량은2
월서천김원초의수분함량이91.55±0.36%
로가장높게나 타났고, 12
월완도김원초의수분함량이85.18±0.10%
로가 장낮게나타났다.
조단백질함량은12
월낙동김원초의조단 백질함량이7.20±0.28%
로가장높게나타났고,
낙동김원초 의조단백질함량은다른지역에비해유의적으로높게나왔다.
조지방의경우
, 1
월에채취한완도김원초의조지방함량이0.25±0.00%
로가장높게나타났고, 2
월서천김의조지방함량 이0.04±0.01%
로가장낮게나타났다.
회분함량은12
월에채 취한낙동김원초의회분함량이4.10±0.04%
로가장높게나 타났고, 3
월낙동김의회분함량이2.92±0.04%
로가장낮게 나타났다. NIFS (2018)
의한국수산물성분표에서김의일반성 분함량을비교했을때,
수분함량은90.5 g/100 g,
단백질3.3 g/100 g,
지방0.4 g/100 g,
회분3.8 g/100 g
으로보고하고있다.
본연구에서얻어진결과도생산지역별및산지별물김원초의 수분,
조단백,
조지방및회분의경우NIFS (2018)
의보고와유 사하였다.
하지만,
낙동김원초의경우조단백질함량은NIFS (2018)
의보고보다높게나타났다. Lee et al. (1987)
은김의품 질등급이높을수록조단백질함량은높은것에비하여탄수화 물이적게함유되어있는것으로보고하고있다.
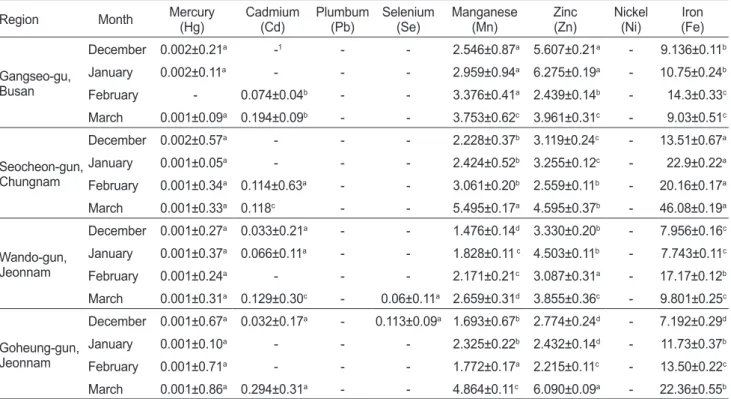
물김 원초의 생산 시기별 및 지역별 중금속 및 미량 원 소 함량
본실험에분석한물김원초의생산시기별및지역별중금 속및미량원소함량은
Table 2
에나타내었다.
식품의약품안 전처에서제정한수산물중금속기준에따르면김의경우카 드뮴(Cd) 0.3 mg/kg
이하(
생물기준)
로 정해져있으며,
모든물김원초의생산시기별및지역별카드뮴
(Cd)
정량에서기준치이하로나타났다
(MFDS, 2018).
납(Pb)
과니켈(Ni)
은검 출이되지않았다.
망간(Mn)
의경우3
월에채취한서천김원 초가5.495±0.00 mg/kg
으로가장높게나타났고,
낙동김원초의경우에는망간
(Mn)
함량이다른지역에비해평균적으로 높게 측정되었다
.
아연(Zn)
의 경우1
월에 채취한 낙동김 원초가6.275±0.00 mg/kg
으로가장 높게측정되었으며,
낙동김원초의아연
(Zn)
함량이다른지역의물김원초보다평균적으로높게측정되었다
.
철(Fe)
의경우3
월의서천김원초 에서46.08±0.00 mg/kg
으로 현저히높게측정되었다.
서천 김원초에서의철(Fe)
함량이다른지역의물김원초보다평균 적으로높게나타났으며, 12
월에채취한고흥김원초의경우7.192±0.00 mg/kg
으로가장낮게나타났다.
이상의생산지역 별물김의미네랄함량결과는Jung et al. (2017)
결과와비교 했을때, 12
월에채취한낙동김원초및2
월에채취한완도김원 초의경우철(Fe)
과망간(Mn)
성분이Jung et al. (2017)
의보고 보다높게분석되었다.
하지만,
다른시기에채취한물김원초의 경우에는큰변화가없었다.
물김 원초의 생산 시기별 및 지역별 유리 아미노산 함량
아미노산은주로단백질을구성하는성분과유리된형태로존재한다
.
또한아미노산의결합형태에따라2
개이상의아미노 산이여러형태로연결된펩타이드,
당또는아미노산외에다 른성분을포함하는복합단백질등의형태로도미량존재한다.
아미노산은영양적및기호적으로중요한성분이며,
특히유리 아미노산이헥산관련성분과함께맛에중요한역할을한다.
유 리아미노산은생리활성물질의구성성분일뿐만아니라정미 성분으로중요하며,
수산물에있어아미노산의증가는맛을상 승시키는중요한역할을하는것으로알려져있다(Koo et al.,
2016).
본연구에서분석한물김원초의생산시기별및지역별유리아미노산함량은
Table 3
에나타내었다.
타우린(Taurine)
의경우1
월에채취한서천김원초에서131.6 mg/100 g
으로가 장높게나타났으나낙동김원초의경우생산시기별로다른지 역에비해평균적으로높게나타났다.
트레오닌(Threonine)
의 경우3
월에채취한낙동김원초(2.976 mg/100 g),
발린(Valine)
은12
월완도김원초(3.302 mg/100 g),
메티오닌(Methionine)
은12
월완도김원초(1.939 mg/100 g),
이소류신(Isoleucine)
의경우3
월서천김원초(5.897 mg/100 g),
류신(Leucine)
의경 우12
월완도김원초(3.031 mg/100 g),
페닐알라닌(Phenylala- nine)
의경우12
월서천김원초(2.475 mg/100 g),
리신(Ricin)
의 경우12
월완도김원초(2.591 mg/100 g),
아르기닌(Argi- nine)
의경우12
월전남완도군물김원초(4.041 mg/100 g)
에 서가장높게나타났다.
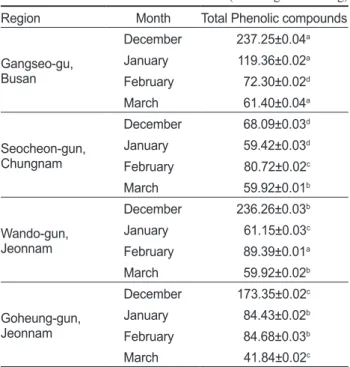
Table 4. Total phenolic compound of raw laver Pyropia sp. ac- cording to production region and season in Korea (December 2017-March 2018)
(Unit: mg GAE/100 g) Region Month Total Phenolic compounds
Gangseo-gu, Busan
December 237.25±0.04a January 119.36±0.02a February 72.30±0.02d
March 61.40±0.04a
Seocheon-gun, Chungnam
December 68.09±0.03d January 59.42±0.03d February 80.72±0.02c
March 59.92±0.01b
Wando-gun, Jeonnam
December 236.26±0.03b January 61.15±0.03c February 89.39±0.01a
March 59.92±0.02b
Goheung-gun, Jeonnam
December 173.35±0.02c January 84.43±0.02b February 84.68±0.03b
March 41.84±0.02c
GAE, Gallic acid equivalents. a-dMeans with different superscripts within each column indicate significant differences by Duncan's multiple range test (P<0.05).
Table 5. Antioxidant activities of raw laver Pyropia sp. according to production region and season in Korea (December 2017-March 2018)
Region Month DPPH1 (%)
0.05 mg/mL 0.10 mg/mL 0.25 mg/mL 0.50 mg/mL 1.00 mg/mL
Gangseo-gu, Busan
December 3.38±0.02c 10.15±0.02a 12.62±0.02b 24.31±0.02b 36.62±0.02c January 6.01±0.01c 6.11±0.04c 12.91±0.03b 23.42±0.03a 48.35±0.02a February 2.17±0.03d 4.04±0.03d 13.35±0.03d 22.36±0.02d 45.03±0.02d March 5.78±0.02d 7.90±0.02c 16.72±0.02c 29.79±0.02a 49.85±0.03a
Seocheon-gun, Chungnam
December 4.79±0.04b 8.08±0.02b 14.67±0.01a 24.55±0.03a 39.52±0.02a January 1.50±0.02d 6.61±0.02b 11.41±0.01d 18.32±0.02c 33.33±0.02b February 4.26±0.03c 6.08±0.01c 14.59±0.02c 23.40±0.03c 45.59±0.02c March 6.60±0.02c 7.81±0.03d 15.62±0.02d 24.02±0.02c 45.95±0.03b
Wando-gun, Jeonnam
December 5.11±0.03a 5.71±0.03c 11.41±0.03c 22.52±0.02c 39.34±0.02b January 7.42±0.03b 11.71±0.01a 21.32±0.04a 21.62±0.02b 30.93±0.02c February 4.86±0.02b 7.29±0.02b 15.50±0.01b 28.88±0.03b 49.54±0.03a March 12.46±0.04b 15.20±0.03a 20.36±0.01b 23.40±0.02d 34.95±0.01d
Goheung-gun, Jeonnam
December 0.90±0.02d 1.80±0.04d 4.20±0.04d 7.52±0.00d 23.03±0.02d January 7.53±0.02a 8.11±0.02c 12.61±0.03c 15.92±0.03d 28.23±0.02d February 8.60±0.04a 11.15±0.01a 19.11±0.02a 29.94±0.03a 46.50±0.02b March 12.61±0.04a 14.71±0.03b 22.82±0.02a 26.13±0.02b 44.44±0.03c
Region Month ABTS2 (%)
0.05 mg/mL 0.10 mg/mL 0.25 mg/mL 0.50 mg/mL 1.00 mg/mL
Gangseo-gu, Busan
December 5.40±0.03b 6.67±0.03c 13.97±0.02b 21.27±0.02c 43.49±0.01b January 5.67±0.00c 7.03±0.02c 15.65±0.03b 25.88±0.03b 51.76±0.03b February 7.01±0.03a 9.55±0.03a 20.70±0.04a 21.34±0.01d 56.05±0.04a March 8.07±0.01a 11.21±0.03a 17.29±0.03a 24.67±0.02a 58.11±0.04a
Seocheon-gun, Chungnam
December 6.11±0.02a 8.41±0.03a 14.42±0.03a 24.57±0.02a 46.57±0.02a January 5.71±0.00b 7.30±0.02b 16.51±0.04a 26.03±0.02a 56.51±0.03a February 6.33±0.02b 7.59±0.01c 15.19±0.03d 25.32±0.02c 52.85±0.04d March 7.74±0.02b 10.78±0.02b 17.09±0.02b 23.45±0.02b 56.78±0.01b
Wando-gun, Jeonnam
December 4.47±0.02c 7.35±0.04b 12.46±0.03c 23.00±0.01b 40.89±0.01c January 8.23±0.02a 12.34±0.03a 15.19±0.04c 19.62±0.04c 42.41±0.02c February 5.00±0.04c 9.06±0.01b 20.00±0.02b 28.13±0.01b 54.06±0.04c March 2.79±0.02c 3.82±0.03c 6.69±0.02d 19.11±0.04c 50.96±0.03d
Goheung-gun, Jeonnam
December 1.28±0.03d 4.49±0.02d 8.33±0.02d 12.18±0.02d 32.05±0.02d January 4.10±0.02d 4.73±0.04d 10.73±0.02d 14.20±0.04f 30.91±0.01d February 6.98±0.01a 6.98±0.02d 18.10±0.02c 28.25±0.01a 55.24±0.02b March 2.56±0.03d 3.18±0.02d 7.64±0.01c 18.15±0.02d 55.41±0.03c
1DPPH, 2,2'-diphenyl-1-picrylhydrazyl. 2ABTS, 2,2'-azino-bis [3-ethylbenzothiazoline-6-sulphonic acid]. a-fMeans with different super- scripts within each column indicate significant differences by Duncan's multiple range test (P<0.05).