IEG 환경지질연구정보센터
4
0
0
전체 글
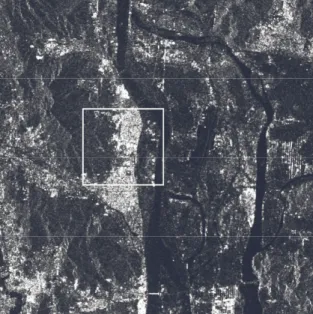
(2) ฌ. STACKING INTERFEROGRAM. φ ( x) =. ∑. N −1 k =0. e. Φk e. i 2πk x N. i 2 πk N. −1. −. 1 N. ∑Φ N −1 k =0. 1 k. e. i 2πk N. (4). −1. The phase gradient can be immediately computed from the complex interferogram without phase discontinuity. In practice, the first term of Eq. (4) is a scaled fourier. problem. Interferograms can be stacked using averaging. transform of phase gradient and the second term is a. of phase gradient without phase unwrapping. Staking of. simple summation.. interferograms of different baselines will reduce. ญ. RESULTS. temporal and baseline decorrelation. The gradient of the phase. I can be R . φ = tan −1 . Fig. 1 shows the amplitude image of study area, which corresponds to sub-way construction through urban area.. expressed as follows [7]:. This area is quite flat area near to the Nak-Dong river.. ∇φ ( x ) =. R∇I − I∇R R2 + I 2. (1). where R and I are the real and imaginary part of interferograms. In practice, complex conjugate method is more efficient in the computation of phase gradient:. ∇φ ( x ) = C x +1 ⋅ C x∗. (2). where C x is complex interferogram. Since phase gradient from complex interferogram, unlike the phase, are usually continuous function, we can generate stacked interferogram from arithmetic average of phase gradient Fig. 1. Amplitude image around the study area. The. [7]:. interferograms of the selected rectangle area is shown. 1 ∇φ = N. ∑ ∇φ. Figure 2.. N. i =0. (3). i. Fig. 2 presents the six interferograms used for monitoring surface subsidence. These interferograms. Although the phase gradient has some advantages over the original phase, they cannot be converted directly into topography. or. surface. displacement.. So. phase. unwrapping or phase gradient integration is still required. In frequency domain, phase can be reconstructed using the relationship as follows:. have a large temporal baseline about 2-3 years. While interferogram phase appears very noisy and shows low coherence in vegetated areas, there are some fringes related to ground deformations in urban area with all a large temporal baseline and flat area. The unique phase corresponded to subsidence was located in surroundings on Duk-Po and Mo-Ra stations at the centre of image..
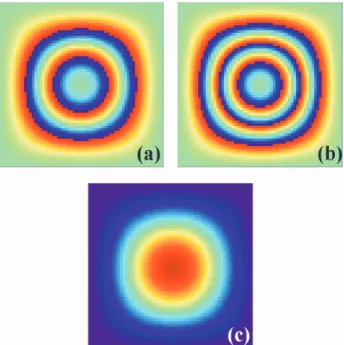
(3) The phase values of the elongated fringe pattern increase. increase fringe clarity and to decrease decorrelation error,. across the fringe, which indicates that it is related to not. phase filtering is needed for reduction of noise in case of. an uplift but a subsidence effect.. low coherence or low signal to noise ratio. The stacked interferogram after filtering is shown Fig. 4 has clearer fringe pattern than that of Fig. 2. The general shape of deformation fringe pattern along sub-way line suggests that the subsidence phenomenon is due to underground construction work.. Fig. 2. Differential interferograms. (a)08/11/95-25/11/ 97, (b)08/11/95-08/01/98,. (c)08/11/95-21/02/98,. (d)08/. 11/95-03/07/98, (e)08/11/95-16/08/98, (f)08/11/95-29/ 09/98. All interferograms show the fringe pattern caused by subsidence effects.. Simulated phases for stacking algorithm are shown Fig.. Fig. 3. Simulated phases for the stacking of interfero gram. (a), (b)Fringe patterns of two and three wrapped phases respectively. (c)Stacked interferogram ( unwrap ed phases ) using phase gradient operation.. G. 3. We modeled the wrapped phases of two and three fringes. respectively.. The. stacking. technique. on. simulated phases through the phase gradient method provides a good result of merged and wrapped phases. However, there is some problem caused by a high frequency in the result of stacking using phase gradient algorithm, since differential interferograms have still some noises around the area of interest. We applied phase gradient using real phase instead of complex data. Fig. 4. Stacked differential interferograms. The phase. to stack interferograms.. pattern shows ground deformation is located at the centre. Although stacking of interferograms is efficient to. of image..
(4) should be zero along the image boundaries.. V. CONCLUSIONS & DISSCUTIONS REFERENCE We have detected the subsidence along sub-way line around Duk-Po area using the differential interferograms. [1] Massonnet, D. and K. Feigl, Radar interferometry. generated from JERS-1 SAR images acquired in. and its application to changes in the Earth's surface,. 1995-1998. To enhance of the fringe pattern and to. Reviews of Geophysics, 4, 441-494, 1998.. decrease decorrelation errors, interferogram staking and. [2] S. Le Mouelic, D. Raucoules, C. Carnec, and C. King,. filtering technique were applied. Stacked interferogram. Ground uplift in the city of Paris (France) revealed by. also provides clearer unique phase variation caused by. satellite radar interferometry, Proceedings of IGARSS. ground deformation. This phenomenon is probably. 2002, Toronto, Canada, 24-28 June 2002.. related to elastic deformation, caused by sub-way. [3] Tesauro, M., P. Berardino, R. Lanari, E. Sansisti, G.. construction work, rather than a natural compaction of. Fornaro, and G. Franschetti, Urban subsidence inside the. ground.. city of Napoli (Italy) observed be satellite radar. We obtained the poor results from the phase gradient. interferometry, Geophys. Res. Lett., 27, 1961-1964,. processing using complex image data after stacking. 2000.. interferograms. It may result from the low coherence due. [4] Ferretti. A., C. Prati and F. Rocca, Nonlinear. to temporal decorrelation. Noises such as speckles. subsidence rate estimation using Permanent Scatterers in. caused by the low signal to noise ratio generated the. differential SAR interferometry, IEEE Trans. On. phase discontinuities and hampered the phase gradient. Geoscience and remote sensing, vol. 38. 2202-2212,. operation. To stack interferograms efficiently, only the. 2000.. long wavelength information through the low pass. [5] Madsen, S. N., H. A. Zebker, and J. Martin,. filtering. processed. Topographic Mapping Using Radar Interferometry:. interferograms have still significant short wavelengths. Processing Techniques, IEEE Trans. On Geoscience and. even after filtering. Since this area is flat with little relief,. remote sensing, vol. 31(1), 246-256, 1993.. we assumed the phase related to the ground deformation. [6] Zebker, H. A., P. A. Rosen, and S. Hensley,. does not have the phase discontinuities except high. Atmospheric effects in interferometric synthetic aperture. frequency noises, and applied the phase gradient. radar surface deformation and topographic maps, J.. algorithm on the real phase values.. Geophys. Res., 102(B4), 7547-7563, 1997.. The phase gradient is not suitable in case of very noisy. [7] Sandwell, D. T., and E. J. Price, Phase gradient. data, because it has the significant problem on the high. approach to stacking interferograms, J. Geophys. Res.,. frequencies. This means that the phase is propagated. 103, 30183-30204, 1998. with a wrong value and can not be recovered when it is. [8] Goldstein, R., and Werner, C., Radar Ice Motion. integrated.. Interferometry, Proc. 3rd ERS Symposium on Space,. In practice, the boundary condition has to be thought. Florence, Italy, 17-21 March, Vol II, 969-972, 1997. is. required.. However,. the. carefully when the phase gradient is summed. Because the data is subject to discontinuous region, the integration using the undesirable boundary condition results in poor phase restoration to wrong direction. Generally the outward component of the phase gradient.
(5)
수치
관련 문서
→ f depends on the number of nucleation sites and the growth rate.. (c) All of the parent phase is consumed by the
Different composition between parent and product (Ex. The growth of the B-rich phase into the A-rich α-phase) Growth of the new phase will require long-range diffusion
석출물 모양에 무관 총 탄성 에너지는 석출물의 모양과 기지와 석출물의 탄성 특성에 따라 변화. 탄성 변형 에너지
- Sufficient time for diffusion in solid & liquid (low cooling rate) - Relative amount of solid and liquid : lever rule.. : high cooling
Since the overall thermal performance is dependent upon the internal flow regimes (Two-phase flows) starting from slug/plug flows to circulatory annular flow, these flow
A crystal plane at an angle θ to the close-packed plane will contain broken bonds in excess of the close-packed plane due to the atoms at the steps..
[From Binary Alloy Phase Diagrams, 2nd edition, Vol. Reprinted by permission of ASM International, Materials Park, OH.].. 11.23, Callister & Rethwisch 9e.. [From Binary
[From Binary Alloy Phase Diagrams, 2nd edition, Vol. Reprinted by permission of ASM International, Materials Park, OH.].. 11.23, Callister & Rethwisch 9e.. [From Binary
