Citation: Kim JK, Lei XJ, Lee SI, Lee IS, Kim IH 2017. Evaluation of rapeseed meal as a protein source to replace soybean meal in growing pigs. Korean Journal of Agricultural Science 44:235-243.
DOI: https://doi.org/10.7744/kjoas.20170023 Editor: Jung Min Heo, Chungnam National University, Korea
Received: March 2, 2017
Revised: May 29, 2017 Accepted: May 31, 2017
Copyright: © 2017 Korean Journal of Agricultural Science.
This is an Open Access article distributed under the terms of the Creative Com- mons Attribution Non-Commercial License (http:
//creativecommons.org/licenses/by-nc/4.0/) which permits unrestricted non-commercial use, distribution, and reproduction in any medium, provided the original work is properly cited.
OPEN ACCESS
ANIMAL
Evaluation of rapeseed meal as a protein source to replace soybean meal in growing pigs
Jong Keun Kim
1†, Xin Jian Lei
1†, Sang In Lee
1, Il Seok Lee
2, In Ho Kim
1*1
Department of Animal Resource and Science, Dankook University, Cheonan 31116, Korea
2
Department of General Education, Dankook University, Cheonan 31116, Korea
*Corresponding author: [email protected]
†
These authors contributed equally to this work as the first authors.
Abstract
A total of 112 crossbred pigs [(Yorkshire × Landrace) × Duroc] with an average body weight (BW) of 27.98 ± 1.28 kg were used to evaluate the effects of replacing soybean meal (SBM) with rapeseed meal (RSM) as a source of protein on growth performance, nutrient digestibility, blood characteristics, and fecal noxious gas emission in growing pigs. The pigs were blocked and stratified based on BW into one of four dietary treatments in a 6-week trial. Each treatment consisted of 7 replicate pens with 4 pigs per pen (2 barrows and 2 gilts). Treatments were 1) maize-SBM based diet, 2) diet containing 2% RSM, 3) diet containing 4% RSM, and 4) diet containing 6% RSM. Supplementation with RSM resulted in no differences in growth performance, nutrient digestibility, and noxious gas emission, as compared with SBM supplementation during the experimental period (p > 0.05). Pigs fed with increased dietary RSM (0, 2, 4, and 6% of feed) had linear decreases in average daily gain (ADG) (p = 0.010) and nitrogen digestibility (p = 0.036) and a linear increase in blood creatinine concentration. In conclusion, RSM fed pigs had no detrimental effects on their growth performance, nutrient digestibility, blood characteristics, and fecal noxious gas emissions, as compared with SBM fed pigs. Thus, RSM is a good alternative to SBM as a protein source in growing pigs’ diets.
Keywords: growing pig, growth performance, nutrient digestibility, rapeseed meal, soybean meal
Introduction
The rising cost of soybean meal (SBM), an important protein source in swine diets, has resulted
in the search for low cost protein sources for many animal farms (O'Doherty et al., 2001; Park et
al., 2016a). Rapeseed meal (RSM) is a by-product of the biodiesel industry that is recycled through
animal feed. In comparison with SBM, RSM has less crude protein and amino acids and higher
fiber. However, RSM contains higher contents of phosphorus and sulfur-containing amino acids
such as methionine and cysteine.
In swine and poultry farms, RSM is mainly used ‘as a protein source because of the development of low glucosinolate-type rapeseed by Canadian and European plant breeders. The use of RSM in pigs’ diets is limited by its relatively high of fiber, low energy yielding oligosaccharides, and sub-optimal protein and amino acids utilization (Bourdon and Aumaître, 1990; Sauer and Ozimek, 1986; Slominski et al., 1994; Zduńczyk et al., 2013). In addition, RSM supplementation of pigs’ diets has yielded inconsistent results on growth performance and nutrient digestibility depending on its glucosinolate levels (Corino et al., 1991; McDonnell et al., 2010; Seneviratne et al., 2010; Siljander- Rasi et al., 1996).
To overcome the limitations of RSM in pig diets, many attempts have been made to reduce anti-nutritional factor levels and optimize fiber content by enhancing methods of dietary processing and formulation (Fang et al., 2007;
Woyengo et al., 2009; Park et al., 2016b). Fang et al. (2007) improved growth performance and nutrient digestibility in pigs by supplementing xylanase, a non-starch polysaccharide (NSP)-degrading enzymes in diet containing RSM.
Thus, to test maximum inclusion levels of RSM to replace SBM as a protein source in pig diets, we evaluated the effects of different levels of RSM on growth performance, nutrient digestibility, blood characteristics, and fecal noxious gas emissions in growing pigs.
Materials and Methods
The Animal Care and Use Committee of Dankook University approved all experimental protocols used in the current study.
Experimental design, animals, housing, and diets
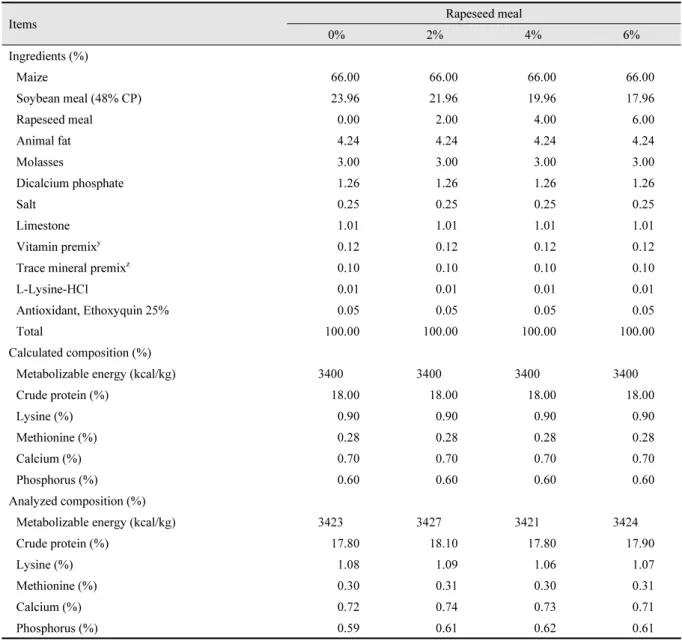
A total of 112 crossbred pigs [(Yorkshire × Landrace) × Duroc] with an average body weight (BW) of 27.98 ± 1.28 kg were used in a 6-week trial. The pigs were blocked and stratified based on BW into four dietary treatments. Each treatment consisted of 7 replicate pens with 4 pigs per pen (2 barrows and 2 gilts). Treatments were 1) maize-SBM based control, 2) diet containing 2% RSM, 3) diet containing 4% RSM, and 4) diet containing 6% RSM. All diets were formulated to meet or exceed nutrition requirements (Table 1) (NRC, 2012). All pigs were housed in an environmentally controlled room with a slatted plastic floor. Each pen was equipped with a self-feeder and nipple water to allow ad libitum access to feed and water throughout the experimental period.
Sampling and measurements
Individual pig BW was recorded at the beginning and week 6 of the experimental period. Feed consumption was recorded on a per pen basis during the experiment to calculate average daily gain (ADG), average daily feed intake (ADFI), and gain/feed intake ratio (G/F).
During the experimental period, pigs were fed diets mixed with 0.2% Cr
2O
3(Chromic Oxide) as an indigestible
marker for the determination of apparent total tract digestibility (ATTD) for dry matter (DM), gross energy (GE), and
nitrogen. At week 6, fecal samples were collected from at least 2 pigs in each pen via rectal massage. All feed and fecal
samples were stored at -20 ℃ until analysis. Feces samples were thawed at 57℃ for 72 h, ground to pass through a
1-mm screen for subsequent analysis. All of the feed and fecal samples were then analyzed for DM and nitrogen
following the procedures outlined by the AOAC (AOAC, 2012). Chromium was analyzed using UV absorption
spectrophotometry (Shimadzu, UV-1201, Kyoto, Japan) and nitrogen content was determined using a Kjeltec 2300 Analyzer (Foss Tecator AB, Hoeganaes, Sweden). Gross energy was determined by measuring the heat of combustion in the samples using a Parr 6100 oxygen bomb calorimeter (Parr instrument Co., Moline, IL, USA).
The digestibility was calculated according to the following formula:
ATTD = [1-{(Nf × Cd)/(Nd × Cf)}], where Nf = nutrient concentration in feces (%DM), Nd = nutrient concentration in diets (%DM), Cf = chromium concentration in feces (%DM), and Cd = chromium concentration in diets (%DM).
On the initial and final day of the experiment, blood samples were collected from the cervical vein in K
3EDTA vacuum and clot activator vacuum tubes (Becton Dickinson Vacutainer Systems, Franklin Lakes, NJ, USA) from 2 pigs in each pen and the same pigs were sampled again on the final day of the experiment. The whole blood concentrations of red blood cells (RBC), white blood cells (WBC), and lymphocytes were measured using the
Table 1. Feed composition of experimental diets (as-fed basis).
Items Rapeseed meal
0% 2% 4% 6%
Ingredients (%)
Maize 66.00 66.00 66.00 66.00
Soybean meal (48% CP) 23.96 21.96 19.96 17.96
Rapeseed meal 0.00 2.00 4.00 6.00
Animal fat 4.24 4.24 4.24 4.24
Molasses 3.00 3.00 3.00 3.00
Dicalcium phosphate 1.26 1.26 1.26 1.26
Salt 0.25 0.25 0.25 0.25
Limestone 1.01 1.01 1.01 1.01
Vitamin premix
y0.12 0.12 0.12 0.12
Trace mineral premix
z0.10 0.10 0.10 0.10
L-Lysine-HCl 0.01 0.01 0.01 0.01
Antioxidant, Ethoxyquin 25% 0.05 0.05 0.05 0.05
Total 100.00 100.00 100.00 100.00
Calculated composition (%)
Metabolizable energy (kcal/kg) 3400 3400 3400 3400
Crude protein (%) 18.00 18.00 18.00 18.00
Lysine (%) 0.90 0.90 0.90 0.90
Methionine (%) 0.28 0.28 0.28 0.28
Calcium (%) 0.70 0.70 0.70 0.70
Phosphorus (%) 0.60 0.60 0.60 0.60
Analyzed composition (%)
Metabolizable energy (kcal/kg) 3423 3427 3421 3424
Crude protein (%) 17.80 18.10 17.80 17.90
Lysine (%) 1.08 1.09 1.06 1.07
Methionine (%) 0.30 0.31 0.30 0.31
Calcium (%) 0.72 0.74 0.73 0.71
Phosphorus (%) 0.59 0.61 0.62 0.61
y
Provided per kg of complete diet: vitamin A, 11,025 IU; vitamin D3, 1,103 IU; vitamin E, 44 IU; vitamin K, 4.4 mg; riboflavin, 8.3 mg; niacin, 50 mg; thiamine, 4 mg; pantothenic acid, 29 mg; choline, 166 mg; and vitamin B12, 33 µg.
z
Provided per kg of complete diet: Mn,12.5 mg; Zn, 179 mg; Cu, 5 mg; I, 0.5 mg; Se, 0.4 mg.
automatic blood analyzer (ADVIA 120, Bayer Corp., Tarrytown, NJ, USA). After collection, blood samples were subsequently centrifuged (2,000 × g) for 30 min at 4 ℃. The concentrations of IgG and creatinine in the plasma were measured using an automatic biochemistry analyzer (HITACHI 747, Japan). Blood urea nitrogen (BUN) concentration was determined using a spectrophotometric procedure.
Feces and urine were collected on d 42 from 4 pigs per treatment. The urine was collected in a bucket via a funnel below the cage. Samples were kept in sealed containers and were immediately stored at -4 ℃. After sampling was finished, feces and urine samples were pooled for each pen and each pooled sample was mixed well. The subsamples of slurry (150 g feces and 150 g of urine on a wet weight basis) were taken and stored in 2.6 L plastic boxes in duplicate as described by Cho et al. (2008). Each box had a small hole in the middle of one side wall, which was sealed with adhesive plaster so as to maintain anaerobic condition. The samples were permitted to ferment for 7 days at room temperature (25 ℃). At 1, 3, 5, and 7 days of the fermentation period, an amount of gas was measured using a Gastec gas sampling pump (model GV-100, Gastec detector tube No. 3 M and 3 La for ammonia and hydrogen sulfide, Gastec Corp., Japan). The adhesive plasters were punctured, and 100 mL of headspace air was sampled approximately 2.0 cm above the feces surface.
Statistical analysis
All data were subjected to statistical analyses as a randomized complete block design using the GLM procedure of the SAS software (SAS Institute, 1996) with the pen as the experimental unit. Orthogonal contrasts were used to test the effects of inclusion of rapeseed meal (SBM vs. RSM). Additionally, orthogonal comparison was conducted using polynomial regression to measure the linear and quadratic effects of increasing concentrations of RSM. Variability in the data was expressed as the pooled standard error (SE). p < 0.05 was considered as statistical significance.
Results
Growth performance
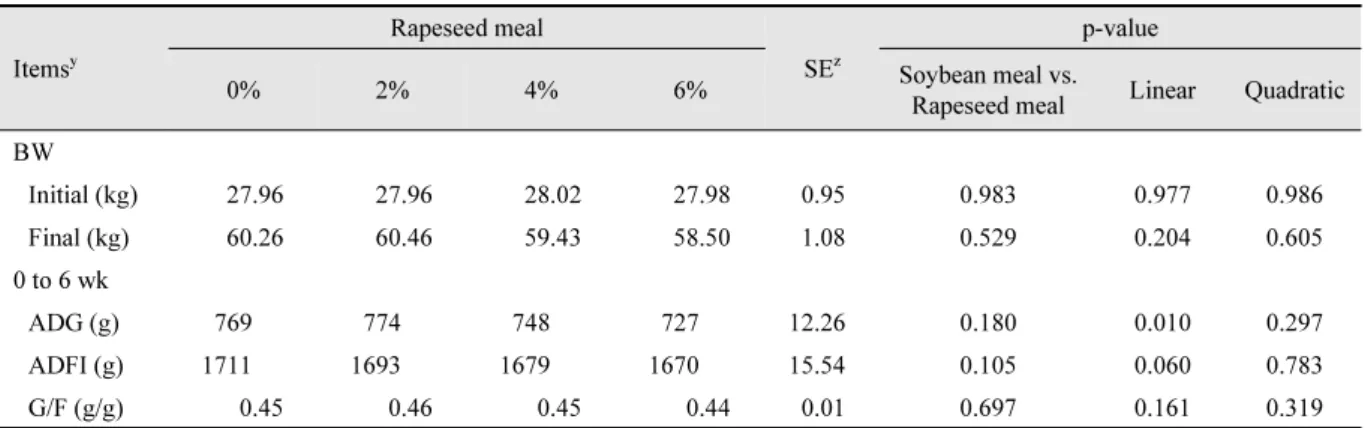
Effect of dietary supplementation with RSM on growth performance is shown in Table 2. Supplementation of RSM resulted in no differences in BW, ADG, ADFI, and G/F, as compared with SBM supplementation during the
Table 2. The effects of rapeseed meal on growth performance in growing pigs.
Items
yRapeseed meal
SE
zp-value
0% 2% 4% 6% Soybean meal vs.
Rapeseed meal Linear Quadratic BW
Initial (kg) 27.96 27.96 28.02 27.98 0.95 0.983 0.977 0.986
Final (kg) 60.26 60.46 59.43 58.50 1.08 0.529 0.204 0.605
0 to 6 wk
ADG (g) 769 774 748 727 12.26 0.180 0.010 0.297
ADFI (g) 1711 1693 1679 1670 15.54 0.105 0.060 0.783
G/F (g/g) 0.45 0.46 0.45 0.44 0.01 0.697 0.161 0.319
y
ADFI: average daily feed intake; ADG: average daily gain; BW: body weight; G/F: gain/feed ratio.
z
SE: pooled standard error.
experimental period (p > 0.05). However, pigs fed with increased dietary RSM had a linear decrease in ADG (p = 0.01). RSM supplementation resulted in no significant differences in BW, ADFI, or G/F ratio during the experimental period (p > 0.05).
Nutrient digestibility
Effects of dietary supplementation with RSM on ATTD are shown in Table 3. Supplementation of RSM resulted in no differences in DM, nitrogen, and GE, as compared with SBM supplementation during the experimental period (p >
0.05). Pigs fed with dietary RSM had a linear decrease in ATTD of nitrogen (p = 0.036). No significant differences were observed in DM and GE in response to RSM supplementation during the experimental period (p > 0.05).
Blood characteristics
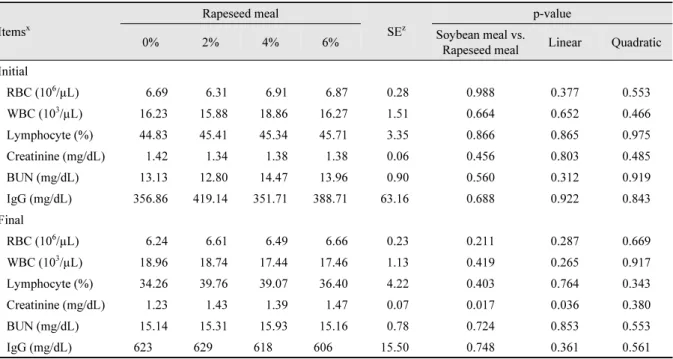
Effects of dietary supplementation with RSM on blood characteristics are shown in Table 4. During the initial phase, supplementation of RSM resulted in no differences in RBC, WBC, lymphocyte, creatinine, BUN, or IgG, as
Table 3. The effects of rapeseed meal on nutrient digestibility in growing pigs.
Items
Rapeseed meal
SE
zp-value
0% 2% 4% 6% Soybean meal vs.
Rapeseed meal Linear Quadratic
Dry matter (%) 76.55 77.49 75.12 74.40 1.39 0.587 0.168 0.556
Nitrogen (%) 77.23 77.68 76.37 73.83 1.16 0.351 0.036 0.210
Gross energy (%) 76.77 77.04 75.23 74.68 1.14 0.402 0.126 0.722
z
SE: pooled standard error.
Table 4. The effects of rapeseed meal on blood characteristics in growing pigs.
Items
xRapeseed meal
SE
zp-value
0% 2% 4% 6% Soybean meal vs.
Rapeseed meal Linear Quadratic Initial
RBC (10
6/µL) 6.69 6.31 6.91 6.87 0.28 0.988 0.377 0.553
WBC (10
3/µL) 16.23 15.88 18.86 16.27 1.51 0.664 0.652 0.466
Lymphocyte (%) 44.83 45.41 45.34 45.71 3.35 0.866 0.865 0.975
Creatinine (mg/dL) 1.42 1.34 1.38 1.38 0.06 0.456 0.803 0.485
BUN (mg/dL) 13.13 12.80 14.47 13.96 0.90 0.560 0.312 0.919
IgG (mg/dL) 356.86 419.14 351.71 388.71 63.16 0.688 0.922 0.843
Final
RBC (10
6/µL) 6.24 6.61 6.49 6.66 0.23 0.211 0.287 0.669
WBC (10
3/µL) 18.96 18.74 17.44 17.46 1.13 0.419 0.265 0.917
Lymphocyte (%) 34.26 39.76 39.07 36.40 4.22 0.403 0.764 0.343
Creatinine (mg/dL) 1.23 1.43 1.39 1.47 0.07 0.017 0.036 0.380
BUN (mg/dL) 15.14 15.31 15.93 15.16 0.78 0.724 0.853 0.553
IgG (mg/dL) 623 629 618 606 15.50 0.748 0.361 0.561
x
BUN: blood urea nitrogen; RBC: red blood cells.
z
SE: pooled standard error; WBC: white blood cell.
compared with SBM supplementation (p > 0.05). At week 6, pigs fed an RSM supplementation had increased blood creatinine as compared with SBM supplementation (p = 0.017). Additionally, supplementation with increased levels of dietary RSM resulted in a linear increase in blood creatinine at week 6 (p = 0.036). Supplementation of RSM had no differences on RBC, WBC, lymphocyte, BUN, or IgG concentrations, as compared with SBM supplementation (p > 0.05).
Fecal noxious gas emission
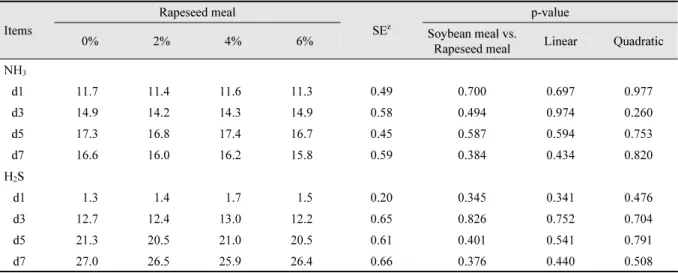
Effects of dietary supplementation with RSM on fecal noxious gas emission are shown in Table 5. Supplementation with RSM had no differences in ammonia and hydrogen sulfide emissioons as compared with SBM supplementation during the experimental period (p > 0.05). No significant differences were observed in ammonia and hydrogen sulfide emissions among RSM treatment groups during the experimental period (p > 0.05).
Table 5. The effects of rapeseed meal on fecal noxious gas emission in growing pigs.
Items
Rapeseed meal
SE
zp-value
0% 2% 4% 6% Soybean meal vs.
Rapeseed meal Linear Quadratic NH
3d1 11.7 11.4 11.6 11.3 0.49 0.700 0.697 0.977
d3 14.9 14.2 14.3 14.9 0.58 0.494 0.974 0.260
d5 17.3 16.8 17.4 16.7 0.45 0.587 0.594 0.753
d7 16.6 16.0 16.2 15.8 0.59 0.384 0.434 0.820
H
2S
d1 1.3 1.4 1.7 1.5 0.20 0.345 0.341 0.476
d3 12.7 12.4 13.0 12.2 0.65 0.826 0.752 0.704
d5 21.3 20.5 21.0 20.5 0.61 0.401 0.541 0.791
d7 27.0 26.5 25.9 26.4 0.66 0.376 0.440 0.508
z