유한요소망이 인장시험과 유한요소법을 이용한 진응력-진변형곡선 획득 기법에 미치는 영향에 관한 고찰
김홍태
†
· 엄재근* · 최인수** · 이민철*** · 전만수****Consideration on Effects of Mesh Systems on True Stress-Strain Acquisition Method over a Large Range of Strains by Tensile Test and Finite Element Method
Jaegun Eom, HongTae Kim, InSu Choi, Mincheol Lee, and ManSoo Joun
Key Words :
Flow Stress(유동응력), Constitutive Law(구성방정식), Tensile Test(인장시험), Numerical Characteristics(수치적 특성)Abstract
We present the numerical characteristics of a new true stress-strain curve acquisition method over a large range of strains by the tensile test and a finite element method through comparing the results obtained by various finite element mesh systems. The method is introduced in detail. The effects of the finite element mesh systems on the results are investigated to show its numerical characteristics of the new method. It is shown that the method is quite robust, implying that it can be used as a special function of the tensile test machines.
1. 서 론
소성가공 공정 해석 기술이 일반화됨으로써 금 속 재료의 진변형률-진응력 관계식 또는 곡선은 공정설계 기술자에게 필수화되었지만, 실험적으로 획득이 용이하지 않아 현장 기술자는 물론 연구자 들도 정확한 소재 정보를 모르는 경우가 허다하다.
진변형률-진응력 곡선은 주로 인장시험[1-7], 압축 시험[9-14], 압입시험[15-19], 펀치시험[20-22], 비틀 림시험[23], 노치 인장시험[24] 등에 의하여 획득 되고 있다.
인장시험법을 이용하여 진응력-진변형률 곡선을 구할 경우, 인장시편의 네킹지역에서 곡률을 측정 하거나 이와 관련된 실험 공식을 이용하여 비교적
큰 변형률에 대한 진응력-진변형률 곡선을 획득할 수 있으나, 정확도가 보장되지 않는다[6]. 압축시 험으로는 0.5 내외의 변형률에 대한 진응력을 측 정할 수 있으나 마찰 등의 영향으로 결과의 정확 도 보증이 어렵다. 압입시험은 사용중인 재료의 강도 등의 평가에는 적합하지만, 비교적 작은 변 형률에 대한 진응력-진변형률 곡선 정보를 얻게 해 준다.
한편, 최근 Joun 등[25]은 표점 간을 모델링한 단순 봉재(Simple bar)의 완전 인장시험 해석모델 (perfect model)을 이용하여 원형 단면 봉재의 인장 시험에서 네킹 발생 시점을 공학적인 관점에서 정 확하게 예측하였으며, 이를 이용하여 인장시험을 공학적 관점에서 정확하게 예측하게 해 주는 방법 을 제시하였다[26]. 제시된 방법은 변형률이 1.0 내외인 고 변형률에 대해서도 진변형률-진응력 정 보를 얻을 수 있는 장점이 있으며, 획득된 응력- 변형률 곡선으로 강소성 유한요소법[27]을 이용하 여 인장시험을 해석한 결과 인장시험의 전체를 매 우 정확하게 예측할 수 있음이 확인되었다.
†
경상대학교 대학원 기계공학과 E-mail : [email protected]
TEL : (055)751-5316 FAX : (055)751-5316
*
(사)경상대 수송기계부품기술혁신센터**
경상대학교 대학원 기계공학과***
경상대학교 2 단계 BK21 박사 후 과정****
경상대학교 기계항공공학부, 교수본 논문에서는 기 개발된 진응력-진변형률 곡선
획득 기법의 수치적 특성을 분석하고, 그 적용성
을 검토하고자 한다.
2. 인장시험과 해석기술의 접목을 통한 소재 물성치 획득법의 소개
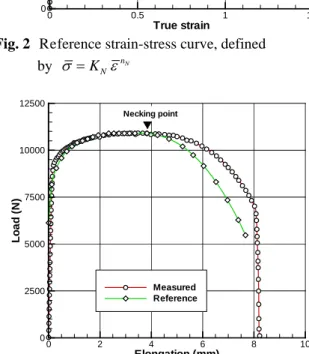
시편의 형상비가 일정 수준 이상일 때, 네킹의 시작은 기준변형경화지수 의 지배를 받는다 [25]. Fig. 1 은 인장시험 결과이며, Fig. 2 의 기준진 변형률-진응력 곡선은 Fig. 1 의 결과에 대하여 네 킹 발생을 강조하여 구한 것으로 네킹 발생 시점 및 최대하중을 정확하게 예측하게 한다[25]. 여기 서 강조해 두어야 할 점은 네킹의 발생과 파단에 이르는 과정, 특히 인장시편의 형상 변화를 예측 하기 위해서는 Fig. 2 의 기준진변형률-진응력 곡선 을 사용해야 한다는 점이다. 문제는 Fig. 3 에서 보 는 바와 같이 네킹 발생 시점 이후에 연신량의 증 가에 따라 인장시험에 대한 실험치와 예측치의 차 이가 커지며, 단조중 소재의 변형률이 네킹 발생 시점의 변형률보다 대개 10 배 이상 크다는 데 있 다. 따라서 Fig. 2 의 기준변형률-응력 곡선을 네킹 발생 이후의 재료의 물성치로 직접 사용하는데는 한계가 있으며, 유동응력의 적절한 보정이 필요하 다.
n N
네킹이 발생하면, 진변형률 분포의 비균질성이 급격히 증가하며, 특히 최소단면에서 진변형률은 최대가 된다. 최소단면에서는 상하 대칭성으로 인 하여 전단력이 작용하지 않으며, 소성변형 영역이 면서 폭방향으로 변형률 분포의 균일도가 상대적 으로 높다. 따라서 유한요소해석 결과로부터 최소 단면을 대표할 수 있는 변형률을 쉽게 정의할 수 있다. 즉, 어떤 특정한 연신량 δ 에 대하여 최소 i 단면을 구할 수 있으며, 그 때의 변형률 대표값
i
ε 의 결정이 가능하다. 그러므로 연신량 R δ 에서 i 측정한 인장하중
F 와 해석으로 예측한 인장하중t i
i
F 의 차이를
e ε 에서의 응력 R i σ 을 보정하여 최 R i 소화시킴으로써 네킹 이후에도 진변형률( ε )-진응 R i 력( σ )의 관계를 구할 수 있다. R i
면적평균법을 사용할 경우, 변형률 대표값 ε R i 는 다음 식으로 정의된다.
i A i
R i
dA A ε = ∫ ε
(1)
여기서
A 는 시험 연신량i δ 에서의 인장시편의 i 최소단면 또는 최소단면적을 나타낸다.
진변형률-진응력 곡선의 획득 방법에 관하여 상 술하기에 앞서, 먼저 진변형률-진응력 관계의 표 현법에 관하여 설명한다. 본 연구에서는 Hollomon 의 식에서 강도계수를 변형률의 함수로 간주한다.
구체적으로 설명하면, 기준 변형률-응력 곡선을 네킹 발생 이전까지의 진변형률-진응력 곡선으로 사용하고, 네킹 발생 이후에는 변형률경화지수는 그대로 사용하되 Fig. 4 에서 보는 바와 같이 시험
연신량 δ 에서 정의된 ( i ε , R i σ )로부터 역으로 계 R i 산한 강도계수 값을 선형보간하여 사용하였다.
Engineering strain
E n g in e er in g s tr es s (M P a)
0 0.1 0.2 0.3 0.4 0.5
0 100 200 300 400 500
Measured Necking point
Fig. 1 Experimental result of the tensile test
True strain
T ru e st re ss (M P a )
0 0.5 1
0 250 500 750
1.5 Measured and fitted Extrapolated
Necking point
Fig. 2 Reference strain-stress curve, defined by
σ=
KN
εn N
Elongation (mm)
Fig. 3 Comparison of experimental and predicted results of the tensile test
Lo a d (N )
0 2 4 6 8 10
0 2500 5000 7500 10000 12500
Measured
Reference
Necking point
시험 연신량 δ 에서의 개선된 ( i ε , R i σ )를 구하 R i 는 구체적인 절차는 다음과 같다. 다음에서 ε R i j , 와 σ R i j , 는 j 번 수정된 변형률과 응력을 각각 의 미한다.
1 단계: 인장시험 결과로부터 기준 변형경화지 수 n N 과 기준 강도계수 K N 을 구하고, 네킹 발생 이후의 시험 연신량 δ i ( i = 1, 2,..., M ) 를 연신량 중에서 결정한다.
2 단계: 기준 변형률-응력 곡선을 사용하여 인 장시험을 해석한 후 ε R i ( i = 1, 2,..., M ) 등을 구한다.
3 단계: j = 0 , ε R i j , = ε R i , 으로 둔다.
, , nN
i j i j
R K N R
σ = ε
( i = 1, 2,..., M )
4 단계: j ← + j 1 로 두고, , 로 둔다.
, ,
i j i j
R R
ε = ε − 1
i j i j
R R
σ , = σ , − 1 ( i = 1, 2,..., M )
5 단계: n N , K N , ( ) 등에 의하여 정의된 재료의 유동응력 정보와 완전 인장시험 해석모델을 이용하여 인장시험을 해석하고
, ,
i j , i j
R R
ε σ ( i = 1, 2,..., M )
δ i ( i = 1, 2,..., M ) 에서 인장하중의 실험치와 예측치를 비교하여 수렴 여부를 확 인하며, 수렴되지 않았을 경우 해석결과로부 터 ε 을 구하여 R i ε R i j , + 1 = ε R i 로 치환하고
i
F
e ( i = 1, 2,..., M )
) M 를 계산한다.
6 단계: ε ε = R i j , + 1 ( i = 1, 2,..., 에서 ( ε R i j , , σ R i j , )
( i = 1, 2,..., M ) 을 선형보간하여 응력 σ R i j , 을 구하고, ε ε = R i j , + 1 에서의 수정된 σ R i j , + 1 를 다 음과 같이 구한다.
, 1 ,
i
i j i j t
R R i
e
F
σ + = σ
F7 단계: 4 단계로 간다.
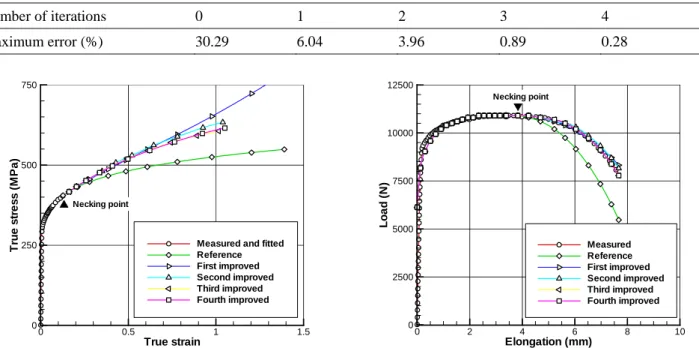
Fig. 4 와 Fig. 5 는 1-4 차례의 반복 계산으로 수 정된 변형률-응력 곡선과 이를 이용하여 예측한 연신량-인장하중 곡선을 각각 나타내고 있다. 그 리고 Table 1 에 수정 회수에 따라 인장하중의 실 험치 대비 예측치의 최대 오차의 변화를 나타내 었다. 이 표에서 보는 바와 같이, 수렴 특성이 매 우 양호함을 알 수 있으며, 4 차례의 반복 계산으 로 최대 오차가 0.28% 이하인, 즉 공학적 정답을 구하였다.
3. 기법의 수치적 특성
이미 2 장에서 제안된 방법의 수렴특성을 조사 한 바 있다. Table 2 에서 보는 바와 같이 4 번의 반 복계산으로 0.3%의 오차 이내에 들어오는 결과를 얻었다. 이 결과는 이 방법의 실용성 측면, 즉 인 장시험기와의 연계 활용을 고려한 컴퓨터 계산시 간 측면에서 매우 중요한 결과이다.
Table 1 Reduction of errors with number of iterations
Number of iterations 0 1 2 3 4
Maximum error (%) 30.29 6.04 3.96 0.89 0.28
Fig. 4 Comparison of stress-strain curves
True strain
T ru e st re ss (M P a )
0 0.5 1 1
0 250 500 750
Fig. 5 Comparison of elongation-tensile force curves
.5 Measured and fitted Reference First improved Second improved Third improved Fourth improved Necking point
Elongation (mm)
Loa d (N )
0 2 4 6 8
0 2500 5000 7500 10000 12500
10 Measured
Reference
First improved
Second improved
Third improved
Fourth improved
Necking point
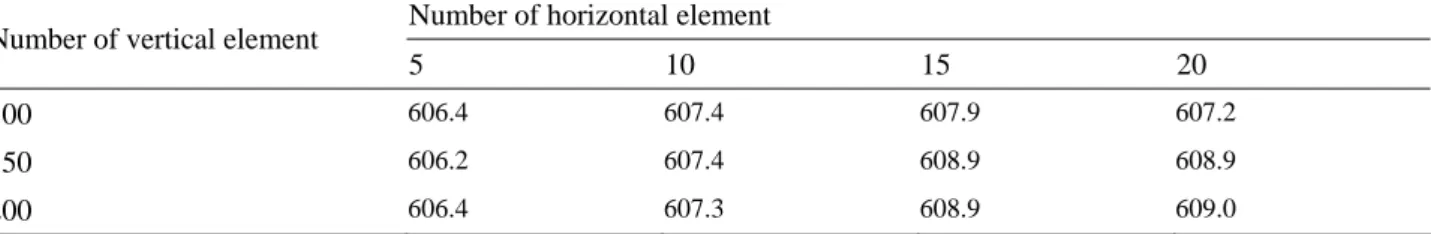
Table 2 Strength coefficients obtained by the uniform mesh systems shown in Fig. 6(a) Number of horizontal element
Number of vertical element
5 10 15 20
100 603.5 604.8 605.7 605.4
150 605.7 608.0 607.4 607.7
200 605.7 608.6 608.1 608.0
Table 3 Strength coefficients obtained by the non-uniform mesh systems shown in Fig. 6(b) Number of horizontal element
Number of vertical element
5 10 15 20
100
606.4 607.4 607.9 607.2150
606.2 607.4 608.9 608.9200
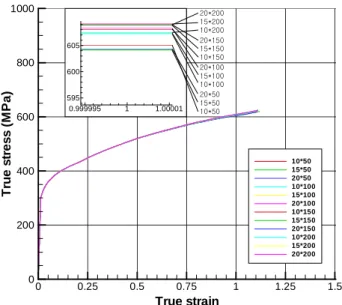
606.4 607.3 608.9 609.0여기서는 2 장에서 소개된 진응력-진변형률 곡 선 획득 방법의 수치적 특성을 파악하기 위하여, Fig. 1 의 실험 데이타에 대한 진응력-진변형률 곡 선을 다양한 요소망의 조건하에서 구한 후 변형률 1.0 에서 강도계수를 비교하였다.
N=5
M=20
a) Uniform b) Non-uniform
Fig. 6 Two different types of finite element mesh systems
Fig. 6 은 사용된 요소망의 형태를 개념적으로 나타내고 있다. Fig. 6(a)는 x-축과 y-축 방향으로 각각 N 토막과 M 토막씩 균일하게 분할된 요소망 을 나타내고 있고, Fig. 6(b)는 네킹의 발생이 예상 되는 상하부(경험적으로 볼 때 네킹은 상부 또는 하부에서 발생함)를 y-방향으로 조밀하게 분할한 요소망을 나타내고 있다.
Fig. 7 과 8 에 각각 균일 요소망과 불균일 요소 망으로에 얻은 진응력-진변형률 곡선을 나타내었
다. 그리고 Table 2 에 Fig. 6(a)의 균일 요소망으로 얻은 변형률 1.0 에서의 강도계수의 결과, 즉 변형 률 1.0 에서의 유동응력을 정리하였고, Table 3 에 Fig. 6(b)의 불균일 요소망으로 얻은 결과를 정리하 였다. N=5, M=100 은 요소의 수가 500 으로 비교적 크지 않은 경우에 속하고, N=20, M=200 은 요소의 수가 4000 개이다. 결과에서 보는 바와 같이 요소 의 수가 증가할수록 그리고 네킹이 발생할 영역을 조밀하게 분할할수록 변형률 1.0 에서의 강도계수 는 대체적으로 증가하는 양상을 보이고 있다. 따 라서 개발된 진응력-진변형률 곡선 획득 방법은 수치적으로 매우 안정된 것이며, 인장시험기와 직 접 연계하여 사용이 가능하다고 판단된다.
Fig. 7 True stress-strain curves obtained by the uniform mesh systems shown in Fig. 6(a)
True strain
Tr u e s tr e s s (M P a )
0 0.25 0.5 0.75 1 1.25 1.5
0 200 400 600 800 1000
10*50 15*50 20*50 10*100 15*100 20*100 10*150 15*150 20*150 10*200 15*200 20*200
0.999995 1 1.00001
595 600 605
10*50
15*50
20*50
10*100
15*100
20*100
10*150
15*150
20*150
10*200
15*200
20*200
Fig. 8 True stress-strain curves obtained by the non-uniform mesh systems shown in Fig. 6(b) Fig. 7 과 Fig.8 에서 보는 바와 같이 네킹이 발생 할 가능성이 많은 영역에서 조밀하게 분할된 요소 망, 즉 Fig. 6(b)의 불균일 요소망에 의한 결과가 보다 수치적으로 안정적임을 알 수 있으며, 변형 률 1.0 을 기준으로 볼 때, 유동응력이 609.0 에 수 렴함을 알 수 있다. 이를 기준 값으로 간주할 때, 본 연구에서 취한 요소망 중 최악조건, 즉 균일 요소망의 최저요소(5X100)로 예측한 결과는 기준 값과 0.7%의 차이밖에 나지 않았다. 이 크기는 단 조 시뮬레이션에서 추구하는 허용 오차 이내에 있 다고 사료된다. 따라서 인장시험과 유한요소법을 이용한 고변형률에서의 진응력-진변형률 곡선 획 득 방법은 수치적으로 매우 안정되어 있음을 알 수 있다.
4. 결 론
본 연구에서는 인장시험과 유한요소법에 바탕을 둔 인장시험을 정확하게 예측하는 진응력-진변형 률 곡선의 획득방법을 소개하였으며, 이 방법의 수치적 특성을 상세하게 조사하였다. 이를 위하여 두 가지 형태의 요소망과 다양한 요소밀도를 갖는 요소망으로 진응력-진변형률을 구하여 그 결과를 상세하게 비교하였다.
그 결과, 개발된 방법은 수치적으로 매우 안정 하며, 계산시간이 많이 소요되지 않으므로 인장시 험와 연계하여 활용이 가능할 것으로 판단된다.
후기
본 연구는 산업자원부의 지역혁신인력양성사업, 2 단계 BK21 사업의 일환으로 실시된 연구 결과의 일부임.
참고문헌
True strain
Tr u e s tr e s s (M P a )
0 0.25 0.5 0.75 1 1.25 1.5
0 200 400 600 800 1000
10*50 15*50 20*50 10*100 15*100 20*100 10*150 15*150 20*150 10*200 15*200 20*200
0.999995 1 1.00001
595 600 605
10*50 15*50 20*50 10*100 15*100 20*100 10*150 15*150 20*150 10*200 15*200 20*200
(1) Mirone, G.., 2004, “A new model for the elastoplastic characterization and the stress-strain determination on the necking section of a tensile specimen,” Int. J.
Solids Struct., Vol. 41, pp. 3545∼3564.
(2) Zhang, K. S., 1995, “Fracture predicition and necking analysis,” Eng. Fract. Mech., Vol. 52, pp. 575∼582.
(3) Komori, K., 2002, “Simulation of tensile test by node separation method,” J. Mat. Proc. Tech., Vol. 125-126, pp. 608∼612.
(4) Cabezas, E. E. and Celentano, D. J., 2004,
“Experimental and numerical analysis of the tensile test using sheet specimens,” Finite Elem. Anal. Des., Vol. 40, pp. 555 ∼ 575.
(5) Koc, P. and Ṧ tok, B., 2004, “Computer-aided identification of the yield curve of a sheet metal after onset of necking,” Comp. Mat. Sci., Vol. 31, pp. 155
∼168.
(6) Bridgman, P. W., 1956, “Studies in large flow and fracture,” McGraw-Hill.
(7) Zhang, Z. L., Hauge, M. J., Ødegård and Thaulow, C., 2001, “Determinating material true stress-strain curve from tensile specimens with rectangular cross- section,” Comp. Mat. Sci., Vol. 20, pp. 77∼85.
(8) Lee, C. H. and Altan, T., 1972, “Influence of flow stress and friction upon metal flow in upset forging of ring and cylinders,” ASME Trans., J. Eng. Ind., Vol.
94, p. 782.
(9) Dumoulin, S., Tabourot, L., Chappuis, C., Vacher, P.
and Arrieux, R., 2003, “Determination of the Equivalent Stress-Equivalent Strain Relationship of a Copper Sample under Tensile Loading,” J. Mat.
Process. Technol., Vol. 133, pp. 79-83.
(10) Osakada, K., Shiraishi, M., Muraki, S. and Tokuoka, M., 1991, “Measurement of flow stress by the ring compression test,” JSME Int. J., Series A, Vol. 34, NO. 3, pp. 312∼318.
(11) Gelin, J. C. and Ghouati, O., 1995, “The inverse approach for the determination of constitutive equations in metal forming,” Annals of CIRP, Vol. 44, No. 1, pp. 189∼192.
(12) Michino, M., Tanaka, M. and Kitaoka, T., 1996,
“Determination of flow stress by inverse analysis
using FEM,” J. JSPT, Vol. 37, No. 421, pp. 219∼224.
(13) Choi, Y., Kim, B. M. and Choi, J. C., 1997, “A method of determining flow stress and friction factor by the ring compression test,” KSME Spring annual
Meeting, pp. 547∼552.(14) Haggag, F. M., Nanstad, R. K., Hutton, J. T., Thomas, D. L. and Swain, R. L., 1990, “Use of automated ball indentation testing to measure flow properties and estimate fracture toughness in metallic materials, Application of Automation Technology to Fatigue and Fracture Testing,” ASME STP 1092, pp.
188∼208.
(15) Cheng, Y. T. and Cheng, C. T., 1999, “Can stress- strain relationships be obtained from indentation curves using conical and pyramidal indenters?,” J.
Mater. Res., Vol. 14, pp. 3493∼3496.
(16) Huber, N. and Tsakmakis, C., 1999, “Determination of constitutive properties from spherical indentation data using neural networkings. Part Ⅰ: the case of pure kinematic hardening in plasticity laws,” J. Mech.
Phys. Solids, Vol. 47, pp. 1569∼1588.
(17) Huber, N. and Tsakmakis, C., 1999, “Determination of constitutive properties from spherical indentation data using neural networkings. Part Ⅱ: plasticity with nonlinear isotropic and kinematic hardening,” J.
Mech. Phys. Solids, Vol. 47, pp. 1589∼1607.
(18) Nayebi, A., Abdi, R. El., Bartier, O. and Mauvoisin, G., 2002, “New procedure to determine steel mechanical parameters from the spherical indentation technique,” Mech. Materials, Vol. 34, pp. 243∼254.
(19) Lee, H., Lee, J. H. and Pharr, G. M., 2005, “A numerical approach to spherical indentation techniques for material property evaluation,” J. Mech.
Phys. Solids, Vol. 53, pp. 2037∼2069.
(20) Campitelli, E. N., Spätig, P., Bonadé, R., Hoffelner, W. and Victoria, M., 2004, “Assessment of the constitutive properties from small ball punch test:
experiment and modeling,” J. Nuclear Materials, Vol.
335, pp. 366∼378.
(21) Husain, A., Sehgal, D. K. and Pandey, R. K., 2004,
“An inverse finite element procedure for the determination of constitutive tensile behavior of materials using miniature specimen,” Comp. Mat. Sci., Vol. 31, pp. 84∼92.
(22) Isselin, J., Iost, A., Golel, J., Najjar, D. and Bigerelle, M., 2006, “Assessment of the constitutive law by inverse methodology: small punch test and hardness,” J. Nucl. Mater., in press.
(23) Bressan, J. D., Unfer, R. K., 2006, “Construction and validation tests of a torsion test machine,” J.
Mater. Process. Technol., in press.
(24) Springmann, M. and Kuna, M., 2005, “Indentification of material parameters of the gurson-tvergaard- needleman model by combined experimental and numerical techniques,” Comp. Mat. Sci., Vol. 32, pp.
501∼509.
(25) Joun, M. S., et al., “Finite Element Analysis of Tensile Testing with Emphasis on Necking,” Comp.
Mat. Sci., in press.