Print ISSN: 2288-4637 / Online ISSN 2288-4645 doi:10.13106/jafeb.2020.vol7.no9.439
1
First Author. Professor, Faculty of Liberal Arts, Eulji University, Korea. Email: [email protected]
2
Corresponding Author. Professor, Faculty of Liberal Arts, Eulji University, Korea [Postal Address: 553, Sanseong-daero, Sejeong- gu, Seongnam-si, 13135, Korea] E-mail: [email protected]
© Copyright: The Author(s)
This is an Open Access article distributed under the terms of the Creative Commons Attribution Non-Commercial License (https://creativecommons.org/licenses/by-nc/4.0/) which permits unrestricted non-commercial use, distribution, and reproduction in any medium, provided the original work is properly cited.
A Study on the Effects of Business Service Quality on Satisfaction, Commitment, Performance, and Loyalty at a Private University
Hyuk Jin LEE
1, Myeong Hee SEONG
2Received: June 29, 2020 Revised: July 27, 2020 Accepted: August 10, 2020
Abstract
The purpose of this study is to investigate the impacts of business service quality on satisfaction, commitment, performance, and loyalty in higher education. A survey was given to undergraduates involved in business through employment and start-up companies at a private university in Korea. With 252 respondents, this study used exploratory factor analysis and reliability analysis to verify the reliability and validity of measured variables. Multiple regression was employed as a statistical method for the hypotheses of the study. The research questions were: 1) How do education SERVQUAL factors (tangibles, responsiveness, reliability, assurance, and empathy) affect customer satisfaction? 2) How do education SERVQUAL factors affect customer commitment? 3) How does customer satisfaction or commitment affect education performance? 4) How does customer satisfaction, commitment or performance affect their loyalty in higher education?
The findings show that most dimensions of business service quality have effects on satisfaction and commitment, and satisfaction and commitment have a positive effect on performance. Additionally, satisfaction, commitment and performance all have an effect on loyalty.
This study confirmed the need for the improvement of business service quality in a private university. Additionally, it highlighted the importance of user satisfaction, commitment and performance in order to increase the loyalty level of undergraduate students.
Keywords: Business Service Quality, Satisfaction, Commitment, Performance, Loyalty, Private University, Korea JEL Classification Code: A22 I21 I23 M31
In the context of higher education, a common belief is that universities that provide strong employment opportunities for graduates are top universities. This has emerged as an important success factor for private universities. With this in mind, private institutes of higher learning are interested in creating business related services that can contribute to creative thinking and can help students obtain the knowledge and skills needed for employment. A private university’s educational service is an important business that enables students, who are the consumers, to realize material and mental satisfaction, and to contribute to maximizing their achievement.
The quality of educational business services has been studied based on SERVQUAL as suggested by Parasuraman, Zeithaml, and Berry (1985, 1988). Service quality has been increasingly recognized as a critical factor in the success of any experiential education (Park & Kim, 2012). The service quality in the field of education and higher learning particularly is not only essential and important, but it is also an important parameter of business excellence (Azam, 2018).
Private Korean universities are striving to provide excellent business service quality in order to realize the ultimate goal of
1. Introduction
Service quality is defined as the ability of an organization
to meet or exceed customer expectations (Parasuraman,
Zeithaml, & Berry, 1985). Empirical research measuring
service quality has been conducted within various social
science disciplines in the fields of business administration
and marketing. Private educational facilities can also be
viewed from a marketing perspective in terms of a customer
relationship. A private university’s business success can be
affected by the quality of its educational services, which also
affects customer satisfaction.
fostering talented professionals. In addition, they are actively interested in helping students find meaningful employment by providing courses related to careers, business, and start- ups. The topic of measuring service quality has been studied widely in the past few decades (Kahlah, Amina, & Kahlah, 2012). So far, studies on the application of service quality have mainly focused on business research and marketing.
However, there have been several studies on service quality applied to higher education. These studies used business service quality as an important independent variable for the success of educational institutions (Abu Hasan, Ilia’s, Abd Rahman, & Abd Razak, 2008; Al-Alek & Lamasery, 2012; Azam, 2018; Eres & Clothe, 2013; Kahlah, Amina, & Kahlah, 2012;
Khodadadi & Khodadadi, 2011; Prentice, McLaughlin, & Brady, 2018; Yousapronpaiboon, 2014).
Today, universities are highly interested in employment, start-up, and business-related education services as a way to help students develop convergence knowledge to prepare for the fourth industrial revolution and overcome the current employment problems. Private universities are even more desperate to utilize these programs. These practical education courses are based on business subjects such as economics, accounting, finance, and distribution. They also include courses that can help students learn about start-ups and find employment after graduation.
This study was conducted with the goal of changing the needs of private universities, while recognizing the importance of implementing excellent service quality and maximizing student satisfaction. This study aims to identify the impact of important variables on service quality. The purpose of this research is to analyze the impacts that service quality has on satisfaction, commitment, performance, and loyalty for students at a private university in Korea. Surveys were conducted to identify the following research questions:
1) How do education SERVQUAL factors (tangibles, responsiveness, reliability, assurance, and empathy) affect customer satisfaction? 2) How do education SERVQUAL factors affect customer commitment? 3) How does customer satisfaction or commitment affect education performance?
4) How does customer satisfaction, commitment or performance affect their loyalty in higher education?
2. Theoretical Background 2.1. Service Quality
According to Parasuraman, Zeithaml, and Berry (1985), the term ‘service quality’ was described as the ability of an organization to meet or exceed customer expectations. They identified the first 10 determinants (Tangibles, Reliability, Responsiveness, Competence, Access, Courtesy, Credibility,
Security, Communication and Understanding) of service quality that could be generalized to any type of service. And then Parasuraman, Zeithaml, and Berry (1988) regrouped the well-known 5 dimensions of the SERVQUAL model and cataloged 22 items by Tangibles, Assurance, Empathy, Reliability and Responsiveness. Cronin and Taylor (1992), of course, proposed measuring Performance only without Expectation as a service quality, and suggested that SERPERF would be more effective, but SERVQUAL must still be a widely used measure.
From this point of view, many studies have used Parasuraman, Zeithaml, and Berry’s SERVQUAL model to assess service quality in educational institutions. In a study with undergraduates in Iran, Khodayari and Khodayari (2011) examined a gap between Expectations and perceptions among the dimensions of the SERVQUAL, and showed that Reliability, Tangibility, Responsiveness, Assurance and Empathy were important for customers.
Al-Alak and Alnaser (2012) examined the relationship between SERVQUAL dimensions (Tangibles, Responsiveness, Reliability, Assurance and Empathy) and overall service quality satisfaction for undergraduate students in the Faculty of Business at the University of Jordan. Their results indicated that the Assurance and Reliability dimensions of service quality were the two most important for improvement.
Akhlaghi, Amini, and Akhlaghi (2012) found that in the case of technical and vocational colleges, there are quality gaps in all five SERVQUAL dimensions; the largest gap is for Responsiveness and the smallest gap is for Reliability.
Yousapronpaiboon (2014), in a study with undergraduates from a private university in Thailand, found that in all 5 dimensions of SERVQUAL, a gap was observed between undergraduates’ perceptions and expectations. In this case, higher education did not meet the expectations of these undergraduates.
This SERVQUAL model is one of the most commonly used models for evaluating expectations and perceptions of service quality (Azam, 2018; Seng & Ling, 2013;
Yousapronpaiboon, 2014). These 5 dimensions are identified as follows:
First, Tangibles refers to the appearance of physical facilities, equipment, personnel and communication materials.
Second, Responsiveness refers to the willingness to help customers and to provide prompt service.
Third, Reliability refers to the ability to perform the promised service dependably and accurately.
Fourth, Assurance refers to the knowledge, courtesy of employees and ability to convey trust and confidence in the customer towards the service provider.
Fifth, Empathy refers to the provision of caring,
individualized attention provided to customers.
2.2. Satisfaction
Satisfaction has been defined as a psychological state after experiencing products and services of enterprise with static and continuous emotions (Oliver, 1980). The concept of Satisfaction has been approached primarily in the marketing field in the sense of customer satisfaction, and the definition of customer satisfaction and factors affecting Satisfaction have been studied in a number of works of literature (Lee, Jung, & Seong, 2019).
According to Kotler, Armstrong, and Wong (2000), customer satisfaction was defined as a person’s feelings of pleasure or disappointment resulting from comparing a product or perceived performance in relation to expectations.
From a similar perspective, many studies have investigated Satisfaction as a leading factor to forecast a customer’s future behavioral intentions (Koo, 2005; Kwon & Yu, 2014;
Lee & Bea, 2006; Lee, Jung, & Seong, 2019, Lee & Lee, 2018; Sung, Kim, & Youn, 2014).
From a higher education perspective, satisfaction is shaped by students’ expectations. Elliott and Shin (2002) expressed that student satisfaction is continually shaped by various outcomes and their experiences on campus. From a similar view, in cases of private universities in Albania, Coscun (2014) investigated essential factors on student satisfaction.
Richardson (2005) uses various dimensions to measure the quality of the educational environment and satisfaction. These dimensions included student evaluation of teaching, course modules, perceptions of academic quality and satisfaction.
2.3. Commitment
The concept of Commitment appears in the field of organizational psychology and has mainly been studied in the workplace. It has thus become a very fashionable term in recent years in the field of business and has been highlighted in the academic realm (Rodríguez-Izquierdo, 2020). Accordingly, Schaufeli, Martínez, Pinto, Salanova, and Bakker (2002) defined commitment as a state of psychological well-being related to studies that are positive and meaningful. Kahu and Nelson (2018) expressed that it is an evolving concept that encompasses a variety of institutional practices and student behaviors related to satisfaction and achievement, including homework time, adaptability, social and academic integration, and teaching practices.
Christenson, Reschly, and Wylie (2012) argued that Commitment consists of 3 dimensions, behavioral commitment (how students are involved in learning in aspects such as effort), emotional commitment (the positive emotions that the student experiences during the learning process, such as euphoria), and cognitive commitment (cognition related to the use of effective learning strategies).
Schaufeli, Martínez, Pinto, Salanova, and Bakker (2002) found that Commitment consists of 3 dimensions. First, vigor was defined as high levels of energy and mental endurance while studying, characterized by the desire to invest effort in the tasks performed, even when difficulties appear in the process. Second, dedication was described as a high level of involvement in studies, which manifests a feeling of significance, inspiration, enthusiasm, and pride when challenged by the task. Third, absorption was characterized as a high state of concentration and immersion that makes time pass quickly when tasks are performed. Much of the research points to the predictive character of commitment in relation to success and performance (Lutz & Culver, 2010;
Rodríguez-Izquierdo, 2020; Svanum & Bigatti, 2009).
2.4. Performance
Performance, or achievement, is the extent to which a student, teacher or institution has attained their short or long-term educational goals. Student performance in higher education is especially affected by various socioeconomic, psychological, and environmental factors (Hijazi & Naqvi, 2006). In light of this, many papers investigated performance as an important antecedent to forecast students’ future behavior (Akessa & Dhufera, 2015; Mushtaq & Khan, 2012;
Shahzadi1 & Ahmad, 2011). Mushtaq and Khan (2012) explored the important factors that affect the students’
performance, and found that communication, learning facilities, proper guidance and family stress are the factors that affect student performance. Shahzadi1 and Ahmad (2011) conducted a study on the performance of university students and found that there are 4 important factors (home environment, study habits, learning skills and academic interaction) which affect the performance and retention of students in higher education institutions.
Like some studies from an education perspective, Shahijan, Sajad, and Guptan (2018) found that performance is affected by student’s satisfaction, and Pintrich and De Groot (1990) found that commitment is linked to customer outcome including performance. Also, Rojas-Mendez, Vasquez- Parraca, Kara, and Cerda-Urrutia (2009) found performance as an important factor leads to customer’s loyalty.
2.5. Loyalty
Customer loyalty has been studied by many researchers
as it is an important strategic goal of a company and it is
an important factor of customer satisfaction in the service
industry (Shin, Hwang, Lee, & Cho, 2015). Czepiel and
Gilmore (1987) viewed Loyalty as a result of a dynamic
emotional process and stated that Loyalty is a tendency
supported by commitment, a positive attitude, previous
knowledge, consentience, and trust.
In marketing related research, loyalty is analyzed as a component of one (general loyalty), two (attitudinal and behavioral) or four dimensions (cognitive, affective, conative, action). Based on this approach, loyalty models were approached and tested (Bobalca, Gatej(Bradu), &
Ciobanu, 2012; Evanschitzky & Wunderlich, 2006; Harris
& Goode, 2004; McMullan & Gilmore, 2002; Oliver, 1999).
In educational business, loyalty requires developing a strong relationship with students who eventually provide the financial basis for university activities (Henning-Thurau, Langer, & Hansen, 2001). Rojas-Mendez, Vasquez-Parraca, Kara, and Cerda-Urrutia (2009) explained student loyalty in higher education institutions by examining key factors influencing loyalty, PSQ (Perceived Service Quality), Satisfaction, Trust, and Commitment. These factors were examined within a model that is assumed to be comprehensive enough to explain loyalty.
Kang, Song, and Hwang (2013) viewed loyalty as a student’s behavioral intention, such as pride in the university that students feel, active promotion of classes, and the recommendations of friends. With this in mind, student loyalty can be used as a critical measure in the business success of higher education institutions that aim to retain students until graduation.
3. Research Method 3.1. Research Model
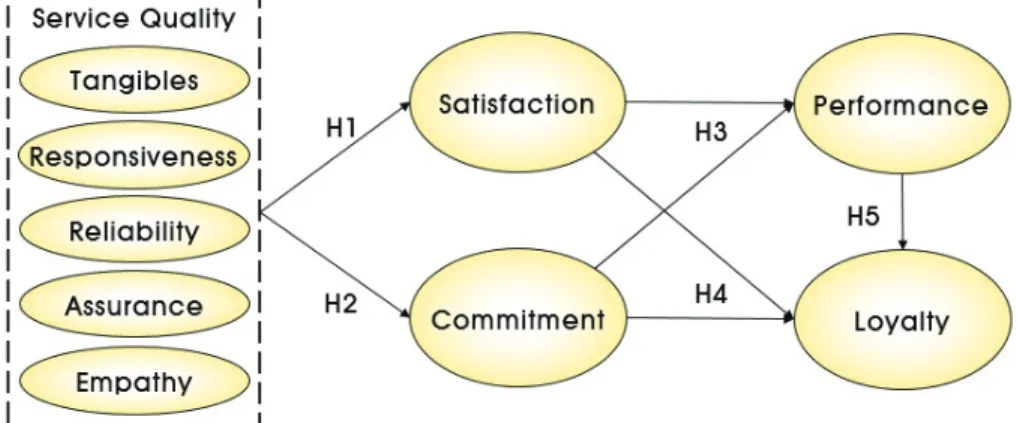
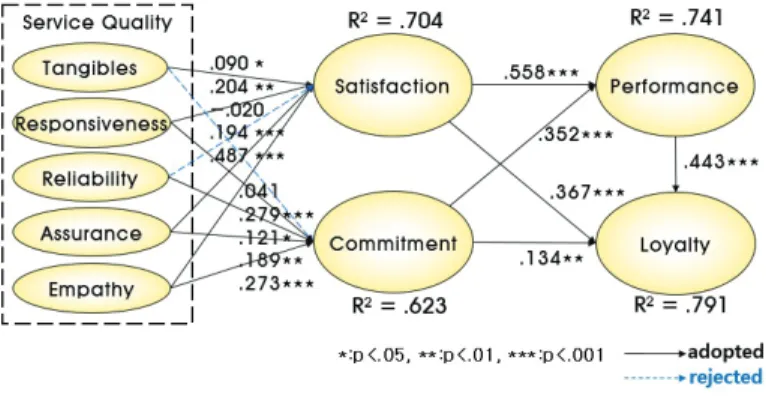
Based on the review above, the proposed model is shown in Figure 1. This study adopted Parasuraman, Zeithaml, and Berry (1988)’s approach, and the dimensions of SERVQUAL were defined as the ability of higher education organizations to meet or exceed undergraduates’ expectations.
In this study, SERVQUAL was measured by 5 all dimensions, Tangibles, Responsiveness, Reliability, Assurance and Empathy. Satisfaction, Commitment and Performance are
used as meaningful mediating variables, and factors of these variables are measured by multidimensional scales. Loyalty is used as the most important dependent variable in this study.
3.2. Research Hypothesis
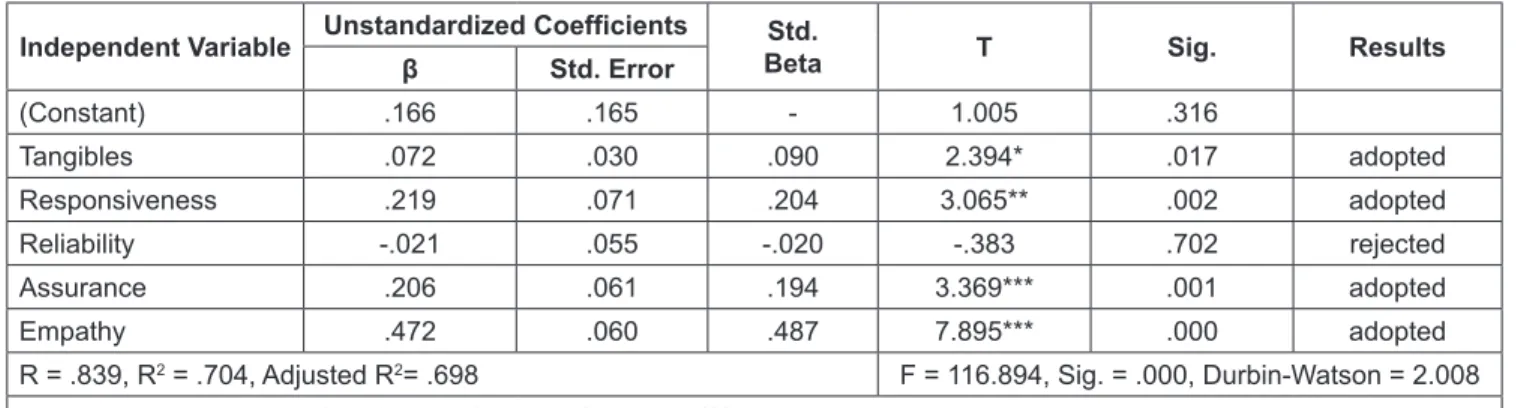
3.2.1. The Impact of Service Quality on Satisfaction
For this study, dimensions of service quality can be used as independent variables, because they play an important role in the academic success of undergraduates and raising the reputation of universities. Several research papers have indicated that positive perceptions of service quality have a significant influence on satisfaction (Alves & Raposo, 2010), and that positive perceptions of service quality have a significant influence on commitment (Ding, Hu, Verma, &
Wardell, 2010; Rodríguez-Izquierdo, 2020).
Abu Hasan et al. (2008) hypothesized about the relationship between service quality and satisfaction in private higher education institutions. From a similar view, the research of students in a public university in Ghana, Mattah, Kwarteng, and Mensah (2018) found positive relationships among education service quality, satisfaction and loyalty. In the case of a private university in Ireland, Prentice, McLaughlin, and Brady (2018) studied the relationships between service quality, value and satisfaction on student customer intentions and behavior, and found that perceptions of good service quality will have a significant positive impact on satisfaction. In a study of Saudi Arabian private higher education institutions, Azam (2018) hypothesized about the relationship between service quality dimensions and satisfaction and highlighted that there is a significant relationship among the four dimensions (Assurance, Empathy, Reliability, Responsiveness) and customer satisfaction and behavioral intentions. Thus, the following hypotheses can be set up.
Figure 1: Research Model
H1: Service quality has a positive effect on satisfaction.
H1-1: Tangibles of service quality have a positive effect on satisfaction.
H1-2: Responsiveness of service quality has a positive effect on satisfaction.
H1-3: Reliability of service quality has a positive effect on satisfaction.
H1-4: Assurance of service quality has a positive effect on satisfaction.
H1-5: Empathy of service quality has a positive effect on satisfaction.
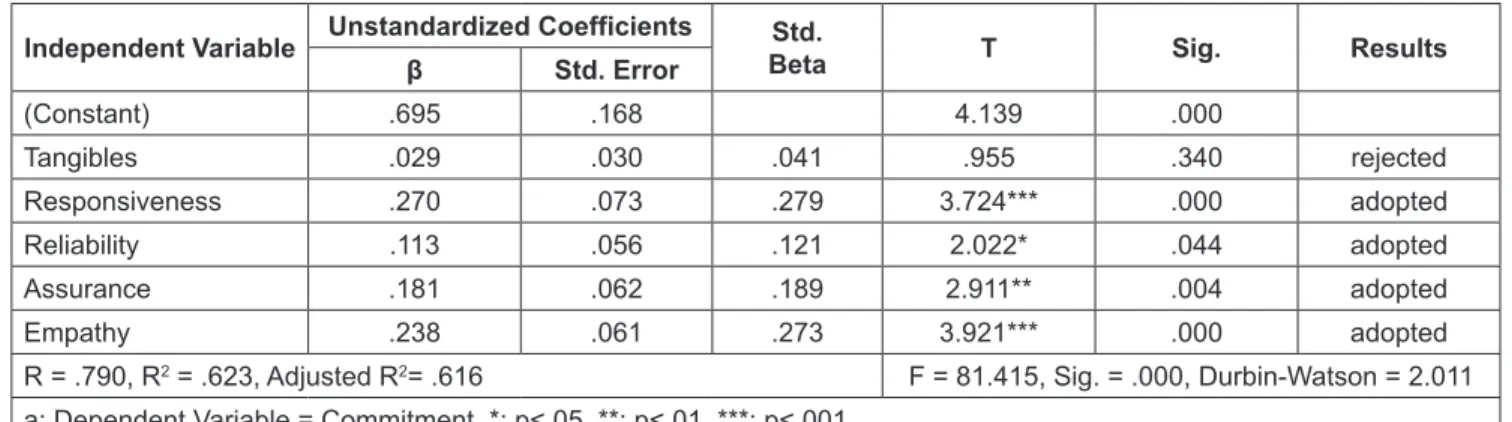
3.2.2. The Impact of Service Quality on Commitment From a similar perspective, Sumardi and Fernandes (2018) analyzed the relationship between management process alignment, service quality, organizational commitment and high performance. They found that the mediation variables have significant effects on service quality and organizational commitment. Additionally, there is a relationship between management process alignment and high educational performance in Makassar, Indonesia.
Trivellas and Santouridis (2014) studied the relationship between service quality and organizational commitment in higher education and found that good service quality will have a significant positive impact on commitment. Thus, the following hypotheses can be set up.
H2: Service quality has a positive effect on commitment.
H2-1: Tangibles of service quality have a positive effect on commitment.
H2-2: Responsiveness of service quality has a positive effect on commitment
H2-3: Reliability of service quality has a positive effect on commitment.
H2-4: Assurance of service quality has a positive effect on commitment.
H2-5: Empathy of service quality has a positive effect on commitment.
3.2.3. The Impact of Satisfaction and Commitment on Performance
Several studies were carried out to explore factors affecting university students’ performance. In general, students’ performance in higher education is affected by various socioeconomic, psychological, and environmental factors (Hijazi & Naqvi, 2006). More recent efforts have examined student satisfaction, commitment, achievement, and behavioral intention independently as measures of students’ success (Hoffman & Lowitzki, 2005). As in the study on the experiential model of international students’
satisfaction and performance, Shahijan, Sajad, and Guptan
(2018) reported that performance is affected by different factors such as university image, students’ expectations and experience, service quality, and degree of satisfaction, and stated that there is a positive linkage between satisfaction and performance.
From a similar point of view, commitment has been linked to many beneficial outcomes including performance (Pintrich & De Groot, 1990). Spedding, Hawkes, and Burgess (2017) found a positive relationship between commitment and performance. Thus, the following hypotheses can be set up.
H3-1: Satisfaction has a positive effect on performance.
H3-2: Commitment has a positive effect on performance.
3.2.4. The Impact of Satisfaction, Commitment and Performance on Loyalty
Loyalty involves a process in which a customer’s cognition, affect, conation, and behavior take place (Oliver, 1999). Mattah, Kwarteng, and Mensah (2018) found a positive relationship between satisfaction, commitment and loyalty from the research of students in a public university in Ghana. Annamdevula and Bellamkonda (2016) proposed a mediation model that links service quality and student loyalty via student satisfaction by the survey from three oldest state universities in India. They found effects of service quality on student loyalty with the mediator satisfaction. From the research, satisfaction is considered as a mediating variable.
In educational business, loyalty can be used as a critical measure in the success of higher education institutions.
Antecedents of loyalty, such as service quality, motivation, satisfaction, trust, and commitment have been identified in previous research (Lee & Lee, 2018; Rodríguez-Ardura and Meseguer-Artola, 2017; Rojas-Mendez, Vasquez-Parraca, Kara, & Cerda-Urrutia, 2009; Song & Kim, 2012).
This procedure was designed to explain loyalty in higher education institutions by examining key factors.
Satisfaction, Commitment and Performance were examined within a model that is assumed to be comprehensive enough to explain Loyalty. Thus, the following hypotheses can be set up.
H4-1: Satisfaction has a positive effect on loyalty.
H4-2: Commitment has a positive effect on loyalty.
H5: Performance has a positive effect on loyalty.
3.3. Sample and Data Collection
To carry out this research, a survey was conducted on
undergraduates involved in business at E. university in
Korea. This university is a private university located in
Gyeonggi province that aims to develop medical-health
care. The university operates convergence medical business departments that include a number of subjects that help students broaden their knowledge about careers and find employment.
A questionnaire was given to students during the last week of the Fall 2019 semester. A total of 280 students, (about 40 students per class) taking 8 courses related to business administration, responded to the questionnaire. These courses include introduction to management, economics, accounting, distribution, practical finance, employment information search, venture start-up, and entrepreneurship. The survey was conducted by a self-administered method that requires respondents to fill out the questionnaire directly. Of the 270 total questionnaires collected through the survey, 252 were used for statistical analysis, while 18 were excluded as they were found to be insincere or could not be used as data due to missing parts of the survey. In addition, the statistical program SPSS 22.0 was used for empirical analysis for the paper.
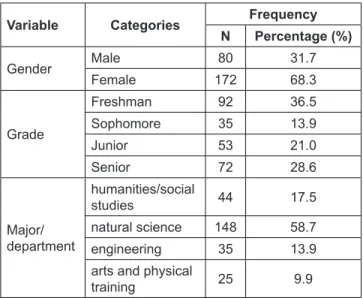
The frequency analysis of the participants (N=252) was conducted to explain demographic characteristics and is presented in Table 1.
Among the survey participants, 68.3% (N=172) reported their gender as female and 31.7% (N=80) as male. This is the same as the student distribution pattern of the university, where there are far more girls out of all students. According to the respondents’ grade distribution, 36.5% (N=92) were freshmen, followed by 28.6% (N=72) seniors, 21.0% (N=53) juniors, and 13.9% (N=35) sophomores. In the survey of respondents’ major departments, 58.7% (N=148) were in natural science, followed by 17.5% (N=44) in humanities/
social studies, 13.9% (N=35) in engineering, and 9.6%
(N=25) in arts and physical training.
Table 1: Demographic Characteristics of the Sample
Variable Categories Frequency
N Percentage (%)
Gender Male 80 31.7
Female 172 68.3
Grade
Freshman 92 36.5
Sophomore 35 13.9
Junior 53 21.0
Senior 72 28.6
Major/
department
humanities/social
studies 44 17.5
natural science 148 58.7
engineering 35 13.9
arts and physical
training 25 9.9
3.4. Measures
In order to measure the constructs in the suggested model, validated measurement items were adapted from literature reviews and slightly revised to ensure their appropriateness for the service quality of private universities in Korea. From the basic data of the study, demographic variables were measured by nominal measures. In addition, the derived items were measured on a 5point Likert-type scale, anchored from strongly disagree (1) to strongly agree (5).
3.4.1. Measures of Service Quality
The dimensions of Service Quality, as it is related to tangibility, assurance, empathy, reliability and responsiveness were measured using 25 items from Al-Alak and Alnaser (2012), Akhlaghi, Amini, and Akhlaghi (2012), Parasuraman, Zeithaml, and Berry (1988), Park and Kim (2012), Yousapronpaiboon (2014).
First, as for tangibles, the study used 5 items including
‘The business class is well-organized with an external environment’, ‘The business class is equipped with proper facilities and equipment for education’, ‘Equipment and facilities work well for the business class’, ‘The overall atmosphere of the college’s business education facilities is good’, and ‘Facilities are suitable for taking business related classes’.
Second, as for responsiveness, the study used 5 items including ‘The business class professor answers questions easily’, ‘The business class professor quickly proceeds with feedback on the contents of the education’, ‘The business class professor offers a variety of knowledge as well as the contents of the lecture’, ‘The business class professor provides a variety of information about career and self- development’, and ‘The business class professor is quick to consult and answer questions’.
Third, as for reliability, the study used 5 items including
‘The business class proceeded correctly according to the schedule’, ‘Attendance and evaluation are properly managed in the business class’, ‘Credits are granted fairly and reliably’, ‘The business class starts and ends on time’, and
‘Requirements related to the business class are accurately handled’.
Fourth, as for assurance, the study used 5 items including
‘The business class professor has sufficient knowledge of the education’, ‘The business class professor gives appropriate answers to the questions’, ‘The business class professor’s attitude, words and actions give credibility’,
‘The business class professor’s behavior and lectures are giving me confidence’, and ‘After the business class, I gained confidence in the subject’.
Fifth, as for empathy, the study used 5 items including
‘Contents of the business class reflect the interests of the
students well’, ‘The business class induces discussion participation and is not just a general lecture’, ‘The business class professor understands what the students need’, ‘There is smooth communication with the professor during the business class’, and ‘Contents of the business class are well considered for the position of the students’.
3.4.2. Measure of Satisfaction and Commitment
For satisfaction, 4 items were used including ‘The business class was consistent with what was expected’,
‘The business class was better than expected.’, ‘I am satisfied with the quality level of the professor’s expertise, and teaching ability’ and ‘I am generally satisfied with the business class curriculum.’ These are borrowed From Al-Alak andAlnaser (2012), Ding, Hu, Verma, and Wardell (2010), Lee, Jung, and Seong (2019), Lee and Lee (2018), and Oliver (1980).
Commitment was measured with 6 items adapted from Ding, Hu, Verma, and Wardell (2010), Lee and Lee (2018), and Rodríguez-Izquierdo (2020). These items include ‘I am sure that I have carried out the tasks of this business class properly’, ‘I was able to do as well in the business class as I wanted’, ‘I understood what to learn in the business class’, ‘I concentrated on the material in this business class’, ‘The contents of the business class were not easy, but I could understand it with my ability’, and ‘I was able to complete my assignments without any particular effort’.
3.4.3. Measure of Performance
Performance was measured by 5 items adapted from Akessa and Dhufera (2015), Mushtaq and Khan (2012), Park and Kim (2012), and Shahzadi1 and Ahmad (2011).
These items include ‘The contents and presentation of the business class helped me improve my knowledge’,
‘I felt the need to learn new information through the business class’, ‘I fulfilled my purpose by taking this business class’, ‘I felt my knowledge improved from the business class’, and ‘The business class has helped self-development’.
3.4.4. Measure of Loyalty
Loyalty was measured using 4 items adapted from Bobalca, Gatej(Bradu), and Ciobanu (2012), Kang, Song, and Hwang (2013), and McMullan and Gilmore (2002).
The 4 items include ‘I will recommend the business class to others’, ‘I have been talking positively about the business class’, ‘I will talk about the business class in a good way to others’, and ‘I would like to take another class from the professor if I have a chance’.
4. Results
4.1. Verification of the Reliability and Validity In order to analyze the reliability and validity of the questionnaire measurement, Exploratory Factor Analysis and Cronbach’s α were verified (Choi & Lee, 2019). Cronbach’s α is widely known as an internal consistency estimate of the reliability of test scores. The extraction of factor analysis was based on principal component analysis. The rotation of the factors was conducted to maintain independence among the factors and to simplify the loading of each factor by using the varimax method, which is an orthogonal rotation method. A factor loading greater than 0.5 can be considered a significant variable.
4.1.1. Analysis of the Reliability and Validity of Independent Variables
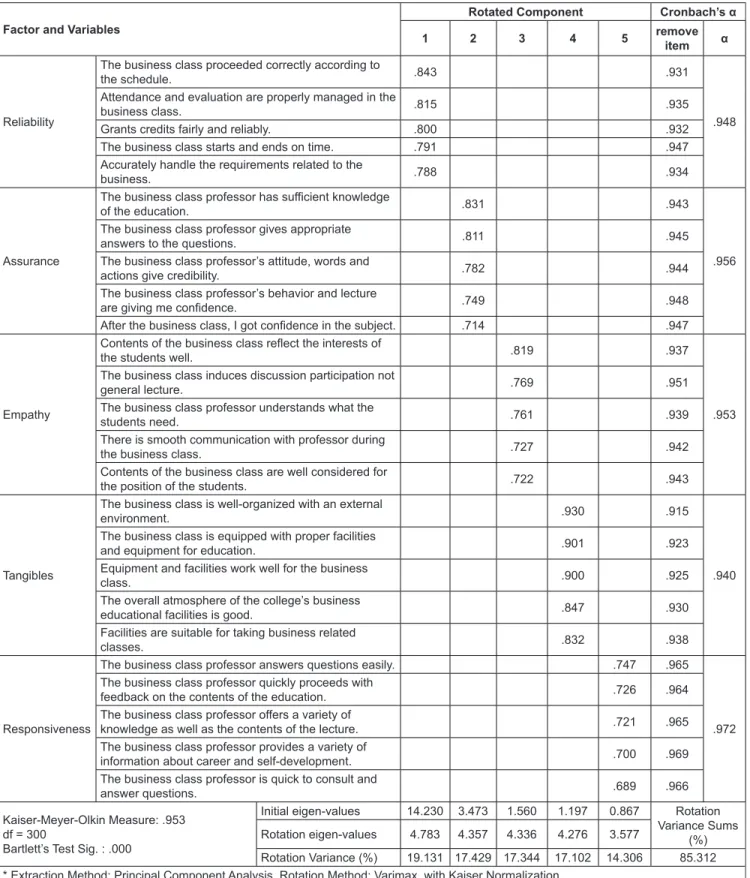
This study conducted an Exploratory Factor Analysis to verify the validity of 25 independent variables of the educational service quality. As a result, 5 factors were extracted as shown in Table 2. These factors explain 85.312%
of the total variance. The KMO value was used as a coefficient that verifies the suitability of the sample size, and it was high at 0.953 (df=300). Bartlett’s test indicated that data were sufficient to proceed for the factor analysis, because correlation between variables was statistically significant (p<0.001).
The reliability analysis of independent variables (educational service quality) shows that Cronbach’s α coefficient for factor 1 (reliability) is 0.948, factor 2 (assurance) is 0.956, factor 3 (empathy) is 0.953, factor 4 (tangibles) is 0.940, and factor 5 (responsiveness) is 0.972, and all of them were high values. Measuring variables using this study were applied similarly to those of existing studies. As a result, it was confirmed that values on the educational service quality were obtained as indicators of the validity (convergent and discriminant validity) and the reliability of variables.
4.1.2. Analysis of the Reliability and Validity of Mediating and Dependent Variables
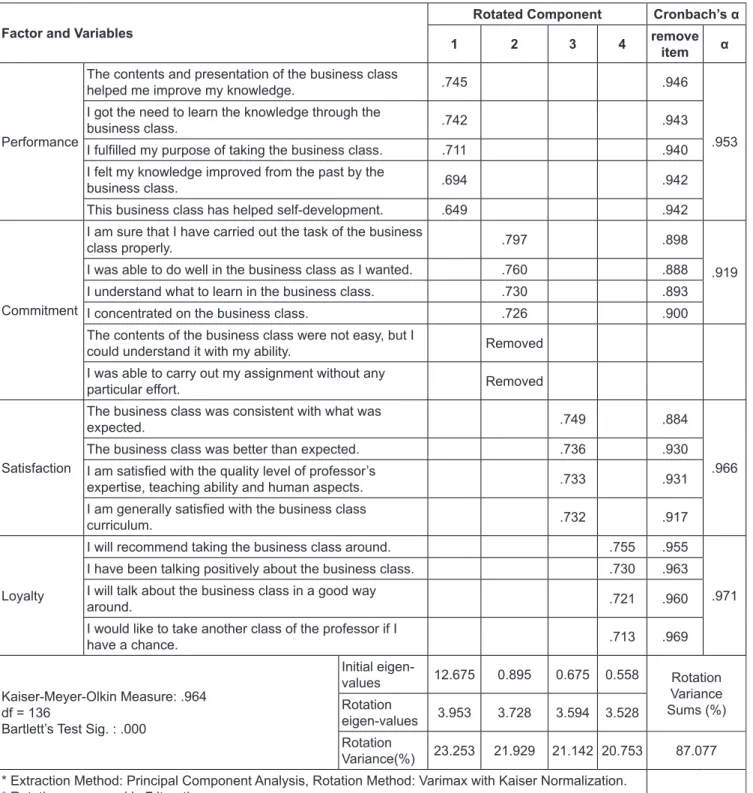
This study conducted an exploratory factor analysis to
verify the validity of 15 mediating variables: satisfaction
(4), commitment (6), performance (5) and 4 dependent
variables (loyalty) of the educational service quality. As a
result, 4 factors were extracted as shown in Table 3. These
factors explain 87.077% of the total variance. The KMO
value was used as a coefficient that verifies the suitability
of the sample size, and it was high at 0.964 (df=136). Also
Bartlett’s test indicated that data were sufficient to proceed
for the factor analysis, because correlation between variables
was statistically significant (p<0.001).
Table 2: Analysis of the Validity and Reliability of Independent Variables
Factor and Variables Rotated Component Cronbach’s α
1 2 3 4 5 remove
item α