소나무잎을 Passive Air Sampler로 이용하여 지역별 대기 중 다환방향족 탄화수소의 농도 및 발생원 추정
천만영† 한경대학교 환경공학과
Estimation of Atmospheric PAH Concentrations and Sources at Several Sites Using Pine Needles as a Passive Air Sampler
Man-Young Chun†
Department of Environmental Engineering, Hankyung National University, Anseong, Korea
ABSTRACT
Objectives: This study was carried out in order to estimate atmospheric polycyclic aromatic hydrocarbon (PAH) concentrations and sources using pine needles as a passive air sampler (PAS) in urban (Pyeongtaek), semirural (Anseong) and rural (Jincheon) sites.
Methods: One-year-old pine needles were collected for analysis of their PAH concentrations (Cp, ng/g dry) at the end of December. PAHs concentrations in the ambient air (Ca, ng/m3) were calculated with a Log(Cp/Ca)-LogKoa
correlational equation.
Results: PAHs concentrations in ambient air (Ca) were high, in the order of urban (114.03 ng/m3), semirural (105.17 ng/m3) and rural (61.91 ng/m3) sites. However, distributions of PAH isomer concentrations were very similar. PAHs of which molecular weight is smaller than 228.30 (AcPy, Acp, Flu, Phen, Ant, Flt, Pyr, BaA, Chry) made up most of the PAHs in the ambient air (96.6-98.5%).
Conclusion: At urban, semirural and rural sites, it was concluded that the main source of PAHs in the ambient air ratio of each PAH isomer concentration was cars, especially diesel vehicles.
Keywords: Air, Pine needles, PAHs, Passive air sampler (PAS), Log (Cp/Ca)-LogKoa
1. 서 론
다환방향족 탄화수소(polycyclic aromatic hydrocarbons, PAHs)는 주로 화석연료를 포함한 유기물의 불완전 연소에 의하여 생성되는데 그중 일부분은 강한 발암 성과 돌연변이성을 가지고 있어서 많은 연구와 관심 의 대상이 되고 있다.1-3) PAHs는 대기를 통하여 장 거리 이동되며 반휘발성 유기화합물(semivolatile organic compounds, SOCs)이므로 강우 시나 기온이
낮아지면 대기로 부터 식물, 토양, 수계에 건식 및 습식 침착되고 또 기온이 높아지면 이들 환경매체로 부터 대기 중으로 휘발된다. 그러므로 대기는 PAHs 가 장거리 이동되는 매개체 역할을 하며 대기 중 PAHs 농도를 아는 것은 PAHs의 환경 중에서의 순 환을 이해하는데 대단히 중요하다.4)
대기 중 PAHs 농도를 측정하기 위해서는 능동형 시료채취기(active air sampler, AAS)와 수동형 시료 채취기(passive air sampler, PAS)를 사용한다. AAS
†Corresponding author: Department of Environmental Engineering, Hankyung National University, Tel : +82-31-670- 5172, Fax : +82-31-673-2704, E-mail : [email protected]
Received: 7 November 2013, Revised: 4 December 2013, Accepted: 10 December 2013
는 전통적으로 많이 이용되고 있는 polyurethane foam (이하 PUF) sampler인데 PUF sampler는 고가 일 뿐만 아니라 가동시 전원이 필요하므로 여러 장 소에서 동시에 대기시료를 채취하거나 전원을 이용 할 수 없는 지역에서는 사용이 어렵다. PAS는 많은 장소에서 동시에 대기시료를 채취하여야 할 경우나 전원이 공급되지 않는 외딴지역에서 대기시료를 채 취하여야 할 경우 많이 이용된다.5-10)
지금까지 대기 중 PAHs의 PAS로 많이 사용되는 것 중 자연계에서 채취할 수 있는 것으로는 나뭇잎, 나무껍질, 이끼 및 토양 등이 있다. 나뭇잎, 나무껍 질, 이끼 및 토양 등은 채취하기가 편리하고 경제적 이지만 PAS에 침착된 PAHs 농도로 대기 중 PAHs 농도를 추정하는 것이 어렵다는 단점이 있었다.5-12) 이러한 이유로 최근에는 보호용기(shelter) 안에 PUF disk와 XAD-2 resin을 충진한 PAS, Triolein [C3H5
(OCOC17H33)3]을 충진한 semipermeable membrane device (SPMD) PAS를 개발하여 대기 중 PAHs 농 도를 추정하는데 이용하고 있다.11,12) 그러나 이러한 PAS 역시 PUF sampler만큼 고가의 장비는 아니더 라도 제작단가가 비교적 높고 시료채취 전에 흡착 제를 세척하여야 하며 시료 채취를 위하여 sampler 의 설치와 수거를 해야 하는 번거로움이 있다. 그러 나 나뭇잎, 나무껍질, 이끼 및 토양 등을 PAS로 이 용하는 biomonitoring 방법은 보호용기의 제작이나 흡착제의 세척 같은 예비단계가 필요 없고, 언제 어 디서나 시료의 채취가 가능하여 매우 편리하고 경 제적이므로 나뭇잎, 나무껍질, 이끼 및 토양에 침착 된 PAHs 농도를 이용하여 대기 중 PAHs 농도 추 정이 가능하다면 나뭇잎, 나무껍질, 이끼 및 토양은 아주 좋은 PAS가 될 수 있다.5-10) 특히 자연계에서 채취가 가능한 PAS 중에서도 소나무잎은 세계의 많 은 지역에 자생하고 있어 시료의 채취가 용이하고 다른 수종보다 잎의 상피(cuticle)에 왁스(wax)가 많 아 친유성인 PAHs의 침착이 쉽다. 또 소나무잎은 다년생이며 대기 중 PAHs가 잎에 누적 침착되므로 장기간의 대기 중 PAHs 농도변화에 대한 정보를 얻 을 수 있고, 상록수로서 겨울에도 시료 채취가 가능
하다.15,16) 그러므로 대기 중 PAHs 농도와 소나무잎
에 침착된 PAHs 농도 사이의 상관식만 알 수 있다 면 소나무잎은 가장 좋은 대기 중 PAHs의 PAS로 사용이 가능하다.
최근 천17)은 새로 잎이 나올 때부터 소나무잎에 침 착된 PAHs 농도(Cp)와 대기 중 PAHs 농도(Ca)를 장 기간 동시에 측정하고 두 값 사이의 관계를 연구한 결과 Log(Cp/Ca)와 옥탄올-공기 분배계수(octanol-air partitioning coefficient, Koa)의 대수값(LogKoa) 사이 에는 큰 상관성이 있다는 사실을 밝혔다. Log(Cp/ Ca)-LogKoa 사이의 상관식을 이용하면 소나무잎 중 PAHs 농도(Cp)를 사용하여 대기 중 PAHs 농도(Ca) 를 계산할 수 있으므로 소나무잎은 대기 중 PAHs 의 PAS로 사용이 가능하다.
이 연구는 소나무잎을 대기 중 PAHs의 PAS로 이 용하여 지역적 특성이 서로 다른 세 지역(도시지역, 도농복합지역 및 농촌지역)의 대기 중 PAHs 농도를 계산하고 각 지역의 PAHs 발생원을 규명함으로 소 나무잎이 대기 중 PAHs의 PAS로 사용이 가능한지 를 알아 본 것이다 .
II. 재료 및 방법
1. 시약
정제용 내부표준물질(internal surrogate standard;
naphthalene-d8, acenaphthene-d10, anthracene-d10, chrysene-d12, perylene-d12)과 첨가용 내부표준물질 (recovery surrogate standard; 4,4'-dibromooctafluo- robiphenyl)은 Supelco (Bellefonte, PA, USA)에서 구 매하여 사용하였고 용매인 dichloromethane (DCM) 및 n-hexane은 HPLC grade (J.T.Baker, Philipsburg, NJ, USA)를 사용하였으며 n-hexane은 증류하여 사 용하였다.
Na2SO4 (anhydrous granular, Shinyo Pure Chemical, Osaska, Japan), SiO2 (70-230 mesh ASTM, Merck, Darmstadt, Germany)와 Al2O3 (70-230 mesh ASTM Merck, active basic, Darmstadt, Germany)는 130oC 의 오븐에 24시간 이상 넣어 활성화시킨 후 사용하 였다. GPC (gel permeation chromatography) 칼럼에 사용된 bio-bead는 Bio Rad사의 S-X3, 40-80 µm (Hercules, CA, USA)를 사용하였으며, 분석에 사용 된 PAHs 검량선 작성용 표준용액(calibration standard) 는 Supelco의 16가지 PAHs 혼합물(EPA 610 PAHs mix, Bellefonte, PA, USA)을 구매하여 사용하였다.
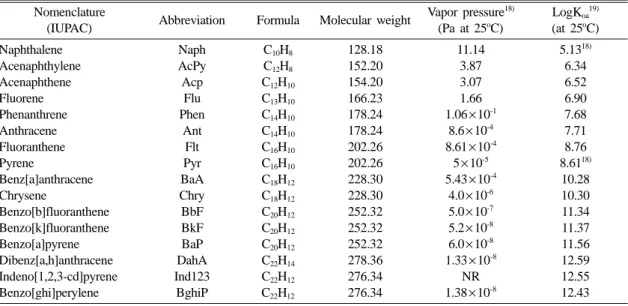
Table 1에 PAHs의 종류, 약어 및 물리ㆍ화학적 특 성을 기술하였다.
2. 시료채취
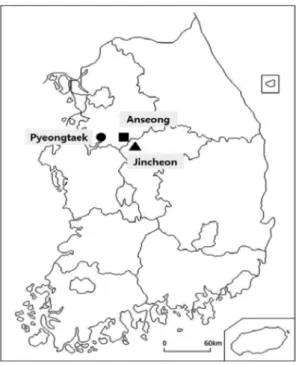
시료채취는 비교적 지역적 특성이 잘 나타나는 도 시지역인 경기도 평택, 도농복합지역인 경기도 안성, 농촌지역인 충북 진천에서 채취하였다. 도시지역의 시료채취 장소는 1번국도와 38번 국도가 합류하는 평택시청에서, 도농복합지역은 안성시내에 위치한 한경대학 교내에서, 농촌지역은 진천의 외곽지역으 로 주위에는 주택과 공장이 없는 임야지역으로 주변 에 313번 지방도로가 있지만 차량통행은 거의 없는 수도권의 풍하지역에서 채취하였다.20) 기타 시료채취 장소에 대한 자세한 사항은 Table 2에 나타내었다.
소나무잎은 2012년 12월 말에 세 지역의 주위 10 m 이내에서 자생하는 소나무 4-5 그루에서 지상 1.5- 1.8 m 높이의 통풍이 잘되는 곳에서 자라는 1년생 잎
만을 모든 방향에서 골고루 채취하였다. 채취한 소 나무잎은 n-hexane과 Dichloromethane (DCM)으로 세척한 알루미늄 호일에 싸서 Polyethylene (PE) 지 퍼 백에 넣어 밀봉한 다음 아이스박스에 담아 실험 실로 운반한 후 분석 때까지 −20oC 냉동고에 보관 하였다.
3. 추출 및 시료 건조
각 지역에서 채취한 소나무잎은 골고루 혼합한 후 습시료 약 20 g을 취하여 시료로 사용하였으며 지역 별로 2개의 중복시료(duplicate)을 만들어 속슬렛에 서 DCM으로 24시간 추출하였다. 소나무잎의 건시 료 무게는 습시료 약 10 g을 95oC에서 약 24시간 건 조시킨 후 전후 무게차로 구하였다.
Table 1. Nomenclatures and physicochemical properties of 16 PAHs analyzed in this study Nomenclature
(IUPAC) Abbreviation Formula Molecular weight Vapor pressure18) (Pa at 25oC)
LogKoa19)
(at 25oC) Naphthalene
Acenaphthylene Acenaphthene Fluorene Phenanthrene Anthracene Fluoranthene Pyrene
Benz[a]anthracene Chrysene
Benzo[b]fluoranthene Benzo[k]fluoranthene Benzo[a]pyrene Dibenz[a,h]anthracene Indeno[1,2,3-cd]pyrene Benzo[ghi]perylene
Naph AcPy Acp Flu Phen
Ant Flt Pyr BaA Chry BbF BkF BaP DahA Ind123 BghiP
C10H8
C12H8
C12H10
C13H10
C14H10
C14H10
C16H10
C16H10
C18H12
C18H12
C20H12
C20H12
C20H12
C22H14
C22H12
C22H12
128.18 152.20 154.20 166.23 178.24 178.24 202.26 202.26 228.30 228.30 252.32 252.32 252.32 278.36 276.34 276.34
11.14 3.87 3.07 1.66 1.06×10⁻¹
8.6×10⁻⁴ 8.61×10⁻⁴
5×10⁻⁵ 5.43×10⁻⁴
4.0×10⁻⁶ 5.0×10⁻⁷ 5.2×10⁻⁸ 6.0×10⁻⁸ 1.33×10⁻⁸
NR 1.38×10⁻⁸
5.1318) 6.34 6.52 6.90 7.68 7.71 8.76 8.6118) 10.28 10.30 11.34 11.37 11.56 12.59 12.55 12.43 NR indicates that data not reported.
Koa : Octanol-air partitioning coefficient.
Table 2. Summary of sampling sites21) Sampling
site Population Area(km2) Population density (people/km2)
Number of cars
Geographic Coordinate Urban
(Pyeongtaek) 434,305 454.63 955.3 188,555 N 36o 59 35
E 127o 06 51 Semirural
(Anseong) 181,608 553.50 328.1 82,154 N 37o 00 45
E 127o 15 50 Rural
(Jincheon) 63,458 407.23 155.8 30,520 N 36o 56 06
E 127o 19 52
4. 전처리
PAHs 전처리 방법은 기존의 문헌22)에 서술되어 있 지만 간단하게 다시 설명하면 속슬렛에서 추출한 PAHs 추출액을 회전증발 농축기에서 농축한 다음 silica-alumina 칼럼과 bio-beads를 충전시킨 GPC 칼 럼으로 시료를 정제하였다. 정제한 시료를 회전증발 농축기에서 농축한 다음 첨가용 내부표준물질을 첨 가하여 GC-MSD로 분석하였으며 분석 조건을 Table 3에 기술하였다.
5. QA/QC
PAHs의 정량 시 크로마토그램의 높이가 노이즈의 3배 이상인 것만 정량에 포함시켰으며, 정제용 내부 표준물질(internal surrogate standard)로 사용된 5종의 중수소화(deuterated) PAHs를 이용하여 모든 전처리 과정에 대한 회수율을 평가한 결과 회수율은 42.5- 105.1% (n=6), 변이계수(coefficient of variation, C.V) 는 5.3-14.8 %였으며, 분자량이 작을수록 회수율은 낮 고 변이계수는 컸다. 시료마다 두 개의 부시료(duplicate) 를 만들어 분석하였는데, 두 시료 간 평균변이계수는 26.18%(5.17-58.23%)였으며 naphthalene은 공시료 (blank)의 피크가 너무 커서 계산에서 제외시켰다.22)
III. 결 과
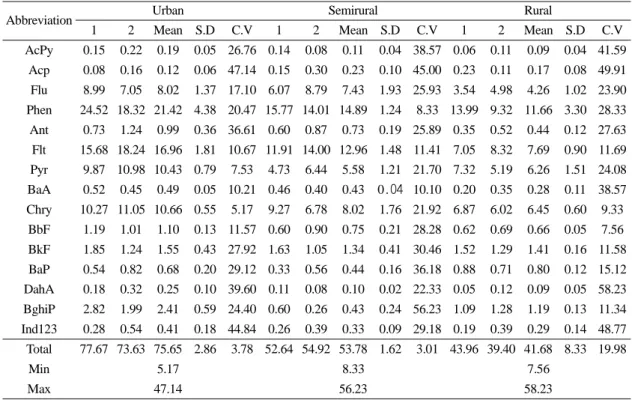
Table 4와 Fig. 2는 세 지역(도시지역, 도농복합지 역, 농촌지역)에서 채취한 소나무잎에 침착된 PAHs 농도(Cp, ng/g dry)를 나타낸 것이다. Cp는 도시지역 (75.65 ng/g dry)>도농복합지역(53.78 ng/g dry)>농촌 지역(41.68 ng/g dry) 순으로 높았으나 세지역의 각 PAHs의 농도분포는 비슷한 분포를 보였으며, 분자 량 228.30 이하의 저분자 PAHs (AcPy, Acp, Flu, Phen, Ant, Flt, Pyr, BaA, Chry) 농도분율이 전체 PAHs 농도의 89.4-93.7%를 차지하여 252.32 이상의 고분자 PAHs (BbF, BkF, BaP, DahA, BghiP, Ind123) 농도분율 6.3-10.6%보다 훨씬 더 높았다.
PAHs는 SOCs이므로 대기 중에서 가스상과 입자상 으로 존재하며 분자량이 적은 PAHs일수록 대기 중 에서 가스상 분율이 높다.26) 대기 중 PAHs가 소나 무잎에 침착될 때 침착의 주경로는 건식 가스상 침 착이며, 가스상 PAHs는 소나무잎에 누적침착 되지 만 입자상 PAHs는 누적침착이 일어나지 않기 때문 에 소나무잎에 침착된 PAHs는 대기 중에서 가스상 분율이 높은 저분자 PAHs가 대부분을 차지한 것으 로 생각된다.15,16,21)
Fig. 1. Map of Summary of sampling sites.
Table 3. Analytical conditions of GC-MSD for PAHs determination
GC HP 6890
Detector HP Mass Selective Detector 5973 Electron energy 70 eV
Injector Splitless Sample injection
volume 1µl
Carrier Gas He 1 ml/min
Column HP-5MS
Temperature Programme
HP Crosslinked HP ME Sioxane 30 m×0.25 mm×0.25 µm Film thikness
60oC for 1 min 20oC/min to 130oC
4oC/min to 300oC with a final hold of 15 min
Ionization mode EI Detection mode SIM Total Run Time 62 min Injector Temperature 300oC
IV. 고 찰
PAHs는 친유성(lipophilicity)이므로 대기 중의 PAHs는 소나무잎 상피에 존재하는 지질(lipid)에
침착되는데 옥탄올[CH3(CH2)7OH]은 식물잎에 존 재하는 지질을 잘 대표한다.24,25) 그러므로 옥탄올- 공기 분배계수(octanol-air partitioning coefficient, Koa)는 소나무잎에 침착된 PAHs 농도(Cp, pg/g dry) 와 공기 중 PAHs 농도(Ca, pg/m3)의 비(Cp/Ca)와 큰 상관성을 가진다. 천17)은 소나무잎이 대기 중에 노출되어 있는 기간과 동일한 기간 동안 대기 중 PAHs 농도를 측정하여 PAHs Cp/Ca의 대수값 [Log(Cp/Ca)]과 옥탄올-공기 분배계수의 대수값 (LogKoa) 사이의 관계를 연구한 결과 분자량 228.30 이하의 저분자 PAHs (AcPy, Acp, Flu, Phen, Ant, Flt, Pyr, BaA, Chry)에 대해서는 식 (1)이, 분자량 252.32 이상의 고분자 PAHs (BbF, BkF, BaP, DahA, BghiP, Ind123)에 대해서는 식 (2)가 성립 한다는 것을 밝혔다.
Lower molecular PAHs(<M.W 228.30) Log(Cp/Ca) = 0.6251(LogKoa)− 5.0994
Log(Cp/Ca) = (R2= 0.7885, p = 0.0034) (1) Table 4. PAHs concentrations(ng/g dry) in pine needles at three sampling sites
Abbreviation Urban Semirural Rural
1 2 Mean S.D C.V 1 2 Mean S.D C.V 1 2 Mean S.D C.V
AcPy 0.15 0.22 0.19 0.05 26.76 0.14 0.08 0.11 0.04 38.57 0.06 0.11 0.09 0.04 41.59 Acp 0.08 0.16 0.12 0.06 47.14 0.15 0.30 0.23 0.10 45.00 0.23 0.11 0.17 0.08 49.91 Flu 8.99 7.05 8.02 1.37 17.10 6.07 8.79 7.43 1.93 25.93 3.54 4.98 4.26 1.02 23.90 Phen 24.52 18.32 21.42 4.38 20.47 15.77 14.01 14.89 1.24 8.33 13.99 9.32 11.66 3.30 28.33 Ant 0.73 1.24 0.99 0.36 36.61 0.60 0.87 0.73 0.19 25.89 0.35 0.52 0.44 0.12 27.63 Flt 15.68 18.24 16.96 1.81 10.67 11.91 14.00 12.96 1.48 11.41 7.05 8.32 7.69 0.90 11.69 Pyr 9.87 10.98 10.43 0.79 7.53 4.73 6.44 5.58 1.21 21.70 7.32 5.19 6.26 1.51 24.08 BaA 0.52 0.45 0.49 0.05 10.21 0.46 0.40 0.43 0.04 10.10 0.20 0.35 0.28 0.11 38.57 Chry 10.27 11.05 10.66 0.55 5.17 9.27 6.78 8.02 1.76 21.92 6.87 6.02 6.45 0.60 9.33 BbF 1.19 1.01 1.10 0.13 11.57 0.60 0.90 0.75 0.21 28.28 0.62 0.69 0.66 0.05 7.56 BkF 1.85 1.24 1.55 0.43 27.92 1.63 1.05 1.34 0.41 30.46 1.52 1.29 1.41 0.16 11.58 BaP 0.54 0.82 0.68 0.20 29.12 0.33 0.56 0.44 0.16 36.18 0.88 0.71 0.80 0.12 15.12 DahA 0.18 0.32 0.25 0.10 39.60 0.11 0.08 0.10 0.02 22.33 0.05 0.12 0.09 0.05 58.23 BghiP 2.82 1.99 2.41 0.59 24.40 0.60 0.26 0.43 0.24 56.23 1.09 1.28 1.19 0.13 11.34 Ind123 0.28 0.54 0.41 0.18 44.84 0.26 0.39 0.33 0.09 29.18 0.19 0.39 0.29 0.14 48.77 Total 77.67 73.63 75.65 2.86 3.78 52.64 54.92 53.78 1.62 3.01 43.96 39.40 41.68 8.33 19.98
Min 5.17 8.33 7.56
Max 47.14 56.23 58.23
S.D : Standard Deviation, C.V : Coefficient of variance (%)
Fig. 2. Histogram of PAHs concentrations in pine needles at three sampling sites.
Higher molecular PAHs(>M.W 252.32) Log(Cp/Ca) = −0.5884(LogKoa)+ 7.3926
Log(Cp/Ca) = (R2= 0.5408, p = 0.0596) (2)
식 (1)과 식(2)를 이용하여 소나무잎에 침착된 PAHs 농도(Cp)로 계산한 대기 중 PAHs 농도(Ca)를 Table 5와 Fig. 3에 나타내었다. Table 5와 Fig. 3에서 보 인 대기 중 PAHs 농도(Ca)는 6월에서 12월 말까지 각
지역의 대기 중 PAHs의 평균농도를 나타낸 것으로 도 시지역(114.03 ng/m3)>도농복합지역(90.45 ng/m3)>농촌 지역(61.91 ng/m3) 순으로 농도가 높았다. 그러나 세 지역 모두 각 PAHs 농도분포는 비슷한 형태를 보 였고, 분자량 228.30 이하의 저분자 PAHs 농도분율 이 전체 PAHs 농도의 96.6-98.5%를 차지하여 252.32 이상의 고분자량 PAHs 농도의 1.5-3.7%보다 훨씬 더 높았다. 이것은 백26)등이 PUF air sampler로 측 정한 대기 중 가스상과 입자상 PAHs의 농도분율 분 포도와 일치하는 결과이다.
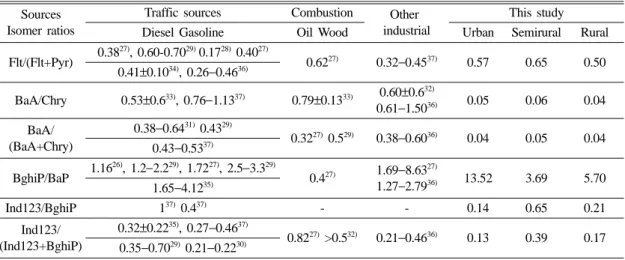
Table 6은 대기 중 각 PAHs 성분의 농도비를 나타 낸 것이고 Fig. 4는 세지역의 대기 중 PAHs 농도와 자동차 등록대수 사이의 상관성을 나타낸 것이다.
Table 6과 Fig. 4의 결과를 종합하여 PAHs의 발생원
Fig. 3. Histogram of calculated PAHs concentrations in ambient air using Log(Cp/Ca)-LogKoa equations at three sampling sites.
Table 5. Calculated PAHs concentrations (ng/m3) in ambient air using Log(Cp/Ca)-LogKoa equations at three sampling sites
Abbreviation Urban Semirural Rural
AcPy 2.53 1.55 1.16
Acp 1.27 2.40 1.80
Flu 49.02 45.42 26.04
Phen 42.60 29.62 23.18
Ant 1.88 1.40 0.83
Flt 7.13 5.45 3.23
Pyr 5.44 2.91 3.26
BaA 0.02 0.02 0.01
Chry 0.49 0.37 0.30
BbF 0.21 0.14 0.12
BkF 0.31 0.27 0.28
BaP 0.17 0.11 0.20
DahA 0.26 0.10 0.09
BghiP 2.36 0.42 1.16
Ind123 0.34 0.27 0.24
Total 114.03 90.45 61.91
Table 6. Reference isomer ratios of selected PAHs from previous studies and this study Sources
Isomer ratios
Traffic sources Combustion Other industrial
This study
Diesel Gasoline Oil Wood Urban Semirural Rural
Flt/(Flt+Pyr) 0.3827), 0.60-0.7029) 0.1728) 0.4027)
0.6227) 0.32−0.4537) 0.57 0.65 0.50 0.41±0.1034), 0.26−0.4636)
BaA/Chry 0.53±0.633), 0.76−1.1337) 0.79±0.1333) 0.60±0.632)
0.61−1.5036) 0.05 0.06 0.04 BaA/
(BaA+Chry)
0.38−0.6431) 0.4329)
0.3227) 0.529) 0.38−0.6036) 0.04 0.05 0.04 0.43−0.5337)
BghiP/BaP 1.1626), 1.2−2.229), 1.7227), 2.5−3.329)
0.427) 1.69−8.6327)
1.27−2.7936) 13.52 3.69 5.70 1.65−4.1235)
Ind123/BghiP 137) 0.437) - - 0.14 0.65 0.21
Ind123/
(Ind123+BghiP)
0.32±0.2235), 0.27−0.4637)
0.8227) >0.532) 0.21−0.4636) 0.13 0.39 0.17 0.35−0.7029) 0.21−0.2230)
을 추정하면 세 지역 모두 자동차가 PAHs의 주발생 원이라 생각된다. 박27) 등은 수용모델을 이용하여 서 울지역의 대기 중 PAHs 기여도를 추정한 결과 자동 차의 기여도가 64%라고 하여 위의 사실을 뒷받침하였다.
위에서 살펴 본 바와 같이 소나무잎에 침착된 PAHs 농도(Cp, ng/g dry)를 Log(Cp/Ca) -LogKoa 관계식 (1) 과 (2)에 대입하면 각 지역의 대기 중 PAHs 평균농 도(Ca, ng/m3)를 상당히 정확하게 계산할 수 있으므로 소나무잎은 대기 중 PAHs의 PAS로서 사용이 가능함 을 알 수 있다. 그러나 상기의 식 (1)과 (2)는 6월 1 일부터 12월 31까지 7개월 간의 Cp와 Ca만을 이용하 여 구한 상관식이므로 보다 더 장기적인 대기 중 PAHs 농도를 추정하려면 추가적인 실험이 더 필요하다.
대기 중 잔류성 유기오염물질(persistance organic pollutants, POPs)이 소나무잎에 침착되는 주경로는 건식가스상 침착이므로 소나무잎은 PAHs 이 외에도 대기 중에서 가스상으로 존재하는 POPs의 PAS로 사용이 가능하다.13,15,23,26)
V. 결 론
이 연구는 도시지역(평택), 도농복합지역(안성), 농 촌지역(진천)에서 소나무잎을 PAS로 사용하여 소나 무잎에 침착된 PAHs 농도(Cp, ng/g dry)로 대기 중 PAHs 농도(Ca, ng/m3)를 계산하고 각 지역의 PAHs 발생원을 추정한 것이다.
Cp는 도시지역(75.65 ng/g dry)>도농복합지역(53.78 ng/g dry)>농촌지역(41.68 ng/g dry) 순으로 높았으 나 세 지역의 PAHs 농도분포는 비슷하였으며, 분자 량 228.30 이하의 저분자 PAHs (AcPy, Acp, Flu, Phen, Ant, Flt, Pyr, BaA, Chry) 농도분율(89.4-93.7
%)이 252.32 이상의 고분자 PAHs (BbF, BkF, BaP, DahA, BghiP, Ind123) 농도분율(6.3-10.6%)보다 훨 씬 더 높았다.
Log(Cp/Ca)-LogKoa 상관식을 이용하여 계산한 Ca는 도시지역(114.03 ng/m3)>도농복합지역(90.45 ng/m3)>
농촌지역(61.91 ng/m3) 순으로 농도가 높았으나 세 지역 모두 PAHs 농도분포는 비슷하였고, 분자량 228.30 이하의 저분자 PAHs 농도분율(96.6-98.5%) 이 252.32 이상의 고분자 PAHs 농도분율(1.5-3.7%) 보다 훨씬 더 높았다.
대기 중 각 PAHs 성분의 농도비를 이용하여 발생 원을 추정한 결과 세 지역 모두 PAHs의 주발생원 은 자동차로 판명되었다.
참고문헌
1. Ravindra K, Sokhi R, Grieken RV. Atmospheric polycyclic hydrocarbons : source attribution, emis- sion factors and regulation. Atmos Environ. 2008;
42(13): 2895-2921.
2. Baek SO. Atmospheric polycyclic aromatic hydro- carbons - Environmental implications. J Kor Soc Atmos Envir. 1999; 15(5): 525-544.
3. Phillips DH. Fifty years of benzo[a]pyrene. Nature.
1983; 303(9): 468-472.
4. Gouin T, Mackay D, Jones KC, Harner T, Meijer SN. Evidence for the “grasshopper” effect and fractionation during long-range atmospheric trans- port of organic contaminants. Environ Pollut. 2004;
128(1-2): 139-148.
5. Aboal JR, Fernandez JA, Carballeira A. Sampling optimization, at site scale, in contamination moni- toring with moss, pine and oak. Environ Pollut.
2001; 115(2): 313-316.
6. Leed WA, Steinnes ES, Jones KC. Atmospheric deposition of PCBs to moss (Hylocomium splen- dens) in norway between 1977 and 1990. Environ Sci Technol. 1996; 30(2): 524-530.
7. Wen S, Yang F, Li JG, Gong Y, Zhang XL, Hui Y, et al. Polychlorinated dibenzo-p-dioxin and diben- zofurans (PCDD/Fs) polychlorinated diphenyl ethers Fig. 4. Relationship between total PAHs concentrations in
ambient air (Ca, ng/m3) and number of cars at three sites.
(PBDEs), and polychlorinated biphenyls (PCBs) monitored by tree bark in an E-waste recycling area. Chemosphere. 2009; 74(7): 981-987.
8. Hauk H, Umlauf G, McLachlan MS. Uptake of gas- eous DDE in spruce needles. Environ Sci Technol.
1994; 28(13): 2372-2379.
9. Chun MY, Kim TW. Comparison of regional differ- ences of PCBs concentration using pine needles and soil. J Environ Toxicol. 2009; 24(3): 251-259.
10. Lim TB, Xu R, Tan B, Obbard JP. Persistent organic pollutants in moss as bioindicators of atmo- spheric pollution in Singapore. Chemosphere.
2006(4); 64: 596-602.
11. Shoeib M, Harner T. Characterization and compar- ison of three passive samplers for persistent organic pollutants. Environ Sci Technol. 2002; 36(19): 4142- 4151.
12. Choi SD, Chang YS. Air monitoring of persistent organic pollutants using passive air samplers. J Kor Soc Atmos Envir. 2005; 21(5): 481-494.
13. Chun MY. Estimation of PCBs concentrations in ambient air using pine needles as a passive air sam- pler (PAS). J Environ Health Sci. 2012; 38(4): 360- 368.
14. Chun MY. A study on the deposition of PCBs in air on coniferous needles. J Kor Soc Environ Engin.
1998; 20(10): 1377-1383.
15. Chun MY. Characteristics of PCDD/Fs deposited on pine needles. J Kor Soc Environ Engin. 2005;
27(6): 599-605.
16. Yeo HG, Cho KC, Choi MK, Chun MY, Kim TW.
Deposition characteristics of atmospheric PCBs depending on exposure periods using pine needles.
J Kor Soc Environ Engin. 2006; 28(8): 836-842.
17. Chun MY. Sampling rate evaluation of atmospheric PAHs to pine needles for passive air sampler. J Kor Soc Environ analy. 2011; 14(2): 83-88.
18. Mackay M, Shiu WY, Ma KC. Illustrated hand- book of physical-chemical properies and environ- mental fate for organic chemicals, 2nd ed. USA:
CRC Press; 1997. p.250-251.
19. Mustafa O, Cetin E, Sofuoglu A. Determination of octanol-air partition coefficients and supercooled liquid vapor pressures of PAHs as a function of temperature: Application to gas-particle partitioning in an urban atmosphere. Atmos Environ. 2006;
40(34): 6615-6625.
20. Ministry of Environment. Annual Report of Ambi- ent Air Quality in Korea, 2011. Sejong: Ministry of Environment Press; 2012. p.439.
21. Statitics Korea. Korean statistical information ser-
vice. Available: http://kosis.kr/abroad/abroad_01List.
jsp. 2012. [accessed 10 May 2013]
22. Kim TW, Chun MY. Development of analytical method of PAHs deposited on tree leaves. J Kor Soc Environ Analy. 2008; 11(4): 261-267.
23. Pausch KW, McLachlan MS, Umlauf G. Determina- tion of the principal pathways of polychlorinated dibenzo-p-dioxins and dibenzofurans to Lolium multiflorum(rye grass). Environ Sci Technol. 1995;
29(4): 1090-1098.
24. Gareth T, Sweetman AJ, Ockenden WA, Mackay D, Jones KC. Air-pasture transfer of PCBs. Environ Sci Technol. 1998; 32(7): 936-942.
25. Harner T, Bidleman TF. Measurement of octanol-air partition coefficients for polychlorinated biphenyls.
J Chem Engineer Data. 1996; 41(4): 895-899.
26. Baek SO, Choi JS. Effect of ambient temperature on the distribution of atmospheric concentrations of polycyclic aromatic hydrocarbons in the vapor and particulate phases. J Kor Air Pollution Resear Assoc. 1998; 14(2): 117-131.
27. Park CU, Yun JS, Eo SM, Shin JS, Kim MY, Sohn JY, et al. Contributive estimation of polycyclic aro- matic hydrocarbons by emission source in seoul area. J Kor Soc Atm Environ. 2006; 22(3): 287-295.
28. Manoli E, Kouras A, Samara C. Profile analysis of ambient and source emitted particle-bound polycy- clic aromatic hydrocarbons from three sites in northern Greece. Chemosphere. 2004; 56(9): 867- 878.
29. Rogge WF, Hildemann LM, Mazurek MA, Cass GR, Simoneit BRT. Sources of fine organic aero- sol. 2. Noncatalyst and catalyst-equipped automo- biles and heavy-duty diesel trucks. Environ Sci Technol. 1993; 27(4): 636-651.
30. Khalili NR, Scheff PA, Holsen TM. PAH source fingerprints for coke ovens, diesels and gasoline engines, highway tunnels and wood combustion emissions. Atmos Environ. 1995; 29(4): 533-542.
31. Sicre MA, Marty JC, Saliot A, Aparicio X, Grilmat J, Albaiges J. Aliphatic and aromatic hydrocarbons in different sized aerosols over the Mediterranean Sea: occurrence and origin. Atmos Environ. 1987;
21(10): 2247-2259.
32. Yunker MB, Macdonanld RW, Vingarzan R, Mitch- ell RH, Goyette D, Sylvestre S. PAH in the Fraser River basin : A critical appraisal of PAH ratio as indi- cators of PAH source composition. Org Geochem.
2002; 33(4): 489-515.
33. Dickhut RM, Canuel EA, Gustafson KE, Liu K, Arzayus KM, Walker SE, et al. Automotive sources
of carcinogenic polycyclic aromatics hydrocarbons associated with particulate matter in the Chesa- peake Bay region. Environ Sci Technol. 2000;
34(21): 4635-4640.
34. Li CK, Kamens RM. The use of polycyclic aro- matic hydrocarbons as source signatures in receptor modeling. Atmos Environ. 1993; 27(4): 523-532.
35. Kavouras IG, Lawrence J, Koutrakis P, Stephanou EG, Oyola P. Measurement of particulate aliphatic and polynuclear aromatic hydrocarbons in Santiago de Chile: Source reconciliation and evaluation of
sampling artifacts. Atmos Environ. 1999; 33(30):
4977-4986.
36. Muendo M, Hanai Y, Kameda Y, Masunaga S.
Polycyclic aromatic hydrocarbons in urban air: con- centration levels, patterns, and source analysis in Nairobi, Kenya. Environ Forens. 2006; 7(2): 147- 157.
37. Caricchia MA, Chiavarini S, Pezza M. Polycyclic aromatic hydrocarbons in the urban atmospheric particulate matter in the city of Naples (Italy).
Atmos Environ. 1999; 33(23): 3731-3738.