Original Article
Postoperative oral nutritional supplementation after major gastrointestinal surgery: a randomized controlled clinical trial
Seong-Ho Kong MD, PhD 1 , Jun Seok Park MD, PhD 2 , In Kyu Lee MD, PhD 3 ,
Seung-Wan Ryu MD, PhD 4 , Young-Kyu Park MD, PhD 5 , Han-Kwang Yang MD, PhD 1 , Sang-Uk Han MD, PhD 6 , Ki-Young Yoon MD, PhD 7 , Seung-Yong Jeong MD, PhD 1 , Mi Ran Jeong MD, PhD 5 , Dae Wook Hwang MD, PhD 8 , Yun-Suhk Suh MD, MS 1 , Yoo-Seok Yoon MD, PhD 8 , Kyung Won Seo MD, PhD 7 , Ji Won Park MD, MS 1 ,
Chul-Su Byun MD, PhD 6 , Hoon Hur MD, PhD 6 , Hojeong Won MS 9 , Yunhee Choi PhD 9 , Hyuk-Joon Lee MD, PhD 1
1 Department of Surgery and Cancer Research Institute, Seoul National University College of Medicine, Seoul, Korea
2 Department of Surgery, Kyungpook National University Medical Center, Daegu, Korea
3 Department of Surgery, Yeouido St. Mary's Hospital, Seoul, Korea
4 Department of Surgery, Keimyung University School of Medicine, Daegu, Korea
5 Department of Surgery, Chonnam National University Medical School, Gwangju, Korea
6 Department of Surgery, Ajou University School of Medicine, Suwon, Korea
7 Department of Surgery, Kosin University College of Medicine, Busan, Korea
8 Department of Surgery, Seoul National University Bundang Hospital, Seongnam, Korea
9 Medical Research Collaborating Center, Seoul National University Hospital, Seoul, Korea
Background and Objectives: This study aimed to evaluate the efficacy of post-operative oral nutrition supple- mentation after major gastrointestinal surgery. Methods and Study Design: A prospective randomized con- trolled trial was conducted to evaluate 174 subjects who were discharged within 2 weeks after major gastrointes- tinal surgery. The subjects in the study group were prescribed 400 ml/day of Encover® from the day of discharge for 8 weeks, but no supplementation was allowed in the control group. The primary endpoint was the weight loss rate at 8 weeks after discharge compared with the pre-operative weight, and the secondary endpoints included changes in body weight, body mass index, Patient-Generated Subjective Global Assessment score/grade, hemato- logical/biochemical parameters, and adverse events evaluated at 2, 4, and 8 weeks after discharge. Results: The weight loss rate at 8 weeks after discharge did not differ between two groups (4.23±5.49% vs 4.80±4.84%, p=0.481). The total lymphocyte count, the level of total cholesterol, total protein, and albumin were significantly higher in the study group after discharge. Diarrhea was the most frequent adverse event, and the incidence of ad- verse events with a severity score of ≥3 did not differ between groups (2.3% vs 1.2%). Conclusions: The utility of routine oral nutritional support after major gastrointestinal surgery was not proven in terms of weight loss at 8 weeks after discharge. However, it can be beneficial for early recovery of biochemical parameters.
Key Words: oral nutritional supplements, nutritional support, gastrointestinal surgery, weight loss, postoperative nutrition
INTRODUCTION
Patients who undergo major gastrointestinal surgery are frequently at risk of malnutrition, due to not only the dis- ease itself, which may cause obstruction or hyper meta- bolic status, but also the treatment processes and postop- erative functional deterioration of the gastrointestinal tract. 1-3 Several studies have shown that preoperative nu- tritional support is helpful in selected patients in terms of reducing post-operative complications. 4-8 However, the risk of malnutrition continues after surgery due to postop-
Corresponding Author: Dr Hyuk-Joon Lee, Department of Surgery and Cancer Research Institute, Seoul National Universi- ty College of Medicine, Seoul, Korea, 101 Daehak-Ro, Jongno- Gu, Seoul 110-744, Korea.
Tel: +82-2-2072-1957; Fax: +82-2-766-3975 Email: [email protected]; [email protected]
Manuscript received 12 March 2016. Initial review completed 25 May 2016. Revision accepted 07 June 2016.
doi: 10.6133/apjcn.112016.02
erative gastrointestinal problems and the limitation of dietary intake after surgery, and it can impact long-term quality of life. 1,9
It has been reported that weight loss is the most promi- nent during the period from four to twelve weeks after surgery. 10-12 Patients tend to gain weight after this period as their body weight stabilizes; however, many patients cannot reach their pre-operative weight. Within a few weeks after discharge from the hospital, patients must be provided with appropriate nutrition according to their individual recovery statuses to recover a normal quality of life with normal functioning. However, patients can be at risk of malnutrition due to deviation from daily dietary advice and postoperative gastrointestinal symptoms, which can be especially problematic if the patient’s situa- tion does not allow for proper support from family mem- bers.
An oral nutritional supplement (ONS) can be a good option for supplying nutrition during this period due to its ease of administration and balanced nutritional compo- nents. Beattie et al found that ONS administration was useful for the treatment of malnourished patients during the postoperative period in 2000. 13 However, the treat- ment process for operative patients has changed over the last 10 years, including an increase in laparoscopic sur- gery, improved postoperative pain control, early initiation of diet, and establishment of patient nutrition education programs. This progress may contribute to decreased metabolic rates during and after surgery with enhance- ment of nutritional recovery. This study was conducted to re-evaluate the efficacy of ONS administration in present practice for the treatment of patients who are at risk of malnutrition during the postoperative period following major gastrointestinal surgery.
METHODS
This study was a prospective, open-label, multicenter, randomized clinical trial performed in nine specialized surgical units in eight hospitals in Korea. 14 Patients with surgical gastrointestinal disease who needed major gas- trointestinal surgery were screened for eligibility preoper- atively. They were considered eligible if they met all of the following inclusion criteria: were male or female aged 20-80 years; were capable of being discharged from the hospital within 2 weeks after major gastrointestinal sur- gery; were capable of oral intake; had no history of pre- operative radiotherapy or chemotherapy; and voluntarily agreed to participate in the trial and signed an informed consent form. Major gastrointestinal surgery was defined as resection of a part or all of the gastrointestinal organ, accompanied by reconstruction of bowel continuity, in- cluding partial or total gastrectomy, major colon and/or rectal resection, pancreaticoduodenectomy, etc. Any pro- cedure with ileostomy was excluded from eligibility. The exclusion criteria included the need for parenteral nutri- tion after discharge; weight loss at the time of discharge of less than 5% compared to the preoperative body weight in a subject whose body mass index was more than 25;
allergy to milk, wheat, soy beans, or salmon; residual macroscopic tumor in the abdominal cavity in cases of cancer; other malignancy needing treatment; and a doc- tor’s judgment that the clinical trial was not suitable for
the patient.
A secondary screening was performed again after sur- gery when the screened patients were cleared for dis- charge from the hospital within 2 weeks after surgery.
Subjects who satisfied all eligibility criteria were random- ly assigned at a 1:1 ratio to the ONS group or the control group using a randomized block design with block sizes of four and six. The randomization sequence was created and protected by the Medical Research Collaborating Center at Seoul National University Hospital and was provided by website at the time of randomization. Ran- domization was stratified according to the institutes.
The subjects in the ONS group were instructed to take 2 packages per day (400 ml/day, 400 kcal/day) of an ONS (Encover®, EN Otsuka Pharmaceutical, Hanamaki City, Japan) from the day of discharge for 8 weeks. A placebo was not used in the control group because it could have reduced the subjects’ oral intake and aggravated malnutri- tion. There were no limitations on the use of intravenous solutions, including glucose, amino acids, lipids, trace elements and vitamins, during the in-hospital period, but the use of any other intravenous or oral nutritional sup- plement was prohibited during the clinical trial period.
Follow-ups were planned at 2, 4, and 8 weeks after dis- charge. Anthropometric measurements, biochemical tests, patient-generated subjective global assessments (PG- SGAs) and compliance surveys were performed before surgery and at each planned visit. The primary endpoint was the proportion of weight loss (in kg) at 8 weeks after discharge compared with the preoperative bodyweight (proportion of weight loss=[(preoperative body weight–
body weight at 8 weeks after discharge)/preoperative body weight]×100 (%)). The secondary endpoints includ- ed changes in body weight (in kg) between the day of discharge and each follow-up visit, sequential changes in body mass index (BMI), the PG-SGA score/grade, and hematological and biochemical test results, and compli- ance with the ONS treatment, as determined using self- reporting documents and by counting of the number of remaining packages.
The planned sample size was 174 subjects, allowing for a 10% dropout rate and assuming an improvement in weight loss of up to 3% (standard deviation for each group=6.5%) with ONS administration. The rate of weight loss and standard deviation in the ONS group were expected to be 3.1% and 6.5%, respectively, accord- ing to Beattie et al. 13 The rate of weight loss in the control group was expected to be 6.1% based on previous reports of gastrectomy and colorectal surgeries. 10,11
Primary efficacy analysis was based on a modified in-
tention-to-treat population, which included all random-
ized subjects with at least one measurement after dis-
charge who had taken the ONS at least one time, particu-
larly those in the ONS group. Missing responses due to
withdrawal from the treatment were handled for inten-
tion-to-treat analyses in the following two ways: complete
data analysis and the multiple imputation method, using
the responses at 2 and 4 weeks after discharge. Support-
ive analyses were also conducted using the per-protocol
population, including the subjects who had completed all
visits according to the protocol and took the ONS for 8
weeks with ≥50% compliance. Safety was monitored in
every randomized subject. The severity of complications was graded according to the Common Terminology Crite- ria for Adverse Events (CTCAE) v4.0.
The normality assumption for continuous data was evaluated using a Q-Q plot and the Shapiro-Wilk nor- mality test. Normally distributed data were summarized and compared using the mean±standard deviation and independent t-test; otherwise the median [min, max] and Wilcoxon rank sum test were used. A linear mixed effect model for repeated measures analysis was used to assess the differences in the parameters at 2, 4 and 8 weeks after discharge, with adjustment for preoperative differences.
The model included the fixed effects of the preoperative parameters, the group (ONS or control), the visit and the interaction between the group and visit. Study participant was treated as a random effect. The insignificant interac- tion term between the group and visit was excluded in the model. The risk factors for proportion of weight loss at 8 weeks after discharge were verified using multiple linear regression models in exploratory analysis. The randomi- zation group (ONS/control), age, sex, PG-SGA score/
grade, extent of gastric resection (total/partial/non- gastric), length of hospital stay and method of surgery (laparoscopic/open) were considered as possible risk fac- tors. Univariable and multivariable analyses with step- wise variable selection were performed. Interactions be- tween any two risk factors in the multivariable model were tested. Graphical and residual analyses were per- formed to assess modelling assumptions. All reported p- values were two-sided. All statistical analyses were per- formed using SAS version 9.3 (SAS Institute, Cary, North Carolina).
The study was performed in accordance with the Good Clinical Practice guidelines and the Declaration of Hel- sinki. All patients provided written informed consent.
Approval for the study protocol was obtained from the independent ethics committee at each institute (the IRB reference number for the institution of the principal inves- tigator is H-1301-116-460). This study is registered in clinicaltrials.gov (NCT01838109).
RESULTS
From August 2013 to March 2014, 174 patients (89 in ONS group, 85 in control group) were enrolled, and the trial ended with the last visit of the final subject in April 2014. From this sample, 168 (87 in ONS group, 81 in control group) and 146 subjects (68 in ONS group, 78 in control group) were selected for inclusion in intention-to- treat and per-protocol analyses, respectively.
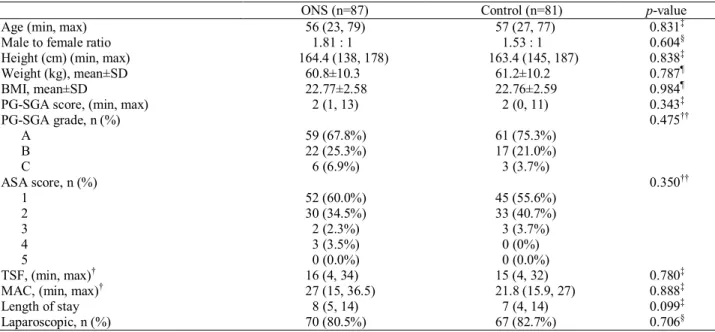
The demographics and baseline nutritional/functional statuses did not differ between the two groups (Table 1).
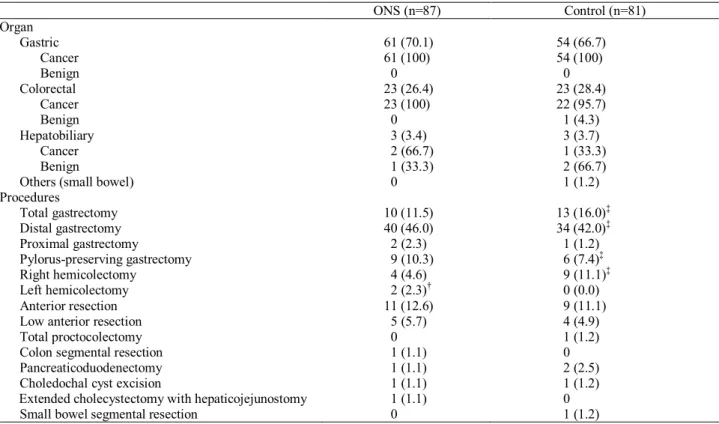
The numbers of operative procedures performed on the stomach, colorectum, and hepatobiliary system were 115, 46, and 6, respectively, with no significant differences between the two groups (p=0.914) (Table 2). Of 168 sub- jects, 164 (97.6%) underwent surgery due to malignant disease.
The primary endpoint, a body weight change (%) at 8 weeks after discharge compared to the preoperative weight, did not significantly differ between the two groups (Table 3). The difference in the weight loss rate between the two groups, as determined by intention-to- treat analysis with multiple imputations, was 0.71% (95%
CI: -0.87%, 2.30%), indicating that the ONS was less effective than the hypothesis predicted. Analysis using a linear mixed effect model of body weight change at 2, 4, and 8 weeks after discharge did not reveal any significant differences between the two groups (Figure 1a). Insignifi- cant results were also obtained from analyses of the sub- groups, including the gastric operation group, colorectal
Table 1. Characteristics of ONS and control group
ONS (n=87) Control (n=81) p-value
Age (min, max) 56 (23, 79) 57 (27, 77) 0.831 ‡
Male to female ratio 1.81 : 1 1.53 : 1 0.604 §
Height (cm) (min, max) 164.4 (138, 178) 163.4 (145, 187) 0.838 ‡
Weight (kg), mean±SD 60.8±10.3 61.2±10.2 0.787 ¶
BMI, mean±SD 22.77±2.58 22.76±2.59 0.984 ¶
PG-SGA score, (min, max) 2 (1, 13) 2 (0, 11) 0.343 ‡
PG-SGA grade, n (%) 0.475 ††
A 59 (67.8%) 61 (75.3%)
B 22 (25.3%) 17 (21.0%)
C 6 (6.9%) 3 (3.7%)
ASA score, n (%) 0.350 ††
1 52 (60.0%) 45 (55.6%)
2 30 (34.5%) 33 (40.7%)
3 2 (2.3%) 3 (3.7%)
4 3 (3.5%) 0 (0%)
5 0 (0.0%) 0 (0.0%)
TSF, (min, max) † 16 (4, 34) 15 (4, 32) 0.780 ‡
MAC, (min, max) † 27 (15, 36.5) 21.8 (15.9, 27) 0.888 ‡
Length of stay 8 (5, 14) 7 (4, 14) 0.099 ‡
Laparoscopic, n (%) 70 (80.5%) 67 (82.7%) 0.706 §
TSF: Triceps skin fold; MAC: mid-arm circumference; ONS: oral nutritional supplement; PG-SGA: patient-generated subjective global assessments; ASA: American Society of Anesthesiologists physical status classification.
The data for which the assumption of normality is valid are presented as the mean±standard deviation (SD); otherwise, the data are pre- sented as the median [min, max]. The data for PG-SGA grade, ASA score, and number of laparoscopic surgery are presented as n (%).
†
TSF and MAC were measured in 74 subjects in the ONS group and in 69 subjects in the control group.
‡
Wilcoxon rank sum test,
§Chi-square test,
¶t-test,
††Fisher’s exact test.
operation group, and subjects with a poor preoperative nutritional status (PG-SGA grades B & C) (Figures 1b-d).
However, the weight loss rates and the loss of BMIs in the ONS groups at 4 and 8 weeks after discharge were consistently less than those in the control groups.
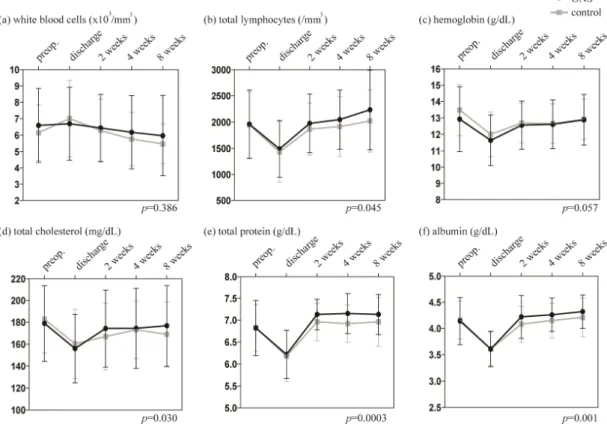
Analysis of the hematologic and biochemical parame-
ters using a linear mixed effect model revealed that the total lymphocyte count and total cholesterol, total protein, and albumin levels were significantly higher in the ONS group compared to the control group (Figure 2). The ONS group also exhibited a trend of superior recovery of the hemoglobin level following adjustments for preoperative Table 2. Operative procedures
ONS (n=87) Control (n=81)
Organ
Gastric 61 (70.1) 54 (66.7)
Cancer 61 (100) 54 (100)
Benign 0 0
Colorectal 23 (26.4) 23 (28.4)
Cancer 23 (100) 22 (95.7)
Benign 0 1 (4.3)
Hepatobiliary 3 (3.4) 3 (3.7)
Cancer 2 (66.7) 1 (33.3)
Benign 1 (33.3) 2 (66.7)
Others (small bowel) 0 1 (1.2)
Procedures
Total gastrectomy 10 (11.5) 13 (16.0) ‡
Distal gastrectomy 40 (46.0) 34 (42.0) ‡
Proximal gastrectomy 2 (2.3) 1 (1.2)
Pylorus-preserving gastrectomy 9 (10.3) 6 (7.4) ‡
Right hemicolectomy 4 (4.6) 9 (11.1) ‡
Left hemicolectomy 2 (2.3) † 0 (0.0)
Anterior resection 11 (12.6) 9 (11.1)
Low anterior resection 5 (5.7) 4 (4.9)
Total proctocolectomy 0 1 (1.2)
Colon segmental resection 1 (1.1) 0
Pancreaticoduodenectomy 1 (1.1) 2 (2.5)
Choledochal cyst excision 1 (1.1) 1 (1.2)
Extended cholecystectomy with hepaticojejunostomy 1 (1.1) 0
Small bowel segmental resection 0 1 (1.2)
ONS: oral nutritional supplement.
The values in parentheses are percentages.
†
Distal pancreatectomy was combined in 1 case in the ONS group.
‡
Benign mass excision, hiatal hernia repair, cholecystectomy (n=2), and adhesiolysis are combined in 5 cases in the Control group.
Table 3. Weight loss rate at 8 weeks after discharge compared to preoperative body weight
ONS Control p-value
Total
ITT analysis (complete data analysis) n 83 79
Mean±SD 4.23±5.49 4.80±4.84 0.481 †
ITT analysis (multiple imputation) n 87 81
Mean±SD 4.06±5.49 4.77±4.82 0.378 †
PP analysis n 68 78
Mean±SD 3.55±5.32 4.83±4.86 0.129 †
Gastric
ITT analysis (complete data analysis) n 59 53
Mean±SD 6.23±4.60 6.67±4.23 0.599 †
PP analysis 46 53
Mean±SD 5.65±4.43 6.67±4.23 0.246 †
Colorectal
ITT analysis (complete data analysis) n 22 23
Median (min, max) 0.32 (-12.42, 5.16) 0.59 (-4.68, 12.57) 0.503 ‡
PP analysis n 20 22
Median (min, max) 0.32 (-12.42, 4.38) 0.37 (-4.68, 12.57) 0.521 ‡ Hepatobiliary
ITT analysis (complete data analysis) & PP analysis
n 2 2
Median (min, max) 0.37 (-2.44, 3.18) 2.40 (2.08, 2.73) >0.999 ‡ ONS: oral nutritional supplement; ITT: intention-to-treat; PP: per-protocol.
The data for which the assumption of normality is valid are presented as the mean±standard deviation (SD); otherwise, the data are pre- sented as the median [min, max].
†
t-test,
‡Wilcoxon rank sum test.
Figure 1. Weight loss (%) according to the follow-up time point. (a) Total subjects, (b) gastric operation subgroup, (c) colorectal opera- tion subgroup, and (d) only subjects with a preoperative PG-SGA grade of B or C (ONS (n=28) and control (n=20) in ITT analysis, ONS (n=22) and control (n=19) in PP analysis). (e) Changes in body mass index. The p-values were calculated by mixed model analysis with adjustments for preoperative differences. ITT: intention-to-treat; PP: per-protocol; PG-SGA: patient-generated subjective global assess- ments; BMI: body mass index.
Figure 2. Changes in biochemistry test results. (a) White blood cell count, (b) total lymphocyte count, and (c) hemoglobin, (d) total cho-
lesterol, (e) total protein, and (f) albumin levels. The p-values were calculated by mixed model analysis with adjustments for preoperative
differences.
differences (least square mean standard error : 12.85±
0.09 in the ONS group vs 12.61±0.09 in the control group, p=0.057).
The PG-SGA scores at preoperative day, 2 weeks, 4 weeks, and 8 weeks were 3.14±2.62, 7.36±2.82, 5.35±3.07, and 3.71±2.48, respectively, in the ONS group and 2.74±2.32, 7.30±2.66, 5.46±2.92, and 3.65±2.40, respectively, in the control group. (p=0.989). The propor- tion of PG-SGA grades B or C at preoperative day, 2 weeks, 4 weeks, and 8 weeks were 32.2%, 90.7%, 71.8%, and 47.0%, respectively, in the ONS group, and 24.7%, 88.9%, 71.8%, and 45.5%, respectively, in the control group. PG-SGA scores/grades were the worst at 2 weeks after discharge, and the subjects exhibited gradual resto- ration of their PG-SGA scores/grades to levels similar to those observed preoperatively. There were no significant
differences between the two groups.
Approximately 80% of the subjects showed compliance of ≥50%, and the colorectal surgery group showed better compliance than the gastric surgery group (Figure 3a).
The compliance rate exhibited an increasing trend accord- ing to time (70.74±29.29%, 76.34±26.94%, and 77.65±29.2% for 2, 4, and 8 weeks after discharge, re- spectively). However, the subjects who underwent total gastrectomy showed a decreasing pattern of compliance between 4 and 8 weeks (Figure 3b). Body weight change was related to compliance with the ONS treatment (Fig- ure 3c). The subjects with <50% compliance showed poorer recovery of body weight compared with those in the control group, and the body weight loss tended to con- tinue to increase.
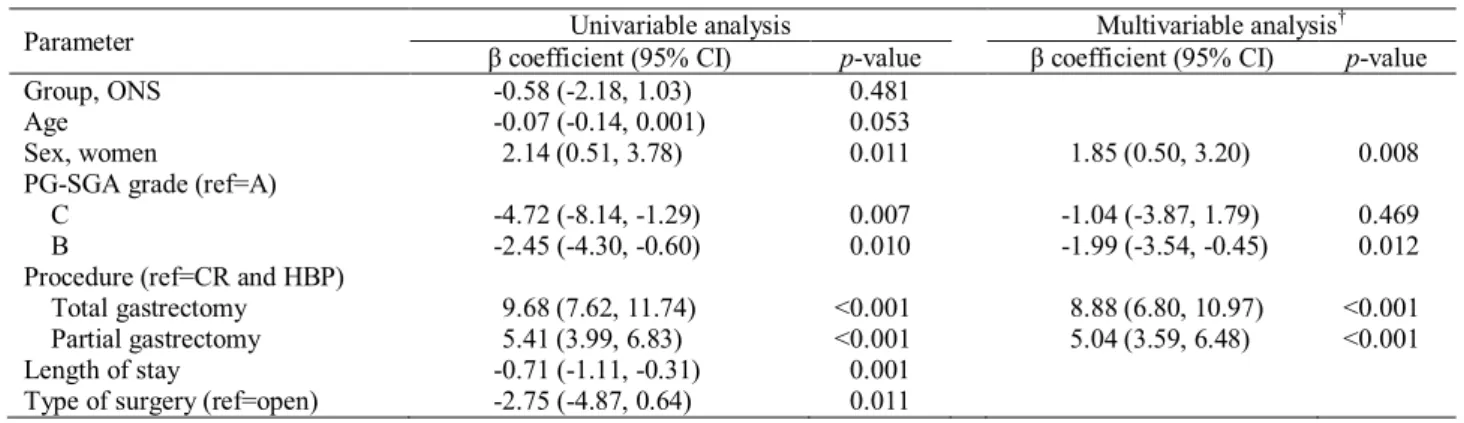
In linear regression analysis, which was an exploratory
Figure 3. Factors related to compliance with ONS solution administration. (a) Compliance with oral nutritional supplement intake accord- ing to the type of surgery. (b) Change in compliance according to the extent of gastric resection. (c) Body weight change according to the total compliance with oral nutritional supplement intake. The p-values were calculated by analysis of linear trends in the order of <50%, control, 50-80%, and ≥80%.
Table 4. Risk factors for weight loss analyzed using the linear regression model
Parameter Univariable analysis Multivariable analysis †
β coefficient (95% CI) p-value β coefficient (95% CI) p-value
Group, ONS -0.58 (-2.18, 1.03) 0.481
Age -0.07 (-0.14, 0.001) 0.053
Sex, women 2.14 (0.51, 3.78) 0.011 1.85 (0.50, 3.20) 0.008
PG-SGA grade (ref=A)
C -4.72 (-8.14, -1.29) 0.007 -1.04 (-3.87, 1.79) 0.469
B -2.45 (-4.30, -0.60) 0.010 -1.99 (-3.54, -0.45) 0.012
Procedure (ref=CR and HBP)
Total gastrectomy 9.68 (7.62, 11.74) <0.001 8.88 (6.80, 10.97) <0.001
Partial gastrectomy 5.41 (3.99, 6.83) <0.001 5.04 (3.59, 6.48) <0.001
Length of stay -0.71 (-1.11, -0.31) 0.001
Type of surgery (ref=open) -2.75 (-4.87, 0.64) 0.011
CR: colorectal surgery; HBP: hepato-bilio-pancreatic surgery; ONS: oral nutritional supplement; PG-SGA: patient-generated subjective global assessments.
†