• 검색 결과가 없습니다.

Impact of varying levels of hyperglycemia on clinicoradiographic outcomes after endovascular reperfusion treatment

N/A
N/A
Protected

Academic year: 2021

Share "Impact of varying levels of hyperglycemia on clinicoradiographic outcomes after endovascular reperfusion treatment"

Copied!
9
0
0

로드 중.... (전체 텍스트 보기)

전체 글

(1)

Impact of varying levels of hyperglycemia on

clinicoradiographic outcomes after endovascular reperfusion treatment

Seong-Joon Lee 1 , Yang-Ha Hwang 2 , Ji Man Hong 1 , Jin Wook Choi 3 , Bok Seon Yoon 4 , Dong-Hun Kang 5,6 , Yong-Won Kim 2,6 , Yong-Sun Kim 6 , Jeong-Ho Hong 7 , Joonsang Yoo 7 , Chang-Hyun Kim 8 , Bruce Ovbiagele 9 , Andrew M. Demchuk 10 , Sung-Il Sohn 7 & Jin Soo Lee 1,4 We evaluated the effects of admission hyperglycemia with different cut-off levels on 3-month

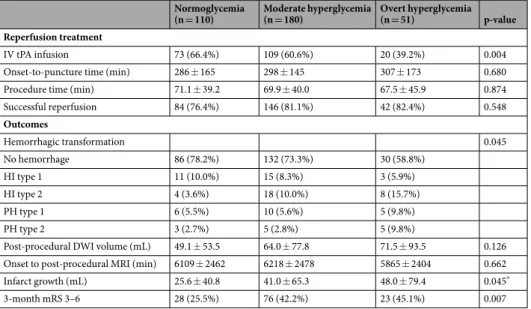
outcomes, infarct growth, and hemorrhagic transformation in acute stroke patients with large artery occlusion of anterior circulation who received endovascular treatment (EVT). Between January 2011 and May 2016, patients that underwent EVT with pre-procedural and post-procedural diffusion- weighted imaging were identified from a multicenter registry. Normoglycemia was defined as a glucose level ≤ 110 mg/dL, moderate hyperglycemia as >110 and ≤170 mg/dL, and overt hyperglycemia as

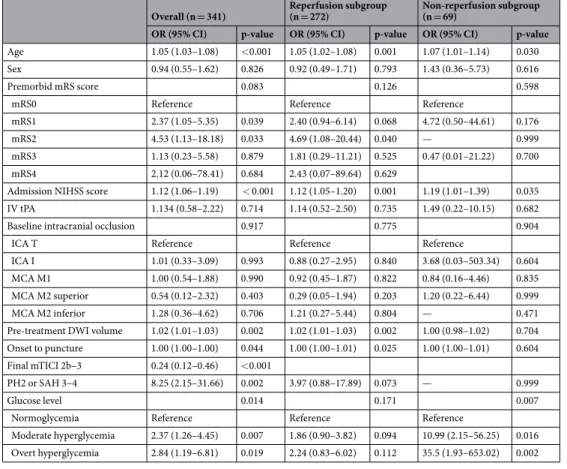
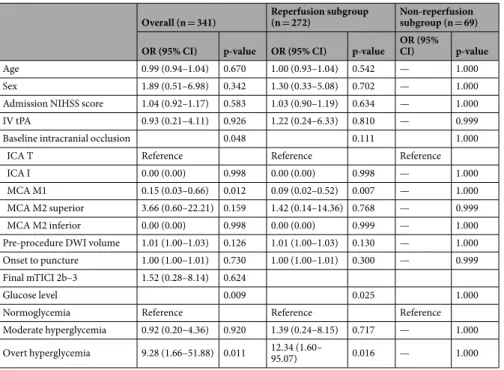
>170 mg/dL. Its effects on poor outcomes (3-month modified Rankin Scale score 3–6), infarct growth, and parenchymal hematoma type 2 were analyzed. Of 720 patients encountered, 341 patients were eligible. There was a statistically significant difference in glycated hemoglobin levels between the normoglycemia/moderate hyperglycemia and overt hyperglycemia groups (p < 0.001). Moderate hyperglycemia (odds ratio 2.37 [95% confidence interval 1.26–4.45], p = 0.007) and overt hyperglycemia (2.84 [1.19–6.81], p = 0.019) were associated with poor outcomes. Post-procedural infarct volumes were significantly greater in hyperglycemic patients (p

adjusted

= 0.003). Only overt hyperglycemia (9.28 [1.66–51.88], p = 0.011) was associated with parenchymal hematoma type 2. Overall hyperglycemia was associated with poor outcomes and infarct growth, whereas overt hyperglycemia was associated with parenchymal hematoma type 2.

Presenting hyperglycemia and diabetes mellitus (DM) are predictors of a poor outcome after intravenous (IV) thrombolysis in patients with stroke

1

. They are also independently associated with early progression of stroke after thrombolysis

2

as well as an increased risk of intracerebral hemorrhage (ICH)

3

. The mechanisms underlying these associations have been investigated mainly in rodent models of ischemia where reperfusion is guaranteed

4

. In contrast, reperfusion status has not been well validated in previous clinical studies of IV thrombolysis. This

1

Department of Neurology, Ajou University School of Medicine, Ajou University Medical Center, Suwon, South Korea.

2

Department of Neurology, Kyungpook National University School of Medicine and Hospital, Daegu, South Korea.

3

Department of Radiology, Ajou University School of Medicine, Ajou University Medical Center, Suwon, South Korea.

4

Department of Biomedical Sciences, Ajou University Graduate School of Medicine, Suwon, South Korea.

5

Department of Neurosurgery, Kyungpook National University School of Medicine and Hospital, Daegu, South Korea.

6

Department of Radiology, Kyungpook National University School of Medicine and Hospital, Daegu, South Korea.

7

Department of Neurology, Keimyung University Dongsan Medical Center, Daegu, Republic of Korea.

8

Department of Neurosurgery, Keimyung University Dongsan Medical Center, Daegu, Republic of Korea.

9

Department of Neurology, Medical University of South Carolina, Charleston, South Carolina, USA.

10

Department of Clinical Neurosciences and Radiology, Hotchkiss Brain Institute, University of Calgary, Alberta, Canada. Seong-Joon Lee and Yang-Ha Hwang contributed equally to this work. Correspondence and requests for materials should be addressed to S.-I.S. (email: [email protected]) or J.S.L. (email: [email protected])

Received: 8 March 2018 Accepted: 18 June 2018 Published: xx xx xxxx

OPEN

(2)

discrepancy has limited the generalizability of laboratory research findings to clinical research settings. Recently, major randomized controlled trials using new revascularization devices have established endovascular treat- ment (EVT) as the standard therapy for patients presenting with intracranial large vessel occlusion causing acute ischemic stroke

5–9

. Reported reperfusion rates after EVT range from 59% to 88%

5–9

, readdressing the classic ischemia/reperfusion model in real clinical settings.

Another obstacle to discriminating the effects of hyperglycemia is the difficulty in defining the respective effects of hyperglycemia and DM on patient outcomes. Additionally, stress hyperglycemia has been reported in patients with severe stroke or cardiac disease, even in the absence of DM. Although the classifications of normo- glycemia, moderate (or non-diabetic) hyperglycemia, and overt (or diabetic) hyperglycemia vary in the literature, we have made an effort to approximate the most appropriate cut-off values using the ASIAN KR registry, which enrolled patients with acute ischemic stroke who received emergent EVT with modern devices and techniques at three Korean comprehensive stroke centers.

We hypothesized that moderate and overt hyperglycemia would exclusively affect clinical outcomes, infarct growth, and hemorrhagic transformation in patients with acute large artery occlusion and a high probability of successful reperfusion. To examine this hypothesis, we classified patients into normoglycemic, moderately hyperglycemic, and overtly hyperglycemic groups, and evaluated the effects of admission glucose level on clinical outcomes, infarct growth on diffusion-weighted imaging (DWI), and development of post-procedural parenchy- mal hematoma type 2 in the acute setting.

Materials and Methods

The datasets generated during and/or analyzed during the current study are available from the corresponding author on reasonable request.

Patient enrollment. The ASIAN KR registry, which includes data on 720 patients, was assembled for an observational study of consecutive patients aged 18 years or older who received EVT for the treatment of acute ischemic stroke caused by intracranial and/or extracranial large vessel occlusion

10

. The consecutive patient data were obtained from three comprehensive stroke centers in Korea (Ajou University Hospital [center A, Suwon], Kyungpook National University Hospital [center B, Daegu], and Keimyung University Dongsan Hospital [center C, Daegu]). De-identification and allocation of study identification numbers was undertaken for all clinical data.

The data collection protocol was approved by the Institutional Review Board of each participating hospital and implemented in accordance with the ethical standards of the 1964 Declaration of Helsinki and its later amend- ments. The need for written informed consent was waived in view of the retrospective nature of the study.

To evaluate the effect of glucose level on the outcome of EVT, we applied the following inclusion criteria:

(1) acute intracranial large artery occlusion in the anterior circulation; (2) onset-to-puncture time < 720 min, and (3) availability of both pre-procedural and post-procedural DWI volumes within 1 week of stroke onset.

Pre-procedural brain computed tomography (CT) or magnetic resonance imaging (MRI) with collection of angi- ographic data was performed upon admission for each patient. Post-procedural CT or MRI of the brain was usually performed within 5 to 7 days of admission.

Evaluations. Premorbid modified Rankin Scale (mRS) scores, National Institutes of Health Stroke Scale (NIHSS) scores on admission, and mRS scores at 3 months were analyzed. A 3-month mRS score of 0–2 or no change compared with the premorbid mRS score was classified as a good outcome and a 3-month mRS score of 3–6 was classified as a poor outcome. Routine laboratory results were also collected. After de-identification and blinding of the clinical data, stroke neurologists, neuroradiologists, and neurointerventionists with expertise in acute stroke management performed core laboratory imaging analyses to ensure consistent grading and elimi- nate possible bias. The location of the initial large vessel occlusion was identified on baseline angiography (SJL).

Internal carotid artery (ICA) T, ICA I, middle cerebral artery (MCA) M1, and MCA M2 superior and inferior divisions were included in this study. ICA T was defined as an occlusive lesion in both M1 and ICA including or excluding the A1 segments. ICA I was defined as an occlusive intracranial lesion of the ICA sparing M1 and A1

11

. Alberta Stroke Program Early CT scores (ASPECTS) were classified on non-contrast CT (SIS). Successful reperfu- sion was defined as modified Treatment In Cerebral Ischemia (mTICI) grade 2b–3 (JSL, YHH)

12

. Post-procedural hemorrhagic complications were classified in accordance with the criteria defined by the European Cooperative Acute Stroke Study

13

. Subarachnoid hemorrhage (SAH) was classified in accordance with the modified Fisher scale (SIS)

14

. Parenchymal hematoma type 2 and/or grade 3–4 subarachnoid hemorrhage were regarded as seri- ous post-procedural hemorrhagic complications. Pre-procedural and post-procedural DWI stroke volumes were evaluated (by JWC) using NordicICE semi-automated software (NordicNeuroLab, Bergen, Norway).

Protocol and Procedures. The study protocols in participated centers were previously reported else-

where

10

. Patients who presented to centers A and B between January 2011 and February 2016, and patients who

visited center C between January 2011 and May 2016 were included. All centers used CT and CT angiography

for baseline screening. IV tissue plasminogen activator (tPA) was given to patients that presented within 3 to

4.5 hours of onset and were indicated. If a large artery occlusion corresponding to the stroke signs was observed

on CT angiography with an expected onset to puncture time <6 hours, EVT was considered in all patients if

there were no contraindications. Patients with large core volumes were excluded according to protocols of each

hospital. Center A excluded patients with low ASPECTS on non-contrast CT, and DWI were also utilized to rule

out large infarct core volume. Center B excluded patients with ischemic lesions in non-contrast CT involving

over half of the corresponding territory, or well developed hyperintensities on fluid attenuated inversion recovery

imaging. Center C excluded patients with ASPECTS 0 ~3 on CT, and routinely utilized multiphase CT angiog-

raphy since Aug. 2014 to rule out poor collaterals. When onset to puncture time was expected to be longer than

(3)

6 hours or onset time was unclear, further imaging modalities to select appropriate candidates were performed using multimodal MRI in the three hospitals.

The type of EVT procedure was chosen at the discretion of the treating physician. Direct aspiration and stent retrieval were primarily used in most cases

10,15–18

. Balloon guide catheters, intracranial or extracranial angio- plasty, and/or stenting were implemented as needed.

Grouping of presenting hyperglycemia and definition of DM. Blood glucose was routinely measured at admission, and glycated hemoglobin (HbA

1C

) was measured according to each respective stroke center’s proto- col. Glucose status on admission was trichotomized into normoglycemia (≤110 mg/dL)

19

, moderate hyperglyce- mia (>110 mg/dL and ≤170 mg/dL), or overt hyperglycemia (>170 mg/dL)

20

, as evaluated by literature reviews and our preliminary analyses (Supplementary Table 1). Comorbid DM was defined as a previous history or diag- nosis of DM, or an HbA1c on admission of >6.5%.

Statistical analysis. Comparative analyses of the admission glucose level groups were performed for clinical characteristics, imaging findings, and treatment outcomes. Differences between the three groups were analyzed using the χ

2

test for categorical variables or analysis of variance for continuous variables. To evaluate the effect of admission glucose level on patient outcome, we performed a logistic regression analysis that was adjusted for age, sex, premorbid mRS score, initial NIHSS score, IV tPA treatment, pre-procedural DWI vol- ume, onset-to-puncture time, site of occlusion, final successful reperfusion, and serious post-procedural hem- orrhagic complications as potential confounders. Infarct growth was evaluated in two ways. First, infarct growth (post-procedure DWI volume – pre-procedure DWI volume, mL) was compared between the groups. Second, to evaluate the effect of hyperglycemia on post-procedural infarct volume while controlling for baseline infarct volume, an analysis of covariance was performed comparing post-procedural DWI volumes between normo- glycemic and hyperglycemic patients with a cut-off value of >110 mg/dL, adjusted for age, sex, pre-procedural DWI volume, site of occlusion, and final successful reperfusion. Finally, to evaluate the association between

Normoglycemia

(n = 110) Moderate hyperglycemia

(n = 180) Overt hyperglycemia

(n = 51) p-value

Clinical characteristics

Age, years 65.8 ± 14.5 68.5 ± 11.4 66.5 ± 11.7 0.190

Male sex 67 (60.9%) 99 (55.0%) 27 (52.9%) 0.523

Hypertension 61 (55.5%) 113 (62.8%) 33 (64.7%) 0.380

Diabetes mellitus 11 (10.0%) 34 (18.9%) 44 (86.3%) <0.001

Atrial fibrillation 49 (44.5%) 101 (56.1%) 23 (45.1%) 0.110

Smoking 29 (26.4%) 42 (23.3%) 13 (25.5%) 0.835

Premorbid mRS 0.0 [0.0–0.0] 0.0 [0.0–0.0] 0.0 [0.0–0.0] 0.445

Admission NIHSS score 15.0 [11.00–18.25] 16.0 [12.0–20.0] 16.0 [13.0–20.0] 0.084 Laboratory data

Glucose (mg/dL) 98.6 ± 9.1 130.3 ± 14.6 236.2 ± 61.9 <0.001*

HbA1c (%) 5.7 ± 0.5 5.9 ± 0.6 8.1 ± 1.9 <0.001

Hemoglobin 13.4 ± 1.9 13.6 ± 1.7 13.4 ± 2.0 0.761

WBC 7.8 ± 2.3 8.6 ± 3.0 8.1 ± 2.8 0.038

Platelet 223.4 ± 70.8 223.2 ± 77.0 225.4 ± 60.3 0.983

ESR (mg/dL) 12.4 ± 11.8 12.8 ± 13.4 20.2 ± 18.3 0.001*

Pre-procedural imaging factors

Intracranial occlusion 0.182

ICA T 36 (32.7%) 50 (27.8%) 8 (15.7%)

ICA I 7 (6.4%) 12 (6.7%) 3 (5.9%)

MCA M1 55 (50.0%) 102 (56.7%) 36 (70.6%)

MCA M2 superior 5 (4.5%) 10 (5.6%) 0 (0.0%)

MCA M2 inferior 7 (6.4%) 6 (3.3%) 4 (7.8%)

ASPECTS 8.0 [5.0–9.0] 7.0 [5.0–9.0] 7.0 [5.0–9.0] 0.892

Pre-procedural DWI volume (mL) 23.5 ± 29.1 23.0 ± 30.9 23.5 ± 33.9 0.990

Onset to pre-procedural MRI (min) 225 ± 159 234 ± 143 247 ± 171 0.694

Table 1. Baseline Characteristics and Pre-procedural Factors of Included Patients Grouped According to Glucose Level on Admission. The data are presented as the mean ± standard deviation, number (%), or median [interquartile range]. *Normoglycemia vs. moderate hyperglycemia vs. overt hyperglycemia, p < 0.05, Bonferroni post-hoc test;

normoglycemia/moderate hyperglycemia vs. overt hyperglycemia, p < 0.05, Bonferroni post-hoc test;

normoglycemia vs. moderate hyperglycemia, p < 0.05, Bonferroni post-hoc test.

HbA

1c

, glycated hemoglobin; mRS, modified Rankin Scale; IQR, interquartile range; NIHSS, National Institutes of Health Stroke Scale; SBP, systolic blood pressure; DBP, diastolic blood pressure; MBP, mean blood pressure;

WBC, white blood cell; ESR, erythrocyte sedimentation rate; ICA, internal carotid artery; MCA, middle

cerebral artery; ASPECTS, Alberta Stroke Program Early CT score; DWI, diffusion-weighted imaging.

(4)

glucose status on admission and hemorrhagic complications, a logistic regression analysis was performed to assess the occurrence of parenchymal hematoma type 2 adjusted for age, sex, initial NIHSS score, IV tPA treatment, pre-procedure DWI volume, onset-to-puncture time, and site of occlusion. For subgroup analyses, the variables were evaluated again in the reperfusion (successful) group (post-procedural mTICI 2b – 3) and non-reperfusion (unsuccessful) group (mTICI 0–2a) for association between glucose levels and treatment out- comes, post-procedural infarct volume and occurrence of parenchymal hematoma type 2, respectively. The data are presented as the mean ± standard deviation or as the median (interquartile range). A p-value less than 0.05 was considered to be statistically significant. All statistical analyses were performed using IBM SPSS Statistics version 22 software (IBM Corp., Armonk, NY, USA).

Results

Baseline characteristics stratified by admission glucose status. Of the 720 patients in the registry, 341 met the inclusion criteria for this study. One hundred and ten of these patients presented with normoglyce- mia, 180 presented with moderate hyperglycemia, and 51 presented with overt hyperglycemia. The clinical char- acteristics, pre-procedural factors, reperfusion treatment, and outcomes according to glucose status on admission are outlined in Table 1. There was a statistically significant difference in glucose levels across the trichotomized groups by definition, but the presence of comorbid DM was significantly increased in the group with overt hyper- glycemia (10.0% and 18.9% vs. 86.3%, respectively; p < 0.001). Similar trends were observed for HbA

1c

levels (5.7% ± 0.5% and 5.9% ± 0.6% vs. 8.1% ± 1.9%, respectively; p < 0.001). Initial NIHSS scores were not signifi- cantly different between the groups (15.0 [11.00–18.25] vs. 16.0 [12.0–20.0] vs. 16.0 [13.0–20.0], respectively;

p = 0.084). In terms of laboratory data, white blood cell count, and erythrocyte sedimentation rate on admission increased significantly in hyperglycemia groups.

Reperfusion treatment and outcomes. In the pre-procedural imaging data, the initial site of occlusion, ASPECTS, and pre-procedural DWI stroke volumes did not differ significantly between the three groups. Onset to pre-procedural MRI, onset-to-puncture time, procedure time, and onset to post-procedural MRI also did not differ significantly between the three groups.

In terms of reperfusion methods and outcomes (Table 2), treatment with IV tPA was more common in the normoglycemia and moderate hyperglycemia groups than in the overt hyperglycemia group (66.4% and 60.6%

vs. 39.2%, respectively; p = 0.004). Regarding EVT, there was no significant difference in use of stent retrieval and direct aspiration methods between the three groups. There was also no significant difference in the rate of achievement of successful reperfusion between the three groups.

Poor outcomes at 3 months weres significantly more common in the moderate and overt hyperglycemia groups than in the normoglycemia group (42.2% and 45.1% vs. 25.5%, respectively; p = 0.007). When glucose status on admission was incorporated into a logistic regression model for poor outcome (Table 3), both moderate hyperglycemia (odds ratio [OR] 2.37, 95% confidence interval [CI] 1.26–4.45, p = 0.007) and overt hyperglycemia (OR 2.84, 95% CI 1.19–6.81, p = 0.019) were independent predictors of a poor outcome when compared with normoglycemia as a reference, suggesting a cut-off admission glucose value of >110 mg/dL for a poor prognosis.

When logistic regression analysis was performed on the basis of reperfusion status, this association was still seen in the non-reperfusion group (n = 69) but not in the reperfusion group (n = 272).

Normoglycemia

(n = 110) Moderate hyperglycemia

(n = 180) Overt hyperglycemia

(n = 51) p-value

Reperfusion treatment

IV tPA infusion 73 (66.4%) 109 (60.6%) 20 (39.2%) 0.004

Onset-to-puncture time (min) 286 ± 165 298 ± 145 307 ± 173 0.680

Procedure time (min) 71.1 ± 39.2 69.9 ± 40.0 67.5 ± 45.9 0.874

Successful reperfusion 84 (76.4%) 146 (81.1%) 42 (82.4%) 0.548

Outcomes

Hemorrhagic transformation 0.045

No hemorrhage 86 (78.2%) 132 (73.3%) 30 (58.8%)

HI type 1 11 (10.0%) 15 (8.3%) 3 (5.9%)

HI type 2 4 (3.6%) 18 (10.0%) 8 (15.7%)

PH type 1 6 (5.5%) 10 (5.6%) 5 (9.8%)

PH type 2 3 (2.7%) 5 (2.8%) 5 (9.8%)

Post-procedural DWI volume (mL) 49.1 ± 53.5 64.0 ± 77.8 71.5 ± 93.5 0.126 Onset to post-procedural MRI (min) 6109 ± 2462 6218 ± 2478 5865 ± 2404 0.662

Infarct growth (mL) 25.6 ± 40.8 41.0 ± 65.3 48.0 ± 79.4 0.045

*

3-month mRS 3–6 28 (25.5%) 76 (42.2%) 23 (45.1%) 0.007

Table 2. Reperfusion Treatment and Outcomes According to Glucose Level Groups. The data are presented as the mean ± standard deviation, or number (%). *Normoglycemia vs. moderate hyperglycemia, p = 0.114;

normoglycemia vs. overt hyperglycemia, p = 0.095, Bonferroni post-hoc test. IV tPA, intravenous tissue

plasminogen activator; DWI, diffusion-weighted imaging; HI, hemorrhagic infarct; PH, parenchymal

hematoma.

(5)

Infarct growth. When infarct growth was compared according to glucose status on admission, there was a sig- nificant intergroup difference (25.6 ± 40.8 mL vs. 41.0 ± 65.3 mL vs. 48.0 ± 79.4 mL, respectively; p = 0.045). When patients were dichotomized into normoglycemia and hyperglycemia groups (cut-off glucose level, 110 mg/dL), post-procedural DWI stroke volume was significantly greater in the hyperglycemia group (49.1 ± 53.5 mL vs.

65.6 ± 81.4 mL, respectively; p

adjusted

= 0.003) although pre-procedural volumes were not significantly differ- ent (23.5 ± 29.1 mL vs. 23.1 ± 31.5 mL, p = 0.913). Similar to the clinical outcomes, this difference was signif- icant in the non-reperfusion group (normoglycemia vs. hyperglycemia; 54.0 ± 58.2 mL vs. 126.0 ± 109.5 mL, p

adjusted

= 0.005), but not for the reperfusion groups (normoglycemia vs. hyperglycemia; 47.6 ± 52.2 mL vs.

51.9 ± 66.5 mL, p

adjusted

= 0.187, Fig. 1). Analyses of Clinical characteristics, pre-procedural factors, reperfusion treatment, and outcomes not shown in Table 1 are shown in Supplementary Table 2.

Hemorrhagic complications. Hemorrhagic complications increased mainly in the overt hyperglycemia group (p = 0.045) (Table 2). When glucose status on admission was incorporated into a logistic regression model to assess hyperglycemia as a risk factor for parenchymal hematoma type 2 (Table 4), only overt hyperglycemia showed an independent association (OR 9.28, CI 1.66–51.88, p = 0.011) referenced by normoglycemia. In terms of post-procedural reperfusion status, overt hyperglycemia was associated with parenchymal hematoma type 2 only in the reperfusion group (OR 12.34, CI 1.60–95.07), as referenced to normoglycemia, p = 0.016), but the association was insignificant in the non-reperfusion group. With the same covariable adjustment, overt hyperg- lycemia was also confirmed to be as an independent predictor of parenchymal hematoma type 1–2 (OR 3.75, CI 1.25–11.23, p = 0.018) and any type of hemorrhagic transformation (OR 3.10, CI 1.39–6.92, p = 0.006).

Discussion

The present study demonstrates that high glucose levels on admission are independently associated with poor 3-month outcomes, infarct growth, and significant hemorrhagic complications; however, the glucose level cut-off points for predicting these outcomes varied. Overall, hyperglycemia was associated with a poor functional out- come and infarct growth, which were predominantly seen in the non-reperfusion subgroup. In contrast, overt hyperglycemia was associated with hemorrhagic complications, which were predominant in the reperfusion sub- group. Ten percent of patients in the normoglycemia group had DM, 18% in the moderate hyperglycemia group, and 80% in the overt hyperglycemia group, with a similar trend observed for mean HbA

1c

levels, suggesting

Overall (n = 341) Reperfusion subgroup

(n = 272) Non-reperfusion subgroup (n = 69)

OR (95% CI) p-value OR (95% CI) p-value OR (95% CI) p-value

Age 1.05 (1.03–1.08) <0.001 1.05 (1.02–1.08) 0.001 1.07 (1.01–1.14) 0.030

Sex 0.94 (0.55–1.62) 0.826 0.92 (0.49–1.71) 0.793 1.43 (0.36–5.73) 0.616

Premorbid mRS score 0.083 0.126 0.598

  mRS0 Reference Reference Reference

  mRS1 2.37 (1.05–5.35) 0.039 2.40 (0.94–6.14) 0.068 4.72 (0.50–44.61) 0.176

  mRS2 4.53 (1.13–18.18) 0.033 4.69 (1.08–20.44) 0.040 — 0.999

  mRS3 1.13 (0.23–5.58) 0.879 1.81 (0.29–11.21) 0.525 0.47 (0.01–21.22) 0.700

  mRS4 2.12 (0.06–78.41) 0.684 2.43 (0.07–89.64) 0.629

Admission NIHSS score 1.12 (1.06–1.19) < 0.001 1.12 (1.05–1.20) 0.001 1.19 (1.01–1.39) 0.035

IV tPA 1.134 (0.58–2.22) 0.714 1.14 (0.52–2.50) 0.735 1.49 (0.22–10.15) 0.682

Baseline intracranial occlusion 0.917 0.775 0.904

  ICA T Reference Reference Reference

  ICA I 1.01 (0.33–3.09) 0.993 0.88 (0.27–2.95) 0.840 3.68 (0.03–503.34) 0.604

  MCA M1 1.00 (0.54–1.88) 0.990 0.92 (0.45–1.87) 0.822 0.84 (0.16–4.46) 0.835

  MCA M2 superior 0.54 (0.12–2.32) 0.403 0.29 (0.05–1.94) 0.203 1.20 (0.22–6.44) 0.999

  MCA M2 inferior 1.28 (0.36–4.62) 0.706 1.21 (0.27–5.44) 0.804 — 0.471

Pre-treatment DWI volume 1.02 (1.01–1.03) 0.002 1.02 (1.01–1.03) 0.002 1.00 (0.98–1.02) 0.704 Onset to puncture 1.00 (1.00–1.00) 0.044 1.00 (1.00–1.01) 0.025 1.00 (1.00–1.01) 0.604 Final mTICI 2b–3 0.24 (0.12–0.46) <0.001

PH2 or SAH 3–4 8.25 (2.15–31.66) 0.002 3.97 (0.88–17.89) 0.073 — 0.999

Glucose level 0.014 0.171 0.007

  Normoglycemia Reference Reference Reference

  Moderate hyperglycemia 2.37 (1.26–4.45) 0.007 1.86 (0.90–3.82) 0.094 10.99 (2.15–56.25) 0.016   Overt hyperglycemia 2.84 (1.19–6.81) 0.019 2.24 (0.83–6.02) 0.112 35.5 (1.93–653.02) 0.002

Table 3. Logistic Regression Model of Hyperglycemia as a Risk Factor for a Poor 3-Month Outcome in

Patients with Acute Ischemic Stroke of the Anterior Circulation after Endovascular Revascularization Therapy

According to Reperfusion Status. OR, odds ratio; CI, confidence interval; mRS, modified Rankin Scale; NIHSS,

National Institutes of Health Stroke Scale; IV tPA, intravenous tissue plasminogen activator; ICA, internal

carotid artery; MCA, middle cerebral artery; DWI, diffusion-weighted imaging; mTICI, modified Treatment In

Cerebral Ischemia; PH2, parenchymal hematoma type 2; SAH, subarachnoid hemorrhage.

(6)

that the overt hyperglycemia group could have had sustained hyperglycemia, while the moderate hyperglycemia group might be more representative of hyperglycemia under non-diabetic conditions.

The poor outcomes were in parallel with infarct growth in terms of the cut-off level of hyperglycemia on admission, which was relatively low. Post-procedural infarct volumes were significantly larger in the moderate and overt hyperglycemia groups than in the normoglycemia group, and both groups were independently associ- ated with poor outcome. On this basis, infarct growth seems to be a mediator between hyperglycemia and a poor outcome; however, there was no correlation between glucose level on admission and infarct growth nor an inter- action between glucose level and infarct growth in terms of poor outcomes (data not shown). This suggests that this association may not be linear, and an approach using cut-off values may better represent the phenomenon, as shown in our study. Regarding the association with poor outcomes or infarct growth, the significance of glucose levels as an independent predictor disappeared in multivariable analysis when only patients with successful reper- fusion were analyzed, whereas both significant associations were still present in patients with unsuccessful reper- fusion. This finding implies that successful reperfusion may overcome the negative effects of hyperglycemia. This observation is partly supported by a recent randomized controlled trial known as MR CLEAN, which showed no interaction of hyperglycemia and EVT effect when compared with non-endovascular treatment, indicating that hyperglycemia on admission is not a contraindication in candidates for EVT

21

.

Several mechanisms via which hyperglycemia leads to poor outcomes and infarct growth can be postulated,

focusing on moderate hyperglycemia. First, the concept of stress hyperglycemia can be applied to our find-

ings. A previous meta-analysis demonstrated a strong correlation between glucose levels > 110 to 126 mg/dL

and poor outcomes only in non-diabetic patients with acute ischemic stroke, leading to this concept

19

. In

the literature, glucose levels have been shown to increase with increasing stroke severity via activation of the

hypothalamic-pituitary-adrenal axis

22,23

. Second, the possibility of a direct contribution of hyperglycemia itself

Figure 1. Changes in Pre-procedural and Post-procedural Diffusion-Weighted Image Volume According

to the Presence of Hyperglycemia on Admission. (A) Total population, (B) reperfusion subgroup, and (C)

non-reperfusion subgroup. Post-procedural infarct volumes were compared using analysis of covariance

and adjusting for pre-procedural DWI volume, age, sex, site of occlusion, and successful reperfusion.; DWI,

diffusion-weighted imaging.

(7)

to the aggravation of ischemic stroke needs to be considered. Infarct growth can be precipitated by decreased reperfusion and penumbral salvage, both of which are associated with hyperglycemia

4,24

. Several studies have reported the deleterious effects of hyperglycemia in patients with non-lacunar focal ischemia and global ischemia.

Further, hyperglycemia has been associated with reduced penumbral salvage in patients with perfusion-diffusion mismatch

25,26

. A third mechanism for understanding the impact of moderate hyperglycemia on acute stroke that is worth discussing is that presenting hyperglycemia may represent pre-existing abnormalities in glucose metab- olism. A large number of patients with ischemic stroke and no history of DM are found to have insulin resistance, impaired glucose metabolism, or DM at follow-up

27,28

. While presenting hyperglycemia does not represent overt DM, it may reflect insulin resistance and comprise the metabolic syndrome, which is known to be associated with poor leptomeningeal collateral status in acute ischemic stroke

29

. This could be an alternative but complementary explanation for predominant infarct growth in the non-reperfusion subgroup seen in our study. Pre-diabetic conditions were not addressed in our study, and further insights are needed to address this issue.

In the present study, overt hyperglycemia, which is more clearly indicative of diabetic comorbidity, was asso- ciated with severe intracerebral hemorrhagic complications, especially in the reperfusion subgroup. Our findings suggest that reperfusion injury can be exacerbated by chronic sustained hyperglycemia. The association between DM and ICH in patients with ischemic stroke, especially after IV thrombolysis, is well recognized

30

. However, IV rt-PA was not a predictor of parenchymal hematoma and was not associated with the clinical outcomes in our endovascular population. An association between sustained hyperglycemia or DM and hemorrhagic transfor- mation has been recently reported in endovascular populations; however, in one study, the endovascular devices and methods used were somewhat outdated

31

, and in another study using stent retrievers, the significance for hyperglycemia was not shown, but DM was confirmed to be significant

32

. Exacerbated reperfusion injury in overt hyperglycemia may be explained as follows. Oxidative stress and activation of inflammation are reported to be aggravated, resulting in dysfunction of the blood-brain barrier

33–35

. Moreover, severe hyperglycemia significantly worsens cortical intracellular acidosis in the brain and mitochondrial dysfunction in the ischemic penumbra

36

. Such mechanisms can lead to increases in hemorrhagic transformation and extensive hemorrhage, as revealed in a feline model of MCA occlusion

37

. An elevated erythrocyte sedimentation rate, which indicates an inflammatory reaction, was seen in patients with overt hyperglycemia in our study.

A previous large-scale study of patients who received IV tPA yielded results similar to those of the present study in terms of glucose cut-off values. The Safe Implementation of Treatment in Stroke International Stroke Thrombolysis Register (SITS-ISTR), a study involving over 16,000 patients with acute ischemic stroke who were treated with thrombolysis, showed that glucose levels > 120 mg/dL were associated with increased mortality, while levels > 180 mg/dL were associated with symptomatic ICH per the SITS-MOST criteria

38

. In a subgroup analysis according to history of diabetes, the ORs for mortality and functional dependence were significantly higher for glucose levels > 120 mg/dL in non-diabetic patients, while the values for mortality and functional inde- pendence were 181–200 mg/dL and 160 mg/dL, respectively, in diabetic patients. The OR for symptomatic ICH

Overall (n = 341) Reperfusion subgroup

(n = 272) Non-reperfusion

subgroup (n = 69) OR (95% CI) p-value OR (95% CI) p-value OR (95%

CI) p-value

Age 0.99 (0.94–1.04) 0.670 1.00 (0.93–1.04) 0.542 — 1.000

Sex 1.89 (0.51–6.98) 0.342 1.30 (0.33–5.08) 0.702 — 1.000

Admission NIHSS score 1.04 (0.92–1.17) 0.583 1.03 (0.90–1.19) 0.634 — 1.000

IV tPA 0.93 (0.21–4.11) 0.926 1.22 (0.24–6.33) 0.810 — 0.999

Baseline intracranial occlusion 0.048 0.111 1.000

  ICA T Reference Reference Reference

  ICA I 0.00 (0.00) 0.998 0.00 (0.00) 0.998 — 1.000

  MCA M1 0.15 (0.03–0.66) 0.012 0.09 (0.02–0.52) 0.007 — 1.000

  MCA M2 superior 3.66 (0.60–22.21) 0.159 1.42 (0.14–14.36) 0.768 — 0.999

  MCA M2 inferior 0.00 (0.00) 0.998 0.00 (0.00) 0.999 — 1.000

Pre-procedure DWI volume 1.01 (1.00–1.03) 0.126 1.01 (1.00–1.03) 0.130 — 1.000 Onset to puncture 1.00 (1.00–1.01) 0.730 1.00 (1.00–1.01) 0.300 — 0.999 Final mTICI 2b–3 1.52 (0.28–8.14) 0.624

Glucose level 0.009 0.025 1.000

Normoglycemia Reference Reference Reference

Moderate hyperglycemia 0.92 (0.20–4.36) 0.920 1.39 (0.24–8.15) 0.717 — 1.000 Overt hyperglycemia 9.28 (1.66–51.88) 0.011 12.34 (1.60–

95.07) 0.016 — 1.000

Table 4. Logistic Regression Model of Hyperglycemia as a Risk Factor for Post-procedural Parenchymal

Hematoma Type 2 in Patients with Acute Ischemic Stroke of the Anterior Circulation after Endovascular

Revascularization Therapy According to Reperfusion Status. OR, odds ratio; CI, confidence interval; NIHSS,

National Institutes of Health Stroke Scale; IV tPA, intravenous tissue plasminogen activator; ICA, internal

carotid artery; MCA, middle cerebral artery; DWI, diffusion-weighted imaging; mTICI, modified Treatment In

Cerebral Ischemia.

(8)

per the SITS-MOST criteria was significantly higher in patients with glucose levels of 181–200 mg/dL compared with that for patients who had lower glucose levels with or without a history of diabetes. The SITS-ISTR results and our present findings both provide dual glucose cut-off values at similar ranges, with the lower value showing an association with poor outcome and the higher value showing an association with hemorrhagic complications.

Our present research also reveals that higher glucose cut-off values may be associated with sustained hyperglyce- mia and comorbidity of DM.

The present study has some limitations. First, although our analysis included multicenter data, it was limited by an observational study design. Nonetheless, the population was medium-sized and presented with accept- able revascularization profiles. Second, the retrospective study design precluded the use of symptomatic ICH as an endpoint, which is widely used in EVT trials. However, parenchymal hematoma type 2, which was used in the current study, is known to be strongly associated with neurologic deterioration

39

. Third, patients were only included when both pre-procedural and post-procedural MRI data were available, allowing for clinical evaluation of infarct growth. However, post-procedural MRI data were not available for patients with severe pathology or for those who died, such that clinical outcomes in our study population may have been positively overestimated.

Nevertheless, the analysis used both pre-procedural and short-term post-procedural DWI, which is very rare, so we believe that this study must have a novel value. Finally, the management of hyperglycemia, which can subse- quently affect imaging and clinical outcomes, might have differed between hospitals and attending physicians.

Management of hyperglycemia is another unresolved issue in acute ischemic stroke that is currently being inves- tigated in therapeutic trials, such as the Stroke Hyperglycemia Insulin Network Effort (SHINE) trial

40

.

In conclusion, moderate to overt hyperglycemia on admission was associated with a poor outcome and infarct growth in Korean patients with acute intracranial large artery occlusion who underwent EVT but did not achieve successful reperfusion. Additionally, overt hyperglycemia was associated with significant hemorrhagic complica- tions, especially in patients with successful reperfusion. These findings should be confirmed in future large-scale prospective cohorts.

References

1. Poppe, A. Y. et al. Admission hyperglycemia predicts a worse outcome in stroke patients treated with intravenous thrombolysis.

Diabetes care 32, 617–622, https://doi.org/10.2337/dc08-1754 (2009).

2. Davalos, A. et al. Neurological deterioration in acute ischemic stroke: potential predictors and associated factors in the European cooperative acute stroke study (ECASS) I. Stroke; a journal of cerebral circulation 30, 2631–2636 (1999).

3. Lansberg, M. G., Albers, G. W. & Wijman, C. A. Symptomatic intracerebral hemorrhage following thrombolytic therapy for acute ischemic stroke: a review of the risk factors. Cerebrovasc Dis 24, 1–10, https://doi.org/10.1159/000103110 (2007).

4. Kruyt, N. D., Biessels, G. J., Devries, J. H. & Roos, Y. B. Hyperglycemia in acute ischemic stroke: pathophysiology and clinical management. Nature reviews. Neurology 6, 145–155, https://doi.org/10.1038/nrneurol.2009.231 (2010).

5. Berkhemer, O. A. et al. A randomized trial of intraarterial treatment for acute ischemic stroke. The New England journal of medicine 372, 11–20, https://doi.org/10.1056/NEJMoa1411587 (2015).

6. Goyal, M. et al. Randomized assessment of rapid endovascular treatment of ischemic stroke. The New England journal of medicine 372, 1019–1030, https://doi.org/10.1056/NEJMoa1414905 (2015).

7. Campbell, B. C. et al. Endovascular therapy for ischemic stroke with perfusion-imaging selection. The New England journal of medicine 372, 1009–1018, https://doi.org/10.1056/NEJMoa1414792 (2015).

8. Saver, J. L. et al. Stent-retriever thrombectomy after intravenous t-PA vs. t-PA alone in stroke. The New England journal of medicine 372, 2285–2295, https://doi.org/10.1056/NEJMoa1415061 (2015).

9. Jovin, T. G. et al. Thrombectomy within 8 hours after symptom onset in ischemic stroke. The New England journal of medicine 372, 2296–2306, https://doi.org/10.1056/NEJMoa1503780 (2015).

10. Lee, J. S. et al. Temporal Changes in Care Processes and Outcomes for Endovascular Treatment of Acute Ischemic Stroke:

Retrospective Registry Data from Three Korean Centers. Neurointervention 13, 2–12, https://doi.org/10.5469/neuroint.2018.13.1.2 (2018).

11. Liebeskind, D. S. et al. Carotid I’s, L’s and T’s: collaterals shape the outcome of intracranial carotid occlusion in acute ischemic stroke.

Journal of neurointerventional surgery 7, 402–407, https://doi.org/10.1136/neurintsurg-2014-011231 (2015).

12. Tomsick, T. et al. Revascularization results in the Interventional Management of Stroke II trial. AJNR. American journal of neuroradiology 29, 582–587, https://doi.org/10.3174/ajnr.A0843 (2008).

13. Fiorelli, M. et al. Hemorrhagic transformation within 36 hours of a cerebral infarct: relationships with early clinical deterioration and 3-month outcome in the European Cooperative Acute Stroke Study I (ECASS I) cohort. Stroke; a journal of cerebral circulation 30, 2280–2284 (1999).

14. Frontera, J. A. et al. Prediction of symptomatic vasospasm after subarachnoid hemorrhage: the modified fisher scale. Neurosurgery 59, 21-27; discussion; https://doi.org/10.1227/01.NEU.0000218821.34014.1B (2006).

15. Kang, D. H. et al. Direct thrombus retrieval using the reperfusion catheter of the penumbra system: forced-suction thrombectomy in acute ischemic stroke. AJNR. American journal of neuroradiology 32, 283–287, https://doi.org/10.3174/ajnr.A2299 (2011).

16. Roth, C. et al. Stent-assisted mechanical recanalization for treatment of acute intracerebral artery occlusions. Stroke; a journal of cerebral circulation 41, 2559–2567, https://doi.org/10.1161/strokeaha.110.592071 (2010).

17. Saver, J. L. et al. Solitaire flow restoration device versus the Merci Retriever in patients with acute ischaemic stroke (SWIFT): a randomised, parallel-group, non-inferiority trial. Lancet (London, England) 380, 1241–1249, https://doi.org/10.1016/S0140- 6736(12)61384-1 (2012).

18. Nogueira, R. G. et al. Trevo versus Merci retrievers for thrombectomy revascularisation of large vessel occlusions in acute ischaemic stroke (TREVO 2): a randomised trial. Lancet (London, England) 380, 1231–1240, https://doi.org/10.1016/S0140-6736(12)61299-9 (2012).

19. Capes, S. E., Hunt, D., Malmberg, K., Pathak, P. & Gerstein, H. C. Stress hyperglycemia and prognosis of stroke in nondiabetic and diabetic patients: a systematic overview. Stroke; a journal of cerebral circulation 32, 2426–2432 (2001).

20. Bruno, A., Saha, C., Williams, L. S. & Shankar, R. IV insulin during acute cerebral infarction in diabetic patients. Neurology 62, 1441–1442 (2004).

21. Osei, E. et al. Admission Glucose and Effect of Intra-Arterial Treatment in Patients With Acute Ischemic Stroke. Stroke 48, 1299–1305, https://doi.org/10.1161/STROKEAHA.116.016071 (2017).

22. Feibel, J. H., Hardy, P. M., Campbell, R. G., Goldstein, M. N. & Joynt, R. J. Prognostic value of the stress response following stroke.

Jama 238, 1374–1376 (1977).

23. O’Neill, P. A., Davies, I., Fullerton, K. J. & Bennett, D. Stress hormone and blood glucose response following acute stroke in the

elderly. Stroke; a journal of cerebral circulation 22, 842–847 (1991).

(9)

24. Venables, G. S., Miller, S. A., Gibson, G., Hardy, J. A. & Strong, A. J. The effects of hyperglycaemia on changes during reperfusion following focal cerebral ischaemia in the cat. J Neurol Neurosurg Psychiatry 48, 663–669 (1985).

25. Kagansky, N., Levy, S. & Knobler, H. The role of hyperglycemia in acute stroke. Arch Neurol 58, 1209–1212 (2001).

26. Parsons, M. W. et al. Acute hyperglycemia adversely affects stroke outcome: a magnetic resonance imaging and spectroscopy study.

Annals of neurology 52, 20–28, https://doi.org/10.1002/ana.10241 (2002).

27. Vancheri, F. et al. Impaired glucose metabolism in patients with acute stroke and no previous diagnosis of diabetes mellitus. QJM 98, 871–878, https://doi.org/10.1093/qjmed/hci134 (2005).

28. Kernan, W. N. et al. Prevalence of abnormal glucose tolerance following a transient ischemic attack or ischemic stroke. Archives of internal medicine 165, 227–233, https://doi.org/10.1001/archinte.165.2.227 (2005).

29. Menon, B. K. et al. Leptomeningeal collaterals are associated with modifiable metabolic risk factors. Annals of neurology 74, 241–248, https://doi.org/10.1002/ana.23906 (2013).

30. Demchuk, A. M. et al. Serum glucose level and diabetes predict tissue plasminogen activator-related intracerebral hemorrhage in acute ischemic stroke. Stroke; a journal of cerebral circulation 30, 34–39 (1999).

31. Nogueira, R. G. et al. Predictors and clinical relevance of hemorrhagic transformation after endovascular therapy for anterior circulation large vessel occlusion strokes: a multicenter retrospective analysis of 1122 patients. Journal of neurointerventional surgery 7, 16–21, https://doi.org/10.1136/neurintsurg-2013-010743 (2015).

32. Jiang, S. et al. Predictors of Outcome and Hemorrhage in Patients Undergoing Endovascular Therapy with Solitaire Stent for Acute Ischemic Stroke. PloS one 10, e0144452, https://doi.org/10.1371/journal.pone.0144452 (2015).

33. Kamada, H., Yu, F., Nito, C. & Chan, P. H. Influence of hyperglycemia on oxidative stress and matrix metalloproteinase-9 activation after focal cerebral ischemia/reperfusion in rats: relation to blood-brain barrier dysfunction. Stroke; a journal of cerebral circulation 38, 1044–1049, https://doi.org/10.1161/01.STR.0000258041.75739.cb (2007).

34. Bouchard, P., Ghitescu, L. D. & Bendayan, M. Morpho-functional studies of the blood-brain barrier in streptozotocin-induced diabetic rats. Diabetologia 45, 1017–1025, https://doi.org/10.1007/s00125-002-0853-2 (2002).

35. Martini, S. R. & Kent, T. A. Hyperglycemia in acute ischemic stroke: a vascular perspective. Journal of cerebral blood flow and metabolism: official journal of the International Society of Cerebral Blood Flow and Metabolism 27, 435–451, https://doi.org/10.1038/

sj.jcbfm.9600355 (2007).

36. Anderson, R. E., Tan, W. K., Martin, H. S. & Meyer, F. B. Effects of glucose and PaO2 modulation on cortical intracellular acidosis, NADH redox state, and infarction in the ischemic penumbra. Stroke; a journal of cerebral circulation 30, 160–170 (1999).

37. de Courten-Myers, G. M. et al. Hemorrhagic infarct conversion in experimental stroke. Annals of emergency medicine 21, 120–126 (1992).

38. Ahmed, N. et al. Association of admission blood glucose and outcome in patients treated with intravenous thrombolysis: results from the Safe Implementation of Treatments in Stroke International Stroke Thrombolysis Register (SITS-ISTR). Arch Neurol 67, 1123–1130, https://doi.org/10.1001/archneurol.2010.210 (2010).

39. Berger, C. et al. Hemorrhagic transformation of ischemic brain tissue: asymptomatic or symptomatic? Stroke; a journal of cerebral circulation 32, 1330–1335 (2001).

40. Bruno, A. et al. The Stroke Hyperglycemia Insulin Network Effort (SHINE) trial protocol: a randomized, blinded, efficacy trial of standard vs. intensive hyperglycemia management in acute stroke. Int J Stroke 9, 246–251, https://doi.org/10.1111/ijs.12045 (2014).

Acknowledgements

This work was partly supported by the National Research Foundation of Korea (NRF) Grant funded by the Korea Government (MSIP) (NRF-2018R1A2B6007094; J.S.L.).

Author Contributions

S.J.L., Y.H.H., S.I.S. and J.S.L. contributed to the conception and design of the study, acquisiton and analysis of data, and preparation of the manuscript. J.M.H., J.W.C., D.H.K., Y.W.K., Y.S.K., J.H.H., J.S.Y. and C.H.K.

contributed to acquisiton and analysis of data. B.S.Y. contributed to conception and design of study, and preparation of the manuscript. B.O. and A.M.D. contributed to preparation of the manuscript.

Additional Information

Supplementary information accompanies this paper at https://doi.org/10.1038/s41598-018-28175-6.

Competing Interests: The authors declare no competing interests.

Publisher's note: Springer Nature remains neutral with regard to jurisdictional claims in published maps and institutional affiliations.

Open Access This article is licensed under a Creative Commons Attribution 4.0 International License, which permits use, sharing, adaptation, distribution and reproduction in any medium or format, as long as you give appropriate credit to the original author(s) and the source, provide a link to the Cre- ative Commons license, and indicate if changes were made. The images or other third party material in this article are included in the article’s Creative Commons license, unless indicated otherwise in a credit line to the material. If material is not included in the article’s Creative Commons license and your intended use is not per- mitted by statutory regulation or exceeds the permitted use, you will need to obtain permission directly from the copyright holder. To view a copy of this license, visit http://creativecommons.org/licenses/by/4.0/.

© The Author(s) 2018

수치

Table 1.  Baseline Characteristics and Pre-procedural Factors of Included Patients Grouped According to  Glucose Level on Admission
Table 2.  Reperfusion Treatment and Outcomes According to Glucose Level Groups. The data are presented  as the mean ± standard deviation, or number (%)
Table 3.  Logistic Regression Model of Hyperglycemia as a Risk Factor for a Poor 3-Month Outcome in  Patients with Acute Ischemic Stroke of the Anterior Circulation after Endovascular Revascularization Therapy  According to Reperfusion Status
Table 4.  Logistic Regression Model of Hyperglycemia as a Risk Factor for Post-procedural Parenchymal  Hematoma Type 2 in Patients with Acute Ischemic Stroke of the Anterior Circulation after Endovascular  Revascularization Therapy According to Reperfusion

참조

관련 문서

Conclusion: In Neer type II distal clavicle fracture treatment, both groups showed satisfactory result in clinical and radiological outcomes, but the hook plate

The associations of hepatic steatosis and fibrosis using fatty liver index and BARD score with cardiovascular outcomes and mortality in patients with new‑onset type 2

In conclusion, we found that MPV acted as a positive acute phase reactant in children with UTI, and MPV levels were significantly elevated in children with APN on DMSA

Although visceral fat adiposity has known to be associated with clinical, pathologic, and oncologic outcomes in patients with colorectal cancer (CRC), the

ENDOSTROKE, Endovascular Stroke Treatment; BAO, basilar artery occlusion; EVT, endovascular treatment; ASITN/SIR, The American Society of Interventional

The ‘Investigation of outcomes after GOLimumab Discon- tinuation,’ or GOLD, was an observational study involving 10 centers nationwide that analyzed clinical data

This study assessed clinical and patient-reported outcomes and compared them by treatment patterns and adherence at 6 months among uncontrolled hypertensive patients in

Our study has a few limitations. We used the total number of carotid plaques and cPTmax. However, with further quantified or quality-related plaque indices, such as plaque type,