Model
Patrick Mark Singh
*, Chengcheng Chen
*, Zhenmu Chen
*, Young-Do Choi
**†Key Words : Pump-turbine(
펌프 터빈), Internal Flow(
내부유동), Impeller(
임펠러), Flow Velocity(
유속), Static Pressure(
정압) ABSTRACT
This is a study about one of the most widely used hydro machinery all over the world - pump-turbine. The system has an impeller which pumps water to an upper reservoir during the night and the same impeller acts as a runner for turbine mode during the day for providing stable electrical power to the grid. The internal flow analysis is investigated in this study to help understand how the water passes through the passage of the vanes and blades, providing the designer with useful information on the behavior of recirculation flows which could reduce the efficiency of the pump-turbine. The 100 kW pump-turbine model has H = 32 m, Q = 0.336 m
3
/s and N = 1200 min-1
. For this study there are 7 blades, 19 stay vanes and 20 guide vanes.From this study, it was observed that this pump-turbine design showed very good internal flow characteristics with no flow separation and no recirculation flows in normal operation mode.
1. Introduction
Hydropower is one of the oldest forms of extracting energy from nature for industrial applications. This is a study about one of the most widely used hydro machinery all over the world -pump-turbine. Pumped- torage installations provide the most efficient and practical means for storing large quantities of energy
(1)
. The system has an impeller which pumps water to an upper reservoir during the night and the same impeller acts as a runner for turbine mode during the day for providing stable electrical power to the grid.For achieving high efficiency in both modes, the blades of the impeller need to be modified to be suitable for both the pumping and turbine modes. To do this, there are many things that need to be considered for developing a good pump-turbine, such as
performance, internal flow, reliability and cavitation analysis among the common ones. However, as these are very broad topics, this study only investigates the internal flow of the pump-turbine system.
The internal flow analysis is investigated in this study to help understand how the water passes through the passage of the vanes and blades, providing the designer with useful information on the behavior of recirculation flows which could reduce the efficiency of the pump-turbine. This can help make modifications to improve the system efficiency.
2. Modeling and Numerical methods
2.1 Pump-turbine model
The design model of the pump-turbine system can be seen in Fig. 1. The design method used is similar to
* Graduate School, Department of Mechanical Engineering, Mokpo National University, Mokpo
** Department of Mechanical Engineering, Institute of New and Renewable Energy Technology Research, Mokpo National University, Mokpo
† 교신저자(Corresponding Author), E-mail : [email protected]
Fig. 1 Pump-turbine model cross section Fig. 2 Cross sectional view of pump-turbine model and location of velocity and pressure measure
Calculation Type Unsteady State
Turbulence model SST
Mesh type Hexahedral
Rotor stator interface Transient rotor stator
Wall No Slip
Pump mode
Inlet Static pressure
Outlet Mass flow rate
Impeller rotating direction Counter clockwise
Turbine mode
Inlet Total pressure
Outlet Static pressure
Impeller rotating direction Clockwise Table 1 Numerical methods and boundary condition
Fig. 3 The domain part of the pump-turbine system
one suggested by Wang et al
(2)
. As the flow comes in through the spiral casing it first passes the stay vane and then passes through the adjustable guide vanes to the impeller and moves out to the lower reservoir via the draft tube. The 100 kW pump-turbine has H = 32m, Q=0.336 m3
/s and N=1200 min-1
. For this study there are 7 blades, 20 stay vanes (including the tongue) and 20 guide vanes. The runner diameter is 0.264 m.2.2 Numerical methods
Various numerical simulation methods are available from the past decade, which have been discussed in detail by Liu
(3)
, Yang(4)
and Hasmatuchi(5)
. Computational fluid dynamics (CFD) analysis is a very useful tool for investigating the internal flow passage of thepump-turbine. This study uses the ANSYS CFX for numerical calculations
(6)
. The boundary conditions and numerical methods are described in Table 1.Approximately 8.7×10
6
elements of hexahedral grids were used in this analysis with y+ ranging between 12 to 54.The static pressure distribution of the flow passage is investigated at five locations: stay vane inlet (location 1), guide vane inlet (location 2), impeller inlet (location 3), middle of impeller passage (location 4) and impeller outlet (location 5) as illustrated in Fig. 2.
Figure 3 presents the different domains for the stationary and rotating parts with their interfaces.
The General Grid Interface (GGI) connection is used on the interfaces that separate the rotating and stationary domains, as well as adjacent domain components.
A CFD validation test was carried out according to different element numbers and turbulence models as shown in Fig. 4. The SST turbulence model is selected
Fig. 4 CFD validation test according to different element numbers and turbulence models
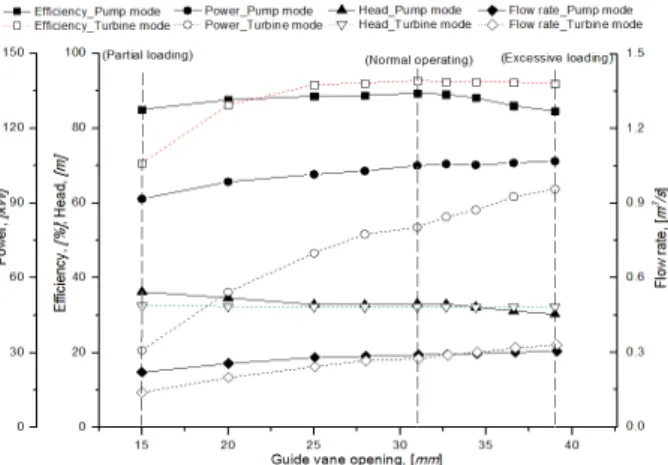
Fig. 5 Performance curves on both turbine mode and pump mode
for all calculations in this study because it is generally used for rotating applications like pumps and turbines and shows relatively better convergence in contrast to the other models.
3. Results and Discussion
3.1 Performance curves
The curves in Fig. 5 give information about the pump-turbine systems performance when it operates at pump mode and turbine mode respectively. The performance curves of the turbine mode are investigated by keeping the head fixed with the vertical distance of the pump-turbine system upper and lower dam height (H=32 m) and adjusting the guide vane opening to obtain a performance curve including the operating conditions of partial, normal and excessive loading. The performance curves of the pump-turbine are drawn by gathering the best efficiency point at every guide vane opening.
For the pump mode, the best efficiency (89.4%) appears at the guide vane opening of 31 mm, flow rate 0.29 m
3
/s, head 33.13 m and power 104.9 kW, defined as normal operating condition. In addition, the partial loading and excessive loading are defined at the guide vane opening 15 mm and guide vane opening 39 mm as shown in Fig. 5. The pump-turbine system can operate at a relatively high and near best efficiency condition from partial loading to excessive loading, the corresponding efficiency change is 84.54 to 85.02 %,respectively.
For the turbine mode, the performance curves present the best efficiency (92.6%) at the guide vane opening of 31 mm, with flow rate 0.28 m
3
/s, head 32.24 m and power 80.29 kW. The efficiency ranges from partial loading to excessive loading is 70.67 to 91.89%, respectively.3.2 Comparison of flow characteristic in the impeller passage on both pump and turbine modes
Fig. 6 to 9 show the pressure contour and velocity vectors distribution of the impeller passage at pump mode and turbine mode, in the operating condition of partial loading, normal operation and excessive loading. From the pressure contours, it is seen that the pressure increases gradually in both modes, no unusual pressure distribution is found in the impeller blade of pump mode, but small region of disharmony pressure distribute at the blade tip of turbine mode high pressure side, as marked inside the dashed circle shown in Fig. 7.
In addition, as presented in Figs. 8 and 9, high velocity appears at the blade suction side on both modes, and the velocity vectors constantly show the flow in the impeller passage is uniform and shock free at all operating conditions. However, vortex and un- uniform flow appear at the partial loading operating condition of turbine mode.
(a) Partial loading (b) Normal operation (c) Excessive loading Fig. 6 Pressure contour at impeller blade (pump mode)
(a) Partial loading (b) Normal operation (c) Excessive loading Fig. 7 Pressure contour at impeller blade (turbine mode)
(a) Partial loading (b) Normal operation (c) Excessive loading Fig. 8 Velocity vector at impeller blade (pump mode)
(a) Partial loading (b) Normal operation (c) Excessive loading Fig. 9 Velocity vector at impeller blade (turbine mode)
3.3 Comparison of flow characteristic in the vane and casing passage on both modes
Moreover, the flow condition in the casing and vanes (stay vane and guide vane) passage is investigated by
the pressure contour and streamline distribution in Figs. 10 to 13. The blue region in Fig. 11 indicates that there is a small region of relative low pressure appears near the guide vane trailing edge, as marked inside the dashed circle.
(a) Partial loading (b) Normal operation (c) Excessive loading Fig. 10 Pressure contours in the casing and vane passages (pump mode)
(a) Partial loading (b) Normal operation (c) Excessive loading Fig. 11 Pressure contours in the casing and vane passages (turbine mode)
(a) Partial loading (b) Normal operation (c) Excessive loading Fig. 12 Streamline distribution in the casing and vane passages (pump mode)
(a) Partial loading (b) Normal operation (c) Excessive loading Fig. 13 Streamline distribution in the casing and vane passages (turbine mode)
The streamlines of the turbine mode shows relatively good flow condition when the water flows through the
volute, stay vane, guide vane. Comparing with the flow condition of turbine mode, the velocity vector of
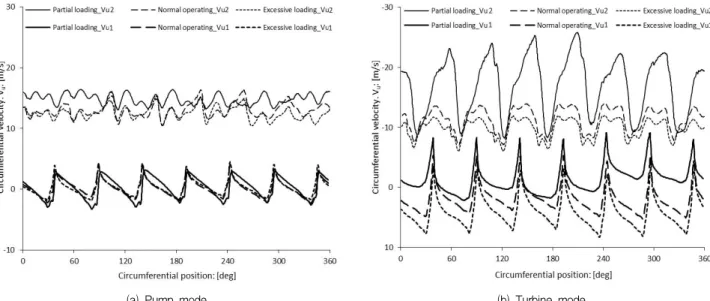
(a) Pump mode (b) Turbine mode Fig. 14 Circumferential velocity distribution at impeller low and high pressure side
pump mode shows the water flows through the volute with a slight screw rotating tendency, which normally appears in pumps and is acceptable. And the guide vane gives relatively large influence to the flow in pump mode, improved by the visible vortex and uneven velocity presented in Fig. 12.
3.4 Static pressure and circumferential velocity investigation of flow passage on both modes
Fig. 14 shows the circumferential velocity of the impeller. vu1 is the circumferential velocity at the location 3 of impeller, vu2 is the radius and circumferential velocity at the location 5 of impeller, the plus or minus of ordinate in Fig. 14 corresponds to the rotational direction of the impeller.
Almost zero circumferential velocity at the pump inlet and turbine outlet which means the energy converted by the impeller is maximum. In addition, the similar average value of vu2 at pump mode and turbine mode indicates this impeller has similar ability of energy conversion when the impeller operates at pump mode and turbine mode.
Further investigation by comparing fluctuation of circumferential velocity of pump mode and turbine mode indicates that the impeller is more stable when it operates at pump mode, proved by the relative small fluctuation of circumferential velocity at pump mode.
The detail value of static pressure distribution on flow passage is investigated on the five locations: stay vane inlet (location 1), guide vane inlet (location 2), impeller inlet (location 3), middle of impeller passage (location 4) and impeller outlet (location 5), as illustrated in Fig. 15.
In Fig. 15(a to e) the static pressure distributions at each location show gradual decrease of static pressure from Locations 1 to 6. The static pressure at location 1, 2, and 3 shows a close value which indicates the vanes gives little negative influence to the flow. In addition, the fluctuation of static pressure at the three location is larger in the pump mode, corresponding to the bad flow condition in Figs. 12 and 13.
4. Conclusions
This study investigated the internal flow of a pump turbine model system in detail. The best efficiency point was found at guide vane opening of 31 mm for both modes. The pump mode achieved maximum efficiency of 89.4% and the turbine mode achieved the maximum efficiency of 92.6%. From this study, it was observed that this pump-turbine model design showed very good internal flow characteristics with no flow separation and no recirculation flows in normal operation mode. Partial and excessive operating conditions were also studied and they showed relatively acceptable results. However, other analysis of reliability and cavitation also needs to
(a) Pump mode at partial loading condition (b) Turbine mode at partial loading condition
(c) Pump mode at normal loading condition (d) Turbine mode at normal loading condition
(e) Pump mode at excessive loading condition (f) Turbine mode at excessive loading condition Fig. 15 Investigation of static pressure at different operating condition of both modes
be considered for the overall performance of the pump- turbine model.
References