Interaction Effect between Weight Perception and Comorbidities on Weight Control Behavior in Overweight and Obese Adults: Is There a Sex Difference?
We investigated the interaction effect between body weight perception and chronic disease comorbidities on body weight control behavior in overweight/obese Korean adults.
We analyzed data from 9,138 overweight/obese adults ≥ 20 yr of age from a nationally representative cross-sectional survey. Multiple logistic regression using an interaction model was performed to estimate the effect of chronic disease comorbidities on weight control behavior regarding weight perception. Adjusted odds ratios for weight control behavior tended to increase significantly with an increasing number of comorbidities in men regardless of weight perception (P < 0.05 for trend), suggesting no interaction. Unlike women who perceived their weight accurately, women who under-perceived their weight did not show significant improvements in weight control behavior even with an increasing number of comorbidities. Thus, a significant interaction between weight perception and comorbidities was found only in women (P = 0.031 for interaction). The effect of the relationship between accurate weight perception and chronic disease comorbidities on weight control behavior varied by sex. Improving awareness of body image is particularly necessary for overweight and obese women to prevent complications.
Keywords: Comorbidity; Body Image; Weight Perception; Obesity Jun Hyun Hwang,1 Dong Hee Ryu,2
and Soon-Woo Park1
1Department of Preventive Medicine, Catholic University of Daegu School of Medicine, Daegu;
2Department of Preventive Medicine, School of Medicine, Kyungpook National University, Daegu, Korea
Received: 27 January 2015 Accepted: 27 April 2015 Address for Correspondence:
Soon-Woo Park, MD
Department of Preventive Medicine, Catholic University of Daegu School of Medicine, 33 Duryugongwon-ro 17-gil, Nam-gu, Daegu 705-718, Korea
Tel: +82.53-650-4493, Fax: +82.53-654-3881 E-mail: parksw@cu.ac.kr
Funding: This work was supported by a research grant from the Catholic University of Daegu in 2014 (20145001).
http://dx.doi.org/10.3346/jkms.2015.30.8.1017 • J Korean Med Sci 2015; 30: 1017-1024
INTRODUCTION
Obesity is an important risk factor for various diseases, includ- ing hypertension, type 2 diabetes, cardiovascular diseases, can- cers, and premature death (1, 2). The worldwide prevalence of overweight and obesity in adults has almost doubled in the past three decades, and 35% of adults were overweight or obese in 2008. Overweight and obesity are the fifth and tenth leading risk factors, respectively, for global death and disease burden mea- sured in disability-adjusted life years and are also associated with high health expenditures (3, 4). As the prevalence of obesi- ty in Korea increased rapidly from 13.9% in 1995 to 31.9% in 2011 (5, 6), the prevalence of cardiovascular diseases increased more than two-fold and that of obesity-related cancers, includ- ing colorectal and breast cancers, has increased steadily in the past 10 yr (7-9). A 5% weight loss reduces the incidence of car- diovascular disease (10). Therefore, it is necessary for overweight and obese adults to lose weight to prevent such diseases and to reduce socioeconomic burden.
Several ways of losing weight include physical activity, dietary intervention, medications, and surgery. Among these methods, behavior modification through physical activity and dietary in- tervention is fundamental. Behavior modification is associated
closely with age, sex, socioeconomic status, chronic disease co- morbidities, and weight status (11-18). Overweight and obese individuals are motivated to participate in weight management programs by developing an accurate weight perception (13, 18- 23). In other words, overweight or obese individuals who under- perceive their weight tend to try less to lose weight and tend to practice unhealthy weight control behaviors, such as fasting, self-induced vomiting, or using laxatives (19-21). Therefore, an accurate weight perception plays an important role in healthy weight control behavior.
As obesity leads to many complications (i.e., cardiovascular disease and stroke) and worsens pre-existing conditions (1, 2), it is particularly important for patients with chronic diseases, such as hypertension and diabetes, to control their weight. A comor- bid condition may affect weight control behavior as well. How- ever, previous studies reported inconsistent results regarding weight management tendencies in overweight and obese peo- ple. Some studies in Western societies reveal that a diagnosis of hypertension or diabetes is not associated with good weight control behavior and that people without a chronic disease try harder to control their weight than those with a chronic disease (14, 24, 25). In contrast, other studies, both in the United States and Korea, have reported the opposite: patients with chronic Medicine General & Social Medicine
disease tend to control their weight better than those without a chronic disease (13, 26). These conflicting results may have oc- curred because weight perception was not considered as a prin- cipal cause, even though it is probably the most important factor influencing weight control behavior. As precise weight percep- tion has a greater effect on weight control than a comorbidity (14) and these factors are correlated, it is necessary to estimate the interaction effect between weight perception and comor- bidities. However, this has not been examined fully in any study.
In addition, women are more sensitive to self-body image and weight management than are men (13). That is, women tend to over-perceive their weight compared with men. This observa- tion may lead to different results between men and women for the relationship between self-perceived weight and weight con- trol behavior and for the interaction effect between weight per- ception and comorbidity on weight behavior.
The aims of this study were to 1) examine the interaction ef- fect between weight perception and chronic disease comorbid- ities on weight control behavior in overweight and obese Kore- an adults and 2) assess the difference between the sexes.
MATERIALS AND METHODS Study population
This study examined data from the Fourth Korea National Health and Nutrition Examination Survey 2007-2009 (KNHANES IV) conducted by the Korea Centers for Disease Control and Preven- tion. The KNHANES is a nationally representative cross-sectional survey using a stratified multistage probability sample of Korean civilians. Additional details of the KNHANES are described else- where (6).
Of the 24,871 subjects who participated in KNHANES VI, the study population was limited to overweight and obese adults aged ≥ 20 yr (measured body mass index [BMI] ≥ 23.0 kg/m2).
We excluded individuals with missing data for BMI, self-per- ceived weight status, weight control behavior, comorbidity of hypertension or diabetes, socioeconomic status (education, in- come, and marital status), smoking, or pregnancy status. As a result, the final sample included 9,138 adults (4,306 men and 4,832 women).
Response variables
Participants described their weight control behavior during the past year with the following four answers: “I tried to 1) lose weight, 2) stay at the same weight, 3) gain weight, or 4) do noth- ing about my weight”. Subjects who responded “tried to lose weight” were categorized as those who underwent a weight management program.
Explanatory variables
Heights and weights of the participants were measured using
standardized anthropometric methods. BMI was used to cate- gorize weight status as overweight (23.0-24.9 kg/m2) or obese (≥ 25.0 kg/m2) (27).
Self-reported weight perception and calculated BMIs were used to assess the accuracy of weight perception. Self-reported weight perception was obtained by asking participants if they considered themselves “very thin, slightly thin, ideal, slightly heavy, or very heavy.” As we restricted the sample to overweight and obese adults, those who perceived themselves as “very thin, slightly thin, or ideal” were defined as under-perceiving their weight, and those who perceived themselves as “very heavy or slightly heavy” were classified as having an accurate weight per- ception (28). Participants who self-reported a diagnosis of hy- pertension or diabetes by a physician were considered to have a comorbid condition and were classified into three groups ac- cording to the number of comorbidities (none, one, or two).
Other covariates
Other covariates included age, socioeconomic status, and smok- ing status. Socioeconomic status was composed of household income (quartile), education level (elementary school or less, middle school, high school, or college and above), and marital status (married and living with a spouse, married and living without a spouse [separated, divorced, or widowed], or unmar- ried). Smoking status was categorized into current smoker, ex- smoker, or never-smoker.
Statistical analysis
A descriptive analysis was conducted to examine the relation- ships between the factors of interest and weight perception.
Multiple logistic regression models were used to assess the as- sociation between weight perception and weight control behav- ior after adjusting for covariates, including age, household in- come, education level, marital status, smoking, BMI, and chron- ic disease comorbidities. An interaction model was used to esti- mate the effect of chronic disease comorbidities on weight con- trol behavior according to weight perception. An interaction term between weight perception and the number of comorbidi- ties was added to the model. All analyses were performed sepa- rately by sex using IBM SPSS Statistics 19.0 (IBM Corp., Armonk, NY, USA), and a P value < 0.05 was considered significant. All results are presented using the complex sampling procedures in SPSS to represent the Korean population.
Ethics statement
KNHANES was approved by the institutional review board of the Korea Centers for Disease Control and Prevention (approval number, 2007-02CON-04-P, 2008-04EXP-01-C, 2009-01CON- 03-2C). All participants signed and submitted an informed consent form.
RESULTS
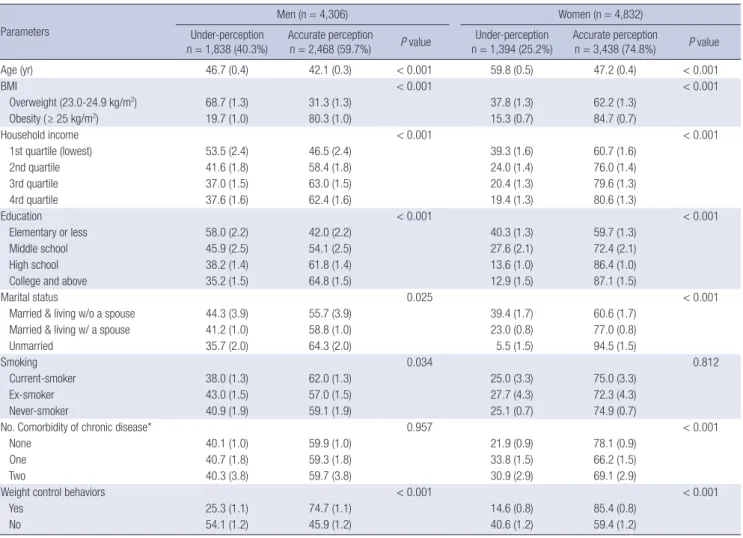
Table 1 shows general characteristics of the study population.
Among the overweight and obese adults, 59.7% of men and 74.8% of women had an accurate body weight perception, whereas 40.3% of men and 25.2% of women misperceived themselves as underweight relative to their calculated BMIs. The subjects who had an accurate weight perception were younger, more obese, unmarried, had a higher household income and education level, and had better weight control behavior than those who under-perceived their weight. Chronic disease co- morbidities were not associated with weight perception in men, but women without a chronic disease appropriately perceived their weight compared with those with a chronic disease.
The unadjusted odds ratios (ORs) for weight control behavior by sex are shown in Table 2. Unadjusted ORs for weight control behavior in both men and women were significantly higher for those who were younger, had a higher household income and education level, and were unmarried, with a linear trend (P <
0.05 for trend). Of the obesity-related variables, BMI had signifi-
cant ORs of 2.68 (95% confidence interval [CI], 2.33-3.09) in men and 1.47 (95% CI, 1.29-1.68) in women. In addition, accu- rately perceiving one’s weight also had significantly higher ORs of 3.48 (95% CI, 3.01-4.03) in men and 4.01 (95% CI, 3.41-4.71) in women, and showed a steeper gradient than that of BMI in both sexes. In contrast, the association between comorbidities and weight control behavior differed between men and wom- en: the number of comorbidities was not associated with weight control behavior in men but had an inverse relationship in women (one comorbidity: OR, 0.65; 95% CI, 0.56-0.75; two: OR, 0.69; 95% CI, 0.53-0.90).
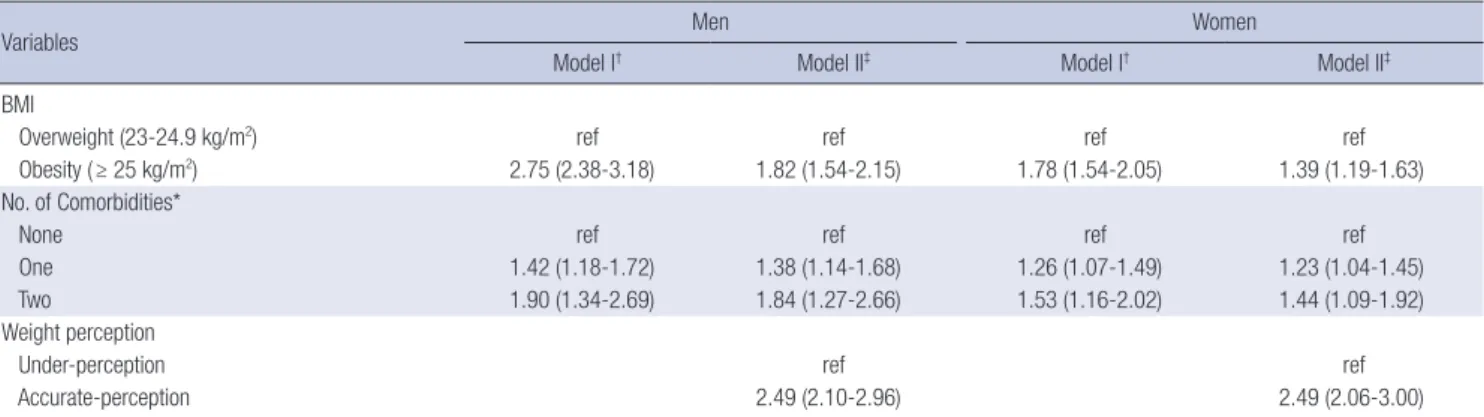
Adjusted ORs were calculated to clarify the associations of weight perception and BMI with weight control behavior (Table 3). BMI still had significant ORs of 2.75 (95% CI, 2.38-3.18) in men and 1.78 (95% CI, 1.54-2.05) in women after adjusting for age, household income, education level, marital status, smok- ing, and chronic disease comorbidities. However, after adjust- ing for weight perception, the association between BMI and weight control behavior was weaker than it was in the unadjust- ed model or the adjusted model that excluded weight percep- Table 1. General characteristics of the participants according to weight perception
Parameters
Men (n = 4,306) Women (n = 4,832)
Under-perception n = 1,838 (40.3%)
Accurate perception
n = 2,468 (59.7%) P value Under-perception n = 1,394 (25.2%)
Accurate perception
n = 3,438 (74.8%) P value
Age (yr) 46.7 (0.4) 42.1 (0.3) < 0.001 59.8 (0.5) 47.2 (0.4) < 0.001
BMI < 0.001 < 0.001
Overweight (23.0-24.9 kg/m2) 68.7 (1.3) 31.3 (1.3) 37.8 (1.3) 62.2 (1.3)
Obesity ( ≥ 25 kg/m2) 19.7 (1.0) 80.3 (1.0) 15.3 (0.7) 84.7 (0.7)
Household income < 0.001 < 0.001
1st quartile (lowest) 53.5 (2.4) 46.5 (2.4) 39.3 (1.6) 60.7 (1.6)
2nd quartile 41.6 (1.8) 58.4 (1.8) 24.0 (1.4) 76.0 (1.4)
3rd quartile 37.0 (1.5) 63.0 (1.5) 20.4 (1.3) 79.6 (1.3)
4rd quartile 37.6 (1.6) 62.4 (1.6) 19.4 (1.3) 80.6 (1.3)
Education < 0.001 < 0.001
Elementary or less 58.0 (2.2) 42.0 (2.2) 40.3 (1.3) 59.7 (1.3)
Middle school 45.9 (2.5) 54.1 (2.5) 27.6 (2.1) 72.4 (2.1)
High school 38.2 (1.4) 61.8 (1.4) 13.6 (1.0) 86.4 (1.0)
College and above 35.2 (1.5) 64.8 (1.5) 12.9 (1.5) 87.1 (1.5)
Marital status 0.025 < 0.001
Married & living w/o a spouse 44.3 (3.9) 55.7 (3.9) 39.4 (1.7) 60.6 (1.7)
Married & living w/ a spouse 41.2 (1.0) 58.8 (1.0) 23.0 (0.8) 77.0 (0.8)
Unmarried 35.7 (2.0) 64.3 (2.0) 5.5 (1.5) 94.5 (1.5)
Smoking 0.034 0.812
Current-smoker 38.0 (1.3) 62.0 (1.3) 25.0 (3.3) 75.0 (3.3)
Ex-smoker 43.0 (1.5) 57.0 (1.5) 27.7 (4.3) 72.3 (4.3)
Never-smoker 40.9 (1.9) 59.1 (1.9) 25.1 (0.7) 74.9 (0.7)
No. Comorbidity of chronic disease* 0.957 < 0.001
None 40.1 (1.0) 59.9 (1.0) 21.9 (0.9) 78.1 (0.9)
One 40.7 (1.8) 59.3 (1.8) 33.8 (1.5) 66.2 (1.5)
Two 40.3 (3.8) 59.7 (3.8) 30.9 (2.9) 69.1 (2.9)
Weight control behaviors < 0.001 < 0.001
Yes 25.3 (1.1) 74.7 (1.1) 14.6 (0.8) 85.4 (0.8)
No 54.1 (1.2) 45.9 (1.2) 40.6 (1.2) 59.4 (1.2)
Values represent weighted percentages or means (standard error) from a complex sampling analysis. *Self-reported as having received a diagnosis of hypertension or diabetes by a physician.
Table 2. Unadjusted odds ratios (95% confidence intervals) for weight control behavior by sex
Variables Men Women
OR Ptrend OR Ptrend
Age < 0.001 < 0.001
20-39 3.04 (2.25-4.09) 8.37 (6.58-10.65)
40-49 2.91 (2.16-3.92) 5.70 (4.43-7.33)
50-59 2.69 (1.96-3.68) 4.90 (3.88-6.20)
60-69 1.92 (1.39-2.65) 3.07 (2.41-3.92)
70+ ref ref
BMI < 0.001 < 0.001
Overweight (23.0-24.9 kg/m2) ref ref
Obesity ( ≥ 25 kg/m2) 2.68 (2.33-3.09) 1.47 (1.29-1.68)
Weight perception < 0.001 < 0.001
Under-perception ref ref
Accurate perception 3.48 (3.01-4.03) 4.01 (3.41-4.71)
Household income < 0.001 < 0.001
1st quartile(lowest) ref ref
2nd quartile 1.47 (1.16-1.86) 1.81 (1.49-2.20)
3rd quartile 1.50 (1.18-1.92) 2.19 (1.79-2.69)
4rd quartile 2.09 (1.66-2.65) 2.62 (2.14-3.19)
Education < 0.001 < 0.001
Elementary ref ref
Middle 1.81 (1.39-2.37) 2.08 (1.71-2.54)
High 1.78 (1.42-2.20) 2.74 (2.33-3.22)
College 2.47(1.99-3.05) 3.45 (2.80-4.25)
Marital status 0.021 < 0.001
Married living without spouse ref ref
Married living with spouse 1.12 (0.84-1.50) 1.94 (1.64-2.28)
Unmarried 1.36 (0.99-1.89) 3.99 (2.87-5.55)
Smoking < 0.001 0.343
Current-smoker ref ref
Ex-smoker 1.38 (1.19-1.60) 0.81 (0.49-1.33)
Never-smoker 1.43 (1.20-1.72 ) 1.08 (0.78-1.51)
No. of Comorbidities* 0.033 < 0.001
None ref ref
One 1.13 (0.96-1.33) 0.65 (0.56-0.75)
Two 1.33 (0.96-1.86) 0.69 (0.53-0.90)
*Self-reported as having received a diagnosis of hypertension or diabetes by a physician.
Table 3. Adjusted odds ratios (95% confidence intervals) for the effects of body mass index (BMI), weight perception, and the number of chronic comorbid conditions on weight control behavior by sex
Variables Men Women
Model I† Model II‡ Model I† Model II‡
BMI
Overweight (23-24.9 kg/m2) ref ref ref ref
Obesity ( ≥ 25 kg/m2) 2.75 (2.38-3.18) 1.82 (1.54-2.15) 1.78 (1.54-2.05) 1.39 (1.19-1.63)
No. of Comorbidities*
None ref ref ref ref
One 1.42 (1.18-1.72) 1.38 (1.14-1.68) 1.26 (1.07-1.49) 1.23 (1.04-1.45)
Two 1.90 (1.34-2.69) 1.84 (1.27-2.66) 1.53 (1.16-2.02) 1.44 (1.09-1.92)
Weight perception
Under-perception ref ref
Accurate-perception 2.49 (2.10-2.96) 2.49 (2.06-3.00)
*Self-reported as having received a diagnosis of hypertension or diabetes by a physician; †Adjusted for age, household income, education level, marital status, smoking, BMI, and chronic disease comorbidities; ‡Additionally adjusted for body weight perception.
tion. Moreover, similar to the unadjusted model, the ORs for weight perception in men (OR, 2.49; 95% CI, 2.10-2.96) and
women (OR, 2.49; 95% CI, 2.06-3.00) were higher than those of BMI (men: OR, 1.82; 95% CI, 1.54-2.15; women: OR, 1.39; 95%
CI, 1.19-1.63). In contrast to the univariate analysis, the number of comorbidities was associated significantly and positively with weight control behavior in both men and women in the multi- variate analysis.
The results from the interaction model are shown in Fig. 1.
Regardless of weight perception, the adjusted ORs for weight control behavior increased significantly with an increasing number of comorbidities in men (P < 0.05 for trend). This sig- nificant association was also present in women who perceived their weight accurately. However, the number of comorbidities had no significant effect on weight control behavior in women who under-perceived their weight status. A significant interac- tion between the number of comorbidities and weight percep- tion was found only in women (P = 0.031for interaction).
DISCUSSION
Our results show that the association between weight control behavior and subjective weight status was stronger than that between weight control behavior and BMI. This finding is con- sistent with results from the National Health and Nutrition Ex- amination Survey (NHANES), a nationally representative Unit- ed States survey (14).
Overweight/obese people with hypertension or diabetes have a greater chance of complications, such as cardiovascular dis- ease or stroke, than those without these diseases. Therefore, overweight/obese people with comorbidities should control their weight more strictly. As mentioned previously, many stud- ies have reported the association between a comorbidity and weight control behavior, but they showed conflicting outcomes (13, 14, 24-26). This discrepancy can be explained partially by the temporal relationship between weight control behavior and
comorbidities. In other words, some kinds of chronic diseases develop in obese or overweight people, as they are not interest- ed in weight management or they try to manage their weight to control their chronic condition. An exact causal relationship cannot be determined by cross-sectional studies, and conflict- ing outcomes may occur. In addition, grasping the key motivat- ing factor for weight management is essential to determine the association between weight control behavior and comorbidities.
Because we used a cross-sectional, and not a longitudinal de- sign, the exact causal relationship could not be determined in our study. Even with this limitation, this study is probably more accurate than others, as the key motivating factor of weight per- ception was the main focus. Previous studies only considered BMI as a main effect, or they did not consider the interaction ef- fect between weight perception and comorbidities. Weight con- trol behavior improved significantly as the number of comor- bidities increased in both men and women when we analyzed the data as in previous studies.
However, a sex difference was detected in the effect of accu- rate weight perception and chronic disease comorbidities on weight control behavior when the interaction model was used.
In other words, the adjusted ORs for weight control behavior tended to increase significantly with an increasing number of comorbidities in men regardless of weight perception (P trend
< 0.05). Although men tended to under-perceive their weight, those with both hypertension and diabetes showed a similar adjusted OR value of 2.36 for weight control behavior to that of those with accurate weight perception but no comorbidities (adjusted OR, 2.48). However, weight control behavior in wom- en who under-perceived their weight did not improve signifi- cantly with an increasing number of comorbidities. The out- come of the interaction effect model also supported a sex dif- Fig. 1. Adjusted odds ratios (95% confidence intervals) for weight control behavior by weight perception and number of comorbidities. *Self-reported as having received a diag- nosis of hypertension or diabetes by a physician; †Adjusted for age, household income, education level, marital status, smoking, body mass index (BMI), and chronic disease comorbidities.
Men
P for interaction=0.314 (2.40-6.09)3.82
2.48 (2.04-3.02) 2.36
(1.38-4.03)
1.27 (0.95-1.70)
Ref
3.61 (2.79-1.68)
Under perception
Accurate perception No. of comorbidity*
P trend<0.001
P trend=0.043Non One
†tioOdds ra Two 4 3 2 1 0
Women
P for interaction=0.031 3.31
(2.29-4.79)
2.11 (1.67-2.67) 1.17
(0.06-2.07) 0.85 (0.61-1.16) Ref
3.04 (2.35-3.95)
Under perception
Accurate perception No. of comorbidity*
P trend=0.186
P trend=0.008Non One
† tioOdds ra Two 4 3 2 1 0
ference in weight control behavior.
These results show that men and women have different mo- tivation sources for weight control. Health and physical appear- ance are well-known reasons (in this order) for weight control in both sexes. However, a population-based survey in Canada evaluating weight management motivators reported that men control their weight for better health (75%) and appearance (40%). In contrast, the contributing effects of these first (68%) and second reasons (62%) were similar in women (29), which was the same result reported by a study in New Zealand (30).
Thus, men with a comorbidity tried to lose weight to improve general health, regardless of weight status, whereas this was not true for women who under-perceived their weight. This differ- ence in perception by sex could be a reason for the conflicting results in previous studies.
Korean women have a 1.1-fold higher mortality rate than that of men, and a higher proportion of women die from circulatory diseases (31). Therefore, it is important for women to manage traditional risk factors, including smoking, hypercholesterol- emia, obesity, diabetes, and hypertension, more strictly to pre- vent cardiovascular diseases. However, women being treated for hypertension, diabetes, or hypercholesterolemia show con- sistently lower control rates than men, based on the KNHANES results (6). According to studies using NHANES data, women are less likely to be treated or to control hypercholesterolemia and, among those being treated for hypertension, less likely to achieve the recommended blood pressure goals compared with men (32, 33). These sex disparities associated with controlling cardiovascular disease risk factors are also observed in patients with diabetes (34). Therefore, additional efforts may be needed to achieve therapeutic goals for women with comorbidities.
Obesity is a main risk factor for cardiovascular disease in women who poorly manage their comorbid condition, and health outcomes can worsen as weight control fails. Women had twice as high population-attributable risks (PARs) for obe- sity than those of men in a study on trends in cardiovascular disease PARs using the Atherosclerosis Risk in Communities (ARIC) data, although the differences between the sexes de- creased gradually from the late 1980s to the late 1990s (35). Im- proving awareness of self-body image is a top priority to prevent newly developing and progressing cardiovascular disease, as more than one-fourth of overweight/obese women did not per- ceive their weight correctly. This is because accurate weight perception is of paramount importance for weight control be- havior. In addition, this could have synergistic effects on hyper- tension, diabetes, and hyperlipidemia management.
This study had some limitations that should be discussed.
First, the cross-sectional study design of the KNHANES could not determine the causal relationship between weight percep- tion and weight control behavior. Second, weight control behav- ior and disease status were self-reported; thus, there could have
been recall bias or misclassification bias. Third, the degree of weight perception accuracy is influenced by sex in social and cultural contexts. In other words, women are more likely to over- perceive their weight compared with men. In this study, the proportion of men who under-perceived their weight (40.0%) was much higher than that of women (25.2%). Therefore, we stratified by sex to overcome this difference. Fourth, body satis- faction differs with race, as sociocultural factors play an impor- tant role in the development of body image (36). Thus, our re- sults should be interpreted cautiously. Fifth, basically, KNHANES was implemented without applying overweight criteria. This study included overweight participants (23.0 ≤ BMI < 25.0) for the following reasons. WHO recommended a BMI cut-off point of 23.0 for Asian populations when determining overweight and obesity, and the WHO Expert Consultation also identified it as one of the potential public health action points (27, 37). In accordance with these public perspectives, it is necessary for overweight people, especially those with hypertension or dia- betes, to control their weight more than people with ideal weight in order to prevent any complications. A pooled analysis of the Asian Cohort Consortium, including more than 20 perspective cohorts representing Korea as well, observed that the mortality rate of overall cardiovascular disease, coronary heart disease, and stroke was higher for BMI range 22.5-24.9 than 20.0-22.4 (38). In addition, the 2014 Clinical Practice Guidelines for over- weight and obesity by Korean Endocrine Society and Korean Society for the Study of Obesity also reported that comprehen- sive lifestyle interventions are recommended for overweight populations with comorbidities (39).
Despite these limitations, the major strength of this study is investigating the effects of chronic disease comorbidities on weight control behavior. Previous studies have also examined this relationship, but used BMI instead of weight perception as a weight control motivator. In addition, we assessed the interac- tion between chronic disease and accurate weight perception and found sex disparities in the triggers used by overweight and obese people to practice weight control. The KNHANES data used in this study were collected from a nationally representa- tive survey to assess the health and nutrition status of the Kore- an population, and anthropometry was measured directly us- ing a standardized protocol. Therefore, our results are reliable and can be applied to the general Korean population.
In conclusion, perceived weight plays a more important role than does objective obesity in weight control behavior. Accu- rate weight perception differs between the sexes and affects weight control behavior. Therefore, improving body image awareness may help improve the health of overweight/obese people. Women with chronic diseases who need to manage their weight can increase their motivation to practice weight control by improving body image accuracy.
DISCLOSURE
All of the authors have no potential conflicts of interest or fi- nancial ties to disclose.
AUTHOR CONTRIBUTION
Conception and coordination of the study: Hwang JH, Park SW.
Design of ethical issues: Hwang JH, Ryu DH, Park SW. Data re- view: Hwang JH. Statistical analysis: Hwang JH. Manuscript preparation: Hwang JH, Ryu DH. Critical review of the manu- script: Park SW. Manuscript approval: all authors.
ORCID
Jun Hyun Hwang http://orcid.org/0000-0001-8547-0893 Dong Hee Ryu http://orcid.org/0000-0002-2860-8849 Soon-Woo Park http:// orcid.org/0000-0001-9795-7914
REFERENCES
1. Haslam DW, James WP. Obesity. Lancet 2005; 366: 1197-209.
2. Poirier P, Giles TD, Bray GA, Hong Y, Stern JS, Pi-Sunyer FX, Eckel RH.
Obesity and cardiovascular disease: pathophysiology, evaluation, and effect of weight loss. Arterioscler Thromb Vasc Biol 2006; 26: 968-76.
3. World Health Organization. Global health risks mortality and burden of disease attributable to selected major risks. Geneva, Switzerland: World Health Organization, 2009.
4. Withrow D, Alter DA. The economic burden of obesity worldwide: a sys- tematic review of the direct costs of obesity. Obes Rev 2011; 12: 131-41.
5. Kim DM, Ahn CW, Nam SY. Prevalence of obesity in Korea. Obes Rev 2005; 6: 117-21.
6. Korea Centers for Disease Control and Prevention. Korea Health Statis- tics 2011: Korea National Health and Nutrition Examination Survey (KNHANES V-2). Seoul: Korean Ministry of Health and Welfare, 2012.
7. Korea Centers for Disease Control and Prevention. Epidemiology and management of cardiocerebrovascular disease. Osong, Korea: Korea Centers for Disease Control and Prevention, 2013.
8. Hong JS, Kang HC, Lee SH, Kim J. Long-term trend in the incidence of acute myocardial infarction in Korea: 1997-2007. Korean Circ J 2009; 39:
467-76.
9. Shin MH, Oh HK, Ahn YO. Ten year trend of cancer incidence in Seoul, Korea: 1993--2002. J Prev Med Public Health 2008; 41: 92-9.
10. Goldstein DJ. Beneficial health effects of modest weight loss. Int J Obes Relat Metab Disord 1992; 16: 397-415.
11. Sobal J, Stunkard AJ. Socioeconomic status and obesity: a review of the literature. Psychol Bull 1989; 105: 260-75.
12. Yoo S, Cho HJ, Khang YH. General and abdominal obesity in South Ko- rea, 1998-2007: gender and socioeconomic differences. Prev Med 2010; 51:
460-5.
13. Joh HK, Oh J, Lee HJ, Kawachi I. Gender and socioeconomic status in re- lation to weight perception and weight control behavior in Korean adults.
Obes Facts 2013; 6: 17-27.
14. Yaemsiri S, Slining MM, Agarwal SK. Perceived weight status, overweight diagnosis, and weight control among US adults: the NHANES 2003-2008 Study. Int J Obes (Lond) 2011; 35: 1063-70.
15. Anderson LA, Eyler AA, Galuska DA, Brown DR, Brownson RC. Rela- tionship of satisfaction with body size and trying to lose weight in a na- tional survey of overweight and obese women aged 40 and older, United States. Prev Med 2002; 35: 390-6.
16. Lemon SC, Rosal MC, Zapka J, Borg A, Andersen V. Contributions of weight perceptions to weight loss attempts: differences by body mass in- dex and gender. Body Image 2009; 6: 90-6.
17. Gregory CO, Blanck HM, Gillespie C, Maynard LM, Serdula MK. Per- ceived health risk of excess body weight among overweight and obese men and women: differences by sex. Prev Med 2008; 47: 46-52.
18. Duncan DT, Wolin KY, Scharoun-Lee M, Ding EL, Warner ET, Bennett GG. Does perception equal reality? Weight misperception in relation to weight-related attitudes and behaviors among overweight and obese US adults. Int J Behav Nutr Phys Act 2011; 8: 20.
19. Kim DS, Kim HS, Cho Y, Cho SI. The effects of actual and perceived body weight on unhealthy weight control behaviors and depressed mood among adult women in Seoul, Korea. J Prev Med Public Health 2008; 41:
323-30.
20. Jones M, Grilo CM, Masheb RM, White MA. Psychological and behav- ioral correlates of excess weight: misperception of obese status among persons with Class II obesity. Int J Eat Disord 2010; 43: 628-32.
21. Edwards NM, Pettingell S, Borowsky IW. Where perception meets reality:
self-perception of weight in overweight adolescents. Pediatrics 2010; 125:
e452-8.
22. Skinner AC, Weinberger M, Mulvaney S, Schlundt D, Rothman RL. Ac- curacy of perceptions of overweight and relation to self-care behaviors among adolescents with type 2 diabetes and their parents. Diabetes Care 2008; 31: 227-9.
23. Forman MR, Trowbridge FL, Gentry EM, Marks JS, Hogelin GC. Over- weight adults in the United States: the behavioral risk factor surveys. Am J Clin Nutr 1986; 44: 410-6.
24. Zhao G, Ford ES, Li C, Mokdad AH. Compliance with physical activity recommendations in US adults with diabetes. Diabet Med 2008; 25:
221-7.
25. Grace SL, Barry-Bianchi S, Stewart DE, Rukholm E, Nolan RP. Physical activity behavior, motivational readiness and self-efficacy among On- tarians with cardiovascular disease and diabetes. J Behav Med 2007; 30:
21-9.
26. Zhao G, Ford ES, Li C, Mokdad AH. Weight control behaviors in over- weight/obese U.S. adults with diagnosed hypertension and diabetes.
Cardiovasc Diabetol 2009; 8: 13.
27. World Health Organization Western Pacific Region, International As- sociation for the Study of Obesity, International Obesity Task Force.The Asia-Pacific perspective: redefining obesity and its treatment. Sydney, Australia: Health Communications Australia Pty, 2000.
28. Yost J, Krainovich-Miller B, Budin W, Norman R. Assessing weight per- ception accuracy to promote weight loss among U.S. female adolescents:
a secondary analysis. BMC Public Health 2010; 10: 465.
29. Green KL, Cameron R, Polivy J, Cooper K, Liu L, Leiter L, Heatherton T.
Weight dissatisfaction and weight loss attempts among Canadian adults.
Canadian Heart Health Surveys Research Group. CMAJ 1997; 157:
S17-25.
30. O’Brien K, Venn BJ, Perry T, Green TJ, Aitken W, Bradshaw A, Thomson R. Reasons for wanting to lose weight: different strokes for different folks.
Eat Behav 2007; 8: 132-5.
31. Statistics Korea. Annual report on the causes of death statistics by prov- inces. Daejeon, Korea: Statistics Korea, 2014.
32. Egan BM, Zhao Y, Axon RN. US trends in prevalence, awareness, treat- ment, and control of hypertension, 1988-2008. JAMA 2010; 303: 2043-50.
33. Ford ES, Li C, Pearson WS, Zhao G, Mokdad AH. Trends in hypercholes- terolemia, treatment and control among United States adults. Int J Car- diol 2010; 140: 226-35.
34. Ferrara A, Mangione CM, Kim C, Marrero DG, Curb D, Stevens M, Sel- by JV, Translating Research Into Action for Diabetes Study Group. Sex disparities in control and treatment of modifiable cardiovascular dis- ease risk factors among patients with diabetes: Translating Research Into Action for Diabetes (TRIAD) Study. Diabetes Care 2008; 31: 69-74.
35. Cheng S, Claggett B, Correia AW, Shah AM, Gupta DK, Skali H, Ni H,
Rosamond WD, Heiss G, Folsom AR, et al. Temporal trends in the popu- lation attributable risk for cardiovascular disease: the Atherosclerosis Risk in Communities Study. Circulation 2014; 130: 820-8.
36. Cachelin FM, Rebeck RM, Chung GH, Pelayo E. Does ethnicity influence body-size preference? A comparison of body image and body size. Obes Res 2002; 10: 158-66.
37. Appropriate body-mass index for Asian populations and its implica- tions for policy and intervention strategies. Lancet 2004; 363: 157-63.
38. Chen Y, Copeland WK, Vedanthan R, Grant E, Lee JE, Gu D, Gupta PC, Ramadas K, Inoue M, Tsugane S, et al. Association between body mass index and cardiovascular disease mortality in east Asians and south Asians: pooled analysis of prospective data from the Asia Cohort Consor- tium. BMJ 2013; 347: f5446.
39. Kim MK, Lee WY, Kang JH, Kang JH, Kim BT, Kim SM, Kim EM, Suh SH, Shin HJ, Lee KR, et al. 2014 clinical practice guidelines for overweight and obesity in Korea. Endocrinol Metab (Seoul) 2014; 29: 405-9.