Nomogram for Prediction of Prostate Cancer with Serum Prostate Specific Antigen Less than 10 ng/mL
Although prostate-specific antigen (PSA) is a very useful screening tool, prostate biopsy is still necessary to confirm prostate cancer (PCA). However, it is reported that PSA is associated with a high false-positive rate and prostate biopsy also has various procedure- related complications. Therefore, the authors have devised a nomogram, which can be used to estimate the risk of PCA, using available clinical data for men with a serum PSA less than 10 ng/mL. Prostate biopsies were obtained from 2,139 patients from January 1998 to March 2011. Of them, 1,171 patients with a serum PSA less than 10 ng/mL were only included in this study. Patient age, PSA, free PSA, prostate volume, PSA density and percent free PSA ratio were analyzed. Among 1,171 patients, 255 patients (21.8%) were diagnosed as PCA. Multivariate analyses showed that patient age, prostate volume, PSA and percent free PSA had statistically significant relationships with PCA (P < 0.05) and were used as nomogram predictor variables. The area under the (ROC) curve for all factors in a model predicting PCA was 0.759 (95% CI, 0.716-0.803).
Keywords: Biopsy; Nomograms; Prostate; Prostatic Neoplasms Jae Hyun Ahn, Jeong Zoo Lee,
Moon Kee Chung, and Hong Koo Ha Department of Urology and Biomedical Research Institute, Pusan National University Hospital, Busan, Korea
Received: 7 January 2013 Accepted: 8 January 2014 Address for Correspondence:
Hong Koo Ha, MD
Department of Urology and Biomedical Research Institute, Pusan National University Hospital, 179 Gudeok-ro, Seo-gu, Busan 602-739, Korea
Tel: +82.51-240-7351, Fax: +82.51-247-5443 E-mail: [email protected]
http://dx.doi.org/10.3346/jkms.2014.29.3.338 • J Korean Med Sci 2014; 29: 338-342
INTRODUCTION
Prostate cancer (PCA) is the fifth most common malignancy worldwide and the second most common in men (1, 2). PCA is the fifth common cancer and its prevalence is also the most rapidly increasing in Korea (3). Prostate-specific antigen (PSA) is a useful screening test for PCA. However, the confirmed diag- nosis of PCA is made by a pathological examination. Prostate biopsy is usually performed when a patient has a high PSA or there are abnormal findings in either digital rectal examination or prostate imaging studies. Prostate biopsy is generally recom- mended for patients with a serum PSA value more than 4 ng/mL.
However, it was reported that patients with PSA at the range of 2.0 to 4.0 ng/mL were also diagnosed with PCA. Additionally, the detection rate was ranged between 15% and 25% in these patients (4-7). For this reason, the PSA cut-off value remains controversial. It is reported that a lower specificity of PSA test is accounted for PCA detection rates on initial prostate biopsy ranged between 22.8% and 42.0% (8).
Various procedure-related complications including pain on biopsy sites, hematuria, hematochezia, acute urinary retention, urinary tract infection (UTI) etc. have been reported and major complications sometimes present as much more serious prob- lems to both patients and urologists. Febrile UTIs or urosepsis frequently require hospital admission for supportive care and antibiotic treatment (8, 9).
Therefore, in this paper, a nomogram to predict the probabil-
ity of PCA has been developed using available clinical data for men with serum PSA values less than 10 ng/mL.
MATERIALS AND METHODS
Prostate biopsies were obtained from 2,139 patients in our hos- pital from January 1998 to March 2011. Of them, 1,171 patients with a serum PSA less than 10 ng/mL were selected for this study.
Patient age at the prostate biopsy, PSA, free PSA, prostate vol- ume, PSA density (PSAD) and percent free PSA were retrospec- tively analyzed.
PSA and free PSA levels were measured by enzyme-linked immunoassay (EIA, R&D systems, US). Prostate volume (V) was estimated by measuring the height (H), width (W) and length (L) of the prostate on trans-rectal ultrasonography (TRUS) and by calculating on ellipsoid formula: V = 0.52 × H × W × L (10).
PSAD was obtained by dividing PSA by prostate volume estimat- ed by TRUS, and percent free PSA was obtained by dividing free PSA by total PSA.
Prostate biopsy was performed when PSA was more than 4 ng/mL or when abnormal digital rectal examination (DRE) or mass lesions on imaging studies of prostate were detected. In recent years, ultrasound-guided trans-rectal 6-12 core prostate biopsy is often performed according to prostate volumes where- as hypoechoic lesion directed biopsy in addition to sextant bi- opsy was commonly performed in the past. Eight-core biopsy was performed for patients with prostate volume less than 30 g;
Oncology & Hematology
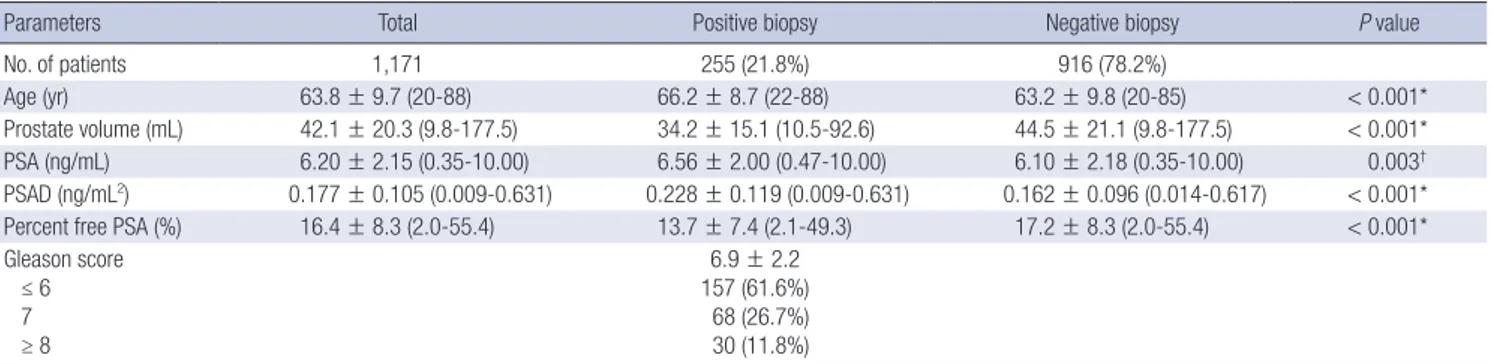
Table 1. Patients’ characteristics and comparison between positive and negative results on prostate biopsy
Parameters Total Positive biopsy Negative biopsy P value
No. of patients 1,171 255 (21.8%) 916 (78.2%)
Age (yr) 63.8 ± 9.7 (20-88) 66.2 ± 8.7 (22-88) 63.2 ± 9.8 (20-85) < 0.001*
Prostate volume (mL) 42.1 ± 20.3 (9.8-177.5) 34.2 ± 15.1 (10.5-92.6) 44.5 ± 21.1 (9.8-177.5) < 0.001*
PSA (ng/mL) 6.20 ± 2.15 (0.35-10.00) 6.56 ± 2.00 (0.47-10.00) 6.10 ± 2.18 (0.35-10.00) 0.003† PSAD (ng/mL2) 0.177 ± 0.105 (0.009-0.631) 0.228 ± 0.119 (0.009-0.631) 0.162 ± 0.096 (0.014-0.617) < 0.001*
Percent free PSA (%) 16.4 ± 8.3 (2.0-55.4) 13.7 ± 7.4 (2.1-49.3) 17.2 ± 8.3 (2.0-55.4) < 0.001*
Gleason score ≤ 6 7 ≥ 8
6.9 ± 2.2 157 (61.6%) 68 (26.7%) 30 (11.8%)
*P < 0.001, †P < 0.005. PSA, prostate specific antigen; PSAD, prostate specific antigen density.
Table 2. Univarivate and multivariate analysis of factors associated with prostate cancer
Parameters Univariate analysis Multivariate analysis
P value P value OR (95% CI)
Age < 0.001* < 0.001* 1.081 (1.056-1.107) Prostate volume < 0.001* < 0.001* 0.964 (0.951-0.978)
PSA 0.003† 0.007† 1.133 (1.035-1.242)
Percent free PSA < 0.001* < 0.001* 0.940 (0.912-0.968)
*P < 0.001, †P < 0.005. Adjusted for prostate volume and Gleason score. PSA, pros- tate specific antigen; OR, odds ratio; CI, confidence interval.
ten-core biopsy was performed for patients with prostate vol- ume between 30-50 g; and 12-core biopsy was performed for patients with prostate volume greater than 50 g.
Relationships between the associated factors and PCA were examined by univariate and multivariate regression analyses using a Statistical Package for Social Sciences (SPSS version 18.0, Chicago, IL, USA). A nomogram was developed with significant factors using the statistical software package R, version 2.12.2 (R Development Core Team, available from: http://www.r-project.
org) and its regression modeling strategies. Statistical significance was determined at the level of α = 0.05.
Ethics statement
This study was reviewed and approved by the institutional re- view board of Pusan National University Hospital (IRB approved protocol: No. E-2012125). Since this study was performed as a retrospective study using the database and medical records, in- formed consent was waived by the board.
RESULTS
Of 2,139 patients who underwent prostate biopsy, 1,171 patients had a serum PSA level less than 10 ng/mL. The mean age was 63.8 ± 9.7 (20-88) yr; the mean prostate volume was 42.1 ± 20.3 (9.8-177.5) mL; the mean PSA was 6.20 ± 2.15 (0.35-10.00) ng/
mL; the mean PSAD was 0.177 ± 0.105 (0.009-0.631) ng/mL2; and the mean percent free PSA was 13.7 ± 7.4 (2.0-55.4)%. The mean number of biopsy cores was 9.1 ± 2.2.
Among 1,171 patients, 255 patients (21.8%) had a positive bi- opsy result and were diagnosed with PCA accordingly. The mean ages of the positive biopsy group and the negative biopsy group were 66.2 ± 8.7 (22-88) yr and 63.2 ± 9.8 (20-85) (P < 0.001); the mean prostate volumes of each group were 34.2 ± 15.1 (10.5- 92.6) mL and 44.5 ± 21.1 (9.8-177.5) mL (P < 0.001); the mean PSAs of each group were 6.56 ± 2.00 (0.47-10.00) ng/mL and 6.10 ± 2.18 (0.347-10.0) ng/mL (P = 0.003); the mean PSADs of each group were 0.228 ± 0.119 (0.009-0.631) ng/mL2 and 0.162
± 0.096 ng/mL2 (0.014-0.617) (P < 0.001); and the mean percent
free PSAs of each group were 13.7 ± 7.4 (2.1-49.3)% and 17.2 ± 8.3 (2.0-55.4)% (P < 0.001), respectively. The mean Gleason score of the PCA group was 6.5 ± 0.9 and the number of patients with a Gleason score less than 6, 7 and more than 8 were 157 (61.6%), 68 (26.7%) and 30 (11.8%) (Table 1).
Univariate analyses showed that patient age (P < 0.001), pros- tate volume (P < 0.001), PSA (P = 0.003), PSAD (P < 0.001) and percent free PSA (P < 0.001) had statistically significant relation- ships with a positive prostate biopsy result. Multivariate analy- ses showed that patient age (P < 0.001), prostate volume (P = 0.007), PSA (P < 0.001) and percent free PSA (P < 0.001) had statistically significant relationships with positive biopsy result (Table 2).
Patient age, prostate volume, PSA and percent free PSA were determined as nomogram predictor variables. Nomogram was developed with these significant factors using the statistical soft- ware package R and its regression modeling strategies (Fig. 1).
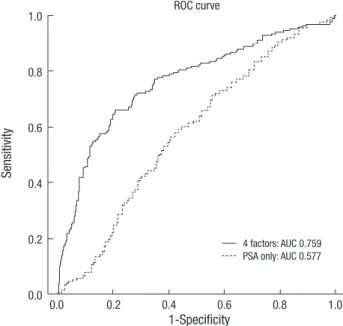
The area under the receiver operating characteristic curve (ROC) for 4 factors in a model predicting PCA was 0.759 (95%
confidence interval, 0.716-0.803). The area under ROC for only PSA for predicting PCA was just 0.577 (95% confidence interval, 0.532-0.623) (Fig. 2).
DISCUSSION
Millions of men undergo prostate biopsy to detect PCA each year in the world (14). Although prostate biopsy is performed
Fig. 1. Nomogram for prediction of prostate cancer with serum prostate-specific antigen less than 10 ng/mL at prostate biopsy. PSA, prostate specific antigen.
Poins
Age
Volume
PSA
Percent free PSA
Total points
Predicted value
0 10 20 30 40 50 60 70 80 90 100
20 25 30 35 40 45 50 55 60 65 70 75 80 85 90
180 160 140 120 100 80 60 40 20 0
0 2 4 6 8 10
60 55 50 45 40 35 30 25 20 15 10 5 0
0.1 0.2 0.3 0.4 0.5 0.6 0.7 0.8
0 20 40 60 80 100 120 140 160 180 200 220 240
Fig. 2. Receiver operating characteristic curves for nomogram in predicting with 4 fac- tors (Patient’s age, PSA, prostate volume, percent free PSA) and only PSA. ROC, re- ceiver operating characteristic; PSA, prostate specific antigen; AUC, area under curve.
Sensitivity
1-Specificity
0.0 0.2 0.4 0.6 0.8 1.0 1.0
0.8
0.6
0.4
0.2
0.0
ROC curve
4 factors: AUC 0.759 PSA only: AUC 0.577
with caution, various procedure-related complications after prostate biopsy may occur. An increase in the incidence of in- fection after trans-rectal prostrate biopsy has been reported in some recent studies (14-16). Moreover, some authors reported that the cut-off value of PSA for prostate biopsy has been low- ered from 4.0 ng/mL to 2.5 ng/mL (4-7). Having lowered the cut-off value of PSA for prostate biopsy, it is expected that more prostate biopsy will be performed resulting in a higher incidence of procedure-related complications and additional financial burden. In the view of this, the decision on the performance of
prostate biopsy must be carefully made considering the proba- bility of PCA and the risk of procedure-related complications, especially in patients with serum PSA less than 10 ng/mL. No- mograms to predict the probability of PCA have been developed in some parts of the world, however, there is only one study of Japanese men with serum PSA less than 10 ng/mL (17).
Carlson et al. (18) created an algorithm to predict PCA, but their model did not report a definite AUC. More importantly, the subjects of their study only included the population with a PSA value between 4 ng/mL and 10 ng/mL excluding the popu- lation with lower PSA levels which is the common clinical pre- sentation today. Eastham et al. (19) devised a model after study- ing group of 700 patients whose PSA values were less than 4 ng/
mL. Other studies had investigated the prostate cancer with high er than 10 ng/mL (20-22). Among Patients with a PSA value great er than 10 ng/mL, 36%-76% of them were diagnosed with PCA by prostate biopsy. It was thought that most of patients with a PSA value greater than 20 ng/mL were highly probable to have prostate cancer, therefore, these nomograms which in- cluded pati ents with high PSA had less worth.
In our study, patient age (P < 0.001), prostate volume (P = 0.007), PSA (P < 0.001) and percent free PSA (P < 0.001) had statistically significant relationships with positive biopsy result at multivariate analysis and used as nomogram predictor vari- ables. In some studies, multiple values were used as a predictor of PCA, such as age, PSA, percent free PSA, family history of PCA, abnormal DRE findings and races (18-22). In some ways, DRE is a different result between individuals, so we excluded the DRE results as a predictor of PCA.
Nam et al. (16) used 6 factors including age, PSA, percent free PSA, family history of PCA, abnormal DRE findings and races
to develop a predicting model for PCA and the predictive value was reached up to 74%. Karakiewicz et al. (20) developed a no- mogram to evaluate the risks of PCA including age, PSA level, percent free PSA, and DRE and showed the total AUC of the mo- del was 0.69. Optenberg et al. (21) developed a model to predict the risk of PCA on prostate biopsy using 633 patients and the total AUC of the model was 0.808. Eastham et al. (19) devised a model with a group of 700 patients whose PSA values were less than 4 ng/mL and whose DRE findings were abnormal and the AUC of the model was 0.75. Zaytoun et al. (22) conducted a study about the risk of PCA with 1,551 men who underwent prostate biopsy, using patient age, race, PSA, percent free PSA, family history of PCA, and DRE findings as prognosis factors. Univari- ate and multivariate logistic regression models of analysis sug- gested that all 6 risk factors were statically significant. Using the nomogram, the total AUC for all factors in predicting PCA was 0.73 (95% CI, 0.71-0.76), and the AUC for PSA alone was 0.55 (95% CI, 0.69-0.74). In this study, the AUC for 4 factors in the model was 0.759 (95% CI, 0.716-0.803) and the AUC for only PSA was just 0.577 (95% CI, 0.532-0.623; Fig. 2). In study with highest AUC, they included patients with a PSA value less than 20 ng/mL, therefore, higher PCA detection rates may be expected.
There are three limitations that need to be acknowledged and addressed regarding the model developed in this study. The first limitation is that this study has failed to consider the poten- tial false-negative rate of prostate biopsy. The second limitation is that this study has conducted as a retrospective analysis with- out consideration of DRE which was performed several differ- ent urologists. The third limitation is that the data used in this study has been obtained from a single institution. Therefore, prostate biopsy protocol at other institutions may produce dif- ferent results.
It is expected that the nomogram developed in this study will be useful to predict the risk of PCA on prostate biopsy. The ROC curve evaluated the accuracy of the predicted probability was 75.9% for the model whereas it was 57.7% when a PSA value was considered alone. The prediction rate of PCA with this no- mogram was higher than that of other existing nomograms but further external validation of the nomogram will be required.
DISCLOSURE
The authors have no conflicts of interest to disclose.
ORCID
Hong Koo Ha http://orcid.org/0000-0002-8240-7765
REFERENCES
1. American Cancer Society. Cancer facts and figures 2008. Available at
http://www.cancer.org/acs/groups/content/@nho/documents/docume nt/2008cafffinalsecuredpdf.pdf [accessed on 15 February 2013].
2. Boyle P, Ferlay J. Cancer incidence and mortality in Europe, 2004. Ann Oncol 2005; 16: 481-8.
3. National Cancer Center. Cancer facts and figures 2011. Available at http:
//www.cancer.go.kr/ncic/cics_g/cics_g02/cics_g027/1647906_6065.html [accessed on 15 February 2013].
4. Andriole GL, Crawford ED, Grubb RL 3rd, Buys SS, Chia D, Church TR, Fouad MN, Gelmann EP, Kvale PA, Reding DJ, et al. Mortality results from a randomized prostate-cancer screening trial. N Engl J Med 2009;
360: 1310-9.
5. Catalona WJ, Smith DS, Ratliff TL, Dodds KM, Coplen DE, Yuan JJ, Pet- ros JA, Andriole GL. Measurement of prostate-specific antigen in serum as a screening test for prostate cancer. N Engl J Med 1991; 324: 1156-61.
6. Schröder FH, Hugosson J, Roobol MJ, Tammela TL, Ciatto S, Nelen V, Kwiatkowski M, Lujan M, Lilja H, Zappa M, et al. Screening and pros- tate-cancer mortality in a randomized European study. N Engl J Med 2009; 360: 1320-8.
7. Thompson IM, Pauler DK, Goodman PJ, Tangen CM, Lucia MS, Parnes HL, Minasian LM, Ford LG, Lippman SM, Crawford ED, et al. Prevalence of prostate cancer among men with a prostate-specific antigen level < or
=4.0 ng per milliliter. N Engl J Med 2004; 350: 2239-46.
8. Chun FK, Epstein JI, Ficarra V, Freedland SJ, Montironi R, Montorsi F, Shariat SF, Schröder FH, Scattoni V. Optimizing performance and inter- pretation of prostate biopsy: a critical analysis of the literature. Eur Urol 2010; 58: 851-64.
9. Wagenlehner FM, van Oostrum E, Tenke P, Tandogdu Z, Çek M, Grabe M, Wullt B, Pickard R, Naber KG, Pilatz A, et al. Infective complications after prostate biopsy: outcome of the Global Prevalence Study of Infec- tions in Urology (GPIU) 2010 and 2011, a prospective multinational multicentre prostate biopsy study. Eur Urol 2013; 63: 521-7.
10. Gancarczyk KJ, Wu H, McLeod DG, Kane C, Kusuda L, Lance R, Her- ring J, Foley J, Baldwin D, Bishoff JT, et al. Using the percentage of biopsy cores positive for cancer, pretreatment PSA, and highest biopsy Gleason sum to predict pathologic stage after radical prostatectomy: the Center for Prostate Disease Research nomograms. Urology 2003; 61: 589-95.
11. Ilic D, O’Connor D, Green S, Wilt T. Screening for prostate cancer: a Co- chrane systematic review. Cancer Causes Control 2007; 18: 279-85.
12. Wang MC, Valenzuela LA, Murphy GP, Chu TM. Purification of a hu- man prostate specific antigen. Invest Urol 1979; 17: 159-63.
13. Ferro MA, Barnes I, Roberts JB, Smith PJ. Tumour markers in prostatic carcinoma: a comparison of prostate-specific antigen with acid phos- phatase. Br J Urol 1987; 60: 69-73.
14. Loeb S, Carter HB, Berndt SI, Ricker W, Schaeffer EM. Complications after prostate biopsy: data from SEER-Medicare. J Urol 2011; 186: 1830-4.
15. Loeb S, van den Heuvel S, Zhu X, Bangma CH, Schröder FH, Roobol MJ. Infectious complications and hospital admissions after prostate bi- opsy in a European randomized trial. Eur Urol 2012; 61: 1110-4.
16. Nam RK, Saskin R, Lee Y, Liu Y, Law C, Klotz LH, Loblaw DA, Trachten- berg J, Stanimirovic A, Simor AE, et al. Increasing hospital admission rates for urological complications after transrectal ultrasound guided prostate biopsy. J Urol 2010; 183: 963-8.
17. Kawamura K, Suzuki H, Kamiya N, Imamoto T, Yano M, Miura J, Shim- bo M, Suzuki N, Nakatsu H, Ichikawa T. Development of a new nomo- gram for predicting the probability of a positive initial prostate biopsy in
Japanese patients with serum PSA levels less than 10 ng/mL. Int J Urol 2008; 15: 598-603.
18. Carlson GD, Calvanese CB, Partin AW. An algorithm combining age, to- tal prostate-specific antigen (PSA), and percent free PSA to predict pros- tate cancer: results on 4298 cases. Urology 1998; 52: 455-61.
19. Eastham JA, May R, Robertson JL, Sartor O, Kattan MW. Development of a nomogram that predicts the probability of a positive prostate biopsy in men with an abnormal digital rectal examination and a prostate-spe- cific antigen between 0 and 4 ng/mL. Urology 1999; 54: 709-13.
20. Karakiewicz PI, Benayoun S, Kattan MW, Perrotte P, Valiquette L, Scar- dino PT, Cagiannos I, Heinzer H, Tanguay S, Aprikian AG, et al. Devel-
opment and validation of a nomogram predicting the outcome of pros- tate biopsy based on patient age, digital rectal examination and serum prostate specific antigen. J Urol 2005; 173: 1930-4.
21. Optenberg SA, Clark JY, Brawer MK, Thompson IM, Stein CR, Friedrichs P. Development of a decision-making tool to predict risk of prostate can- cer: the Cancer of the Prostate Risk Index (CAPRI) test. Urology 1997; 50:
665-72.
22. Zaytoun OM, Kattan MW, Moussa AS, Li J, Yu C, Jones JS. Development of improved nomogram for prediction of outcome of initial prostate bi- opsy using readily available clinical information. Urology 2011; 78: 392-8.