INTRODUCTION
Years of cardiovascular research focusing predominantly on males have, unfortunately, added to the impression that cardiovascular disease (CVD) is basically a male affliction. Yet, CVD is the leading cause of death among elderly women, especially postmenopausal women (1-3). Although women are largely protected from clinical coronary disease before menopause, they rapidly develop an increased risk thereafter.
A lot of evidence has suggested that hormone replacement therapy (HRT) may suppress the accelerated atherosclerotic process (4). The mechanism of estrogen’s protection from coronary disease appears to be partly due to the pharmaco- logical effect of estrogen on lipoprotein levels, but we also have to consider that estrogen may reduce the risk of coro- nary disease by directly suppressing platelet function (4, 5).
Many dietary intervention studies have also been restricted to focusing on changes in lipids and lipoproteins, without examining indices related to the thrombotic risk, e.g. platelet aggregation and thromboxane formation (6). The effects of dietary intervention, with respect to coronary disease, also
need to be considered from two approaches as described by Hoak and Spector, one concerned with atherosclerosis and the other with thrombosis (7). These effects of diet are not surprising because the many nutrients which compose our diet, such as cholesterol, fatty acids, and antioxidant vitamins and minerals, have a relationship with coronary disease, with respect to either blood lipid profiles or thrombotic risks. How- ever, much less is known about the effects of dietary interven- tion on thrombosis compared to the effects on blood lipid profiles.
Dietary factors considered to have a relationship with throm- bosis are several fatty acids and antioxidant vitamins. Many nutritionists, to this day, continue to show interest in the fatty acids composition of lipids in humans, especially in long-chain polyunsaturated fatty acids (PUFAs) derivatives. This is due to the role of PUFAs in maintaining the fluidity and function of cell membranes and the role of PUFAs as precursors of eicosanoids (8). Many studies have shown that long-chain saturated fatty acids (SFAs) accelerate thrombus formation, whereas PUFAs do not, and the PUFA/SFA (P/S) ratio is an important determinant of thrombogenicity (9, 10). More-
Kyungah Jung*, Sangyeon Kim*,�, Jeongik Woo�, Yookyung Chang�
Korean Living Science Research Institute*, Hanyang University, Seoul; KODITION R&D Center�, Seoul;
Department of Family Medicine�, Miz Medi Hospital, Seoul; Department of Food and Nutrition�, Hanyang University, Seoul, Korea
Address for correspondence Kyungah Jung, PhD.
Korean Living Science Research Institute, Hanyang University, 17 Haengdang-dong, Sungdong-gu, Seoul 133-791, Korea Tel : +82.2- 2290-1500, Fax : +82.2-2290-1846 E-mail: [email protected]
*This work was supported by grant No.981-0611- 179-1 from the Basic Research program of the KOSEF.
307
The Effect of Dietary Intervention Through the Modification of Fatty Acids Composition and Antioxidant Vitamin Intake on Plasma TXB 2 Level in Korean Postmenopausal Women with Hypercholesterolemia
The purpose of this study was to observe the effects of dietary intervention, through the modification of dietary fatty acids composition and antioxidant vitamins, on plasma thromboxane B2(TXB2) levels in postmenopausal women with hyper- cholesterolemia. The subjects were treated for 12 weeks with one of three methods:
hormone replacement therapy (HRT group, n=8), dietary intervention (DIET group, n=8), or HRT combined with dietary intervention (HRT+DIET group, n=8). Changes in serum phospholipid fatty acids composition, serum peroxides, and plasma TXB2
levels were measured at weeks 0, 4 and 12. The P/S ratio increased and the n- 6/n-3 ratio decreased in the DIET and the HRT+DIET group at week 4 (p<0.05).
The ratio of C20:5/C20:4 in serum phospholipid increased in the DIET (p<0.05) and the HRT+DIET groups (NS) at week 4. Plasma TXB2levels decreased in the DIET (-35%, p<0.05) and the HRT+DIET groups (-18.8%, NS) at week 4. Serum lipid peroxides levels significantly decreased by 10.5% and 15.2% in the DIET group at weeks 4 and 12, and by 10.8% in the HRT+DIET group only at week 12 (p<0.05). Dietary intervention may lower thrombotic risks in Korean postmenopausal women by changing the serum fatty acid composition, serum lipid peroxides levels and plasma thromboxane B2levels.
Key Words : Postmenopause; Thromboxane B2; Lipid peroxides; Fatty Acids; Antioxidants
Received : 3 December 2001 Accepted : 4 March 2002
over, different PUFAs have different effects: n-6 PUFAs are antiatherogenic, whereas n-3 PUFAs are antithrombogenic.
Such differences have been noted since the study of Green- land Eskimos (11).
When PUFAs metabolism is studied, antioxidants should be measured because lipid peroxides, formed by the peroxi- dation of PUFAs, may be important in the development of atherosclerosis and thrombosis (12). Oxidized low-density lipoprotein (LDL) has been found in human atherosclerotic lesions. It has been demonstrated that oxidized LDL decreases the secretion of endothelium-derived relaxing factors, resulting in enhanced platelet adhesion (13, 14). Prostacyclin synthesis in the arterial endothelium was, in cell cultures, irreversibly inhibited by lipid peroxides, and intracellular lipid peroxides concentration was regulated by antioxidant enzymes such as glutathione peroxidase, superoxide dismutase, and catalase, and also by antioxidant vitamins such as alpha-tocopherol, ascorbic acid, and beta-carotene. Thus, theoretically, a defi- ciency in these antioxidants may lead to reduce prostacyclin synthesis, which can, in turn, promote platelet aggregability.
Moreover, hypercholesterolemic patients show a higher sus- ceptibility to LDL oxidation (15) and hyperaggregability (16, 17).
This small-scale study was done to compare the effects of dietary intervention, through the modification of both dietary fatty acids composition and antioxidant vitamins, and hormone replacement therapy (HRT), alone or in combination, on serum phospholipid fatty acids composition, on plasma TXB2 levels, and also on serum lipid peroxides levels in Korean post- menopausal women with hypercholesterolemia.
MATERIALS AND METHODS Subjects
Thirty-six postmenopausal women, aged 50 to 61 yr, were recruited from a medical center for women in Seoul, Korea. All had hypercholesterolemia, defined as LDL cholesterol levels over 160 mg/dL, determined from the mean of two pre-study fasting samples of serum. All participants had experienced spontaneous physiologic menopause, and had not received any type of anti-platelet drug such as nonsteroidal, any anti- inflammatory agents, or any hormone treatment for at least 6 months before the study. Written, informed consent was obtained from all subjects, and this study has been performed in accordance with the principles embodied in the Helsinki Declaration.
Study design
The subjects were randomly assigned to one of three differ- ent treatments: hormone replacement therapy (HRT group, n=8), dietary intervention (DIET group, n=8) or hormone
replacement therapy combined with dietary intervention (HRT+DIET group, n=8).
The HRT group and the HRT+DIET group both took, on a monthly cyclic schedule, a combined therapy of estro- gen and progesterone, in which conjugated equine estrogen (CEE, Premarin�) 0.625 mg was prescribed for 30 days, and medroxy progesterone acetate (MPA, Provera�) 5 mg was combined for the first 12 days. A prescription of HRT was accomplished with office visits at weeks 0 and 4.
The balanced diet, designed on the basis of our previous studies in Korean postmenopausal women (18, 19), was pro- vided for the DIET group and also the HRT+DIET group.
The diet was modified in cholesterol, antioxidant vitamins, and fatty acid composition. The diet contained cholesterol less than 70 mg/1,000 kcal and antioxidant vitamins over 90%
of the recommended dietary allowance (RDA) for Koreans.
The P/S ratio of dietary fat increased to the upper limit of the recommended range, 1-1.5, and the n-6/n-3 ratio decreased to the lower limit of the recommended range, 4-10 (20). The changes in the P/S and n-6/n-3 ratio of dietary fat were achi- eved by making up menus with foods low in fat and choles- terol and high in antioxidant vitamins.
Energy intake was individually tailored to maintain an ideal body weight, and menus composed of 1,600 kcal, 1,700 kcal and 1,800 kcal were provided for the subjects (Table 1). Each diet consisted of a 10-day rotating menu to provide variety and maintain the acceptability of the diet. Extensive dietary counseling was given at the beginning of dietary intervention, and repeated at each subsequent visit. The subjects were given dietetic scales, measuring cups and spoons, and were also trained in estimating portion sizes with the use of uniform food models.
The study period was a total of 12 weeks. All subjects vis- ited the clinic at weeks 0, 4 and 12 for treatment and blood sampling. At each visit, with the exception of week 0, all subjects completed three-day dietary diaries in order to moni- tor adherence to the treatment. Dietary intake at the baseline (week 0) was measured using a semi-quantitative food-fre- quency questionnaire that has been developed and validated to assess the usual food intake of Korean postmenopausal women (21, 22). Nutrient intake was calculated by using the Hanyang diet analysis program. We tried to encourage com- pliance in the subjects with follow-up telephone counseling once a week during the study period.
Blood analysis
At each visit, a sample of venous blood was drawn after an overnight fast of 12 to 14 hr. Serum estradiol (E2) levels were assayed by a procedure based on the competitive binding principles of radioimmunoassay using the Biodata Estradiol Maia kit (Code 12264). Serum vitamin A and E levels were determined using high performance liquid chromatography (HPLC) as described by Bieri et al. (23). Serum -carotene
levels were determined according to the method used by Kim (24) and vitamin C levels were determined according to the method used by Otsuka et al. (25) using HPLC. Serum lipid peroxides were measured fluorometrically using thiobarbi- turic acid reaction (26). Thromboxane B2(TXB2), the stable hydrolysis product of TXA2, was measured in plasma using an enzymeimmunoassy system kit (Code RPN 220, Amer- sham U.K.).
For analyzing fatty acids composition in serum phospho- lipid, the serum phospholipid was separated using thin-layer chromatography on silica gel G-60 (Merch, 20×20 cm) after extracting serum lipid according to the method used by Folch (27). Methylation of fatty acids was immediately carried out according to the procedure of Morrison and Smith (28). Fatty acid methyl esters were quantified using gas chromatography (Shimadzu GC-17A) utilizing a 30 m wide-bore column (0.52 mm internal diameter, Supelco-wax). Fatty acids in lipid fractions were obtained as percent of distribution.
Statistical analysis
All statistical analyses were performed using the statisti- cal package for social science (SPSS). The data were analyzed with repeated-measures analysis of variance to determine any differences between visits and to determine any differences among the groups at each visit. Where there was a significant difference (p<0.05), the analysis of variance was followed by Duncan’s multiple range test in order to identify differences.
RESULTS
Of the thirty-six subjects who entered the study, 24 com- pleted the study period. Twelve subjects failed to complete the study; four subjects did not complete it for personal rea- sons, two were lost to follow-up, and six had problems fol- lowing the dietary intervention program. There was no sig- nificant difference in the general characteristics of the subjects among the three groups (Table 2).
Serum estradiol (E2) levels significantly increased in the two groups taking hormone replacement therapy (HRT), and there were small but significant increases in the serum estradiol (E2) levels in the DIET group (Fig. 1). There was a significant difference in the degree of changes in the serum E2levels among the groups (p<0.05); serum E2levels based on the initial value were significantly higher, at weeks 4 and 12, in the HRT and HRT+DIET groups than in the DIET group.
Changes in daily mean nutrient intake during the study period are shown in Table 3. Nutrient intake of the HRT group did not change, but there were significant changes in the nutrient intake of both the DIET group and the HRT +DIET group, at weeks 4 and 12 (p<0.05). Antioxidant vitamin A and E intake, which was under 75% of the recom- mended dietary allowance (RDA) for Koreans at the baseline, increased to over 90% of the RDA. Cholesterol intake de- creased to less than 70 mg/1,000 kcal. The P/S ratio increased from less than 1.0 to 1.3 in the DIET group (p<0.05) and increased to 1.5 in the HRT+DIET group (p<0.05). The ratio of n-6/n-3 decreased from 6.9 to 3.5-4.0 in the DIET group (p<0.05) and decreased from 5.9 to 4.0-5.5 in the HRT+
DIET group (NS). According to an analysis of standardized, quantitative dietary records, the balanced diet actually con- sumed by the subjects during the study period was close to the principles for dietary changes specified in the study design, with substantial differences between the HRT and the dietary
Energy (kcal) 1595.0±6.1a1710.0±7.2b1796.9±5.6c 0.000
% of energy 17.6±0.4 17.5±0.5 17.5±0.4 0.981 from protein
from fat 18.0±0.5 18.0±0.5 17.7±0.5 0.510 from Carbohydrate 63.1±0.3 64.1±0.4 63.0±0.4 0.790 Dietary fiber (g) 28.6±2.1 27.7±1.9 31.8±1.9 0.321 Vitamin A (% RDA) 117.9±13.2 109.6±13.4 115.9±10.4 0.885 Vitamin C (% RDA) 299.9±22.3 283.6±19.0 318.0±28.1 0.588 Vitamin E (% RDA) 95.9±5.2 96.0±4.3 95.8±3.6 0.999 Cholesterol (mg) 81.9±5.1 84.1±5.7 91.3±5.8 0.456 mg/1,000 kcal 51.3±3.2 49.1±3.3 50.9±3.3 0.882 SFA (% of energy) 4.5±0.2 4.4±0.2 4.3±0.1 0.590 MUFA (% of energy) 4.5±0.2 4.4±0.2 4.5±0.2 0.951 PUFA (% of energy) 6.0±0.4 5.9±0.3 6.3±0.3 0.711 n-6 (% of energy) 10.8±0.5 11.0±0.5 11.2±0.5 0.915 n-3 (% of energy) 2.4±0.2 2.5±0.2 2.4±0.2 0.822
P/S 1.3±0.1 1.4±0.1 1.4±0.1 0.524
n-6/n-3 4.7±0.4 4.5±0.4 4.8±0.3 0.873 Nutrients 1,600 kcal 1,700 kcal 1,800 kcal p-value Table 1.Nutrients composition of menus provided to the DIET and the HRT+DIET groups
Age (yr) 51.2±1.2 52.0±2.4 52.0±2.0 0.865 Height (cm) 156.1±1.8 156.9±2.6 159.8±2.0 0.512 Weight (kg) 59.0±1.6 61.3±2.9 61.7±0.2 0.600 BMI (kg/m2) 24.4±0.6 25.8±1.2 25.4±0.8 0.872 FBS (mg/dL) 83.7±2.6 84.5±3.6 86.3±1.8 0.830 TC (mg/dL) 254.2±6.7 252.5±4.0 256.3±8.0 0.936 TG (mg/dL) 111.2±8.0 110.3±11.6 114.0±2.7 0.965 LDL-C (mg/dL) 166.6±7.7 165.2±6.7 165.9±8.6 0.992 HDL-C (mg/dL) 65.4±2.4 65.3±3.6 67.7±5.8 0.889 mean±SEM; p-value by ANOVA; BMI, body mass index; FBS, fasting blood sugar. TC, total cholesterol; TG, triglyceride; LDL-C, low density lipoprotein cholesterol; HDL-C, high density lipoprotein cholesterol;
HRT, hormone replacement therapy group; DIET, dietary intervention group.
Variables HRT DIET HRT+DIET p-value
(n=8) (n=8) (n=8)
Table 2.The general characteristics of the subjects
mean±SE; Values with different alphabets within the same row are sig- nificantly different among groups at =0.05 by Duncan’s multiple range test; p-value by oneway ANOVA. SFA, saturated fatty acids; MUFA, monounsaturated fatty acids; PUFA, polyunsaturated fatty acids; P/S, PUFA/SFA; n-6, n-6 fatty acids; n-3, n-3 fatty acids.
intervention groups.
The changes in the fatty acids composition of serum phos- pholipid (PL) reflected, to some extent, the fatty acid compo- sition of the modified diet (Table 4). During dietary interven- tion, the relative % of C14:0, C16:0 and C18:0 decreased, whereas C18:1, C18:2 (significant only in the HRT+DIET group), C20:4, C20:5 and C22:6 elevated, at week 4 (p<0.05) and, to a lower extent, at week 12 in the DIET and the HRT +DIET groups. With these changes in individual fatty acids composition, the P/S ratio increased and the n-6/n-3 ratio decreased at week 4 (p<0.05), but both tended to return to the initial values at week 12 after dietary intervention. The ratio
of C20:5/C20:4 in serum PL did not significantly change in the HRT group but elevated in the DIET group (p<0.05) and HRT+DIET group (NS) at week 4 (Fig. 2).
The changes in plasma TXB2levels are shown in Fig. 3. In the HRT group, plasma TXB2 levels changed from 36.33
±3.49 pg/mL to 36.17±2.40 pg/mL at week 4, and to 39.33±9.66 pg/mL at week 12, but this change was not statistically significant. In the DIET group, at week 4, TXB2 levels had decreased from 35.00±8.57 pg/mL to 23.10± 3.74 pg/mL (-35.0%, p<0.05). In the HRT+DIET group, at week 4, TXB2 levels had decreased from 28.79±3.91 pg/mL to 23.40±5.33 pg/mL (-18.8%, NS). Thus, at week
Energy (kcal) 2,053.8±108.6 11,957.5±69.0 2,013.2±103.2 2,052.4±136.8 1,724.4±50.4�1,772.4±26.7� 2,043.1±139.9 1,747.2±38.9�1,811.9±6.8�
% of energy
from protein 15.4±0.7 17.1±0.7 16.5±1.0 15.7±1.0 18.2±0.4� 18.1± 0.6� 16.8±0.9 17.3±1.2 18.2±0.7 from fat 24.3±1.0 23.0±1.2 23.9±1.2 23.1±0.6 17.1±0.� 17.7±0.5� 24.1±2.2 18.0±0.6� 17.9±0.6� from carbohydrate 58.6±1.1 57.5±1.5 57.4±0.9 59.5±1.4 63.5±0.7� 63.8±0.9� 56.5±2.6 63.5±1.2� 62.5±1.1� Dietary fiber (g) 22.3±3.9 21.9±2.1 22.0±3.9 25.0±5.4 30.6±4.6 27.1±1.0 22.3±4.8 27.9±0.3 33.7±5.1 Vitamin A (% RDA) 55.3±7.1 54.7±7.9 47.0±6.2 62.5±8.3 103.7±8.9� 94.6±11.3� 50.3±8.4 95.4±13.6�102.5±18.3� Vitamin C (% RDA) 205.5±14.5 185.6±26.7 186.1±51.2 216.1±19.1 257.5±39.7� 288.6±28.6� 194.1±13.9 281.5±23.2�274.7±50.2� Vitamin E (% RDA) 67.9±3.7 68.7±1.7 67.6±3.1 69.6±3.7 96.5±7.4� 102.5±1.8� 71.3±5.1 101.5±2.1� 98.4±4.6� Cholesterol (mg) 213.7±18.0 208.6±11.6 212.0±18.6 226.9±18.8 92.1±8.� 87.5±8.5� 233.8±9.0 73.8±12.0� 91.1±7.4� mg/1,000 kcal 104.2±7.6 106.7±5.5 105.1±7.1 109.9±9.2 53.7±5.8� 49.4±5.1� 115.4±8.0 42.0±6.0� 50.3±4.2� SFA (% of energy) 6.2±0.4 5.9±0.2 6.2±0.4 6.0±0.4 4.6±0.1� 4.6±0.1� 6.1±0.3 4.3±0.3� 4.6±0.3� MUFA (% of energy) 6.5±0.3 6.4± 0.2 6.9±0.3 6.2±0.1 4.9±0.� 5.1±0.1� 6.6±0.5 4.3±0.5� 4.9±0.3� PUFA (% of energy) 5.1±0.3 5.2±0.3 4.8±0.3 5.1±0.3 6.0±0.5� 6.2±0.5� 5.2±0.5 6.8±0.3� 6.9±0.1� n-6 (% of energy) 4.3±0.3 4.5±0.5 4.0±0.3 4.3±0.3 10.4±1.0� 10.6±0.9� 4.6±0.8 11.7±0.9� 11.7±0.1� n-3 (% of energy) 0.6±0.1 0.7±0.1 0.8±0.1 0.7±0.1 2.7±0.3� 2.9±0.2� 0.8±0.1 2.5±0.5� 2.8±0.3�
P/S 0.9±0.1 0.9±0.0 0.8±0.0 0.9±0.1 1.3±0.1� 1.3±0.1� 0.9±0.1 1.6±0.1� 1.5±0.0�
n-6/n-3 7.2±1.0 6.8±1.2 5.6±1.0 6.9±1.3 3.9±0.4� 3.6±0.0� 5.9±1.0 5.3±0.8 4.2±0.5
Values are mean±SE; �Significantly different from the initial value in the same group at p<0.05 by repeated measure design.
0 week 4 week 12 week 0 week 4 week 12 week 0 week 4 week 12 week
HRT DIET HRT+DIET
Nutrients
Table 3.Changes in nutrients intake during the study period
C14:0 0.7±0.04 0.94±0.08 0.66±0.05 0.60±0.03 0.56±0.� 0.55±0.02� 0.70±0.04 0.64±0.� 0.60±0.01 C16:0 49.09 ±1.30 55.67±2.26 50.99±1.45 53.02±1.94 46.60±0.� 50.78±1.11 54.26±0.68 47.04v0.78� 50.02v1.16 C18:0 22.87±0.51 22.87±0.93 21.26±0.32 25.77±0.55 22.66±0.48� 23.69±0.49� 25.04±0.25 20.09±0.73� 21.89±0.90� C18:1 6.71±0.67 5.14±0.90 7.15±0.48 3.92±0.51 7.71±0.16� 6.96±0.47� 3.90±0.30 7.56±0.35� 4.66±0.14 C18:2 (n-6) 14.71±0.90 11.76±1.02 14.77±1.52 12.38±1.27 15.67±0.32 12.90±0.87 11.92±1.00 16.41±0.27� 14.72±0.66� C18:3 (n-3) 0.25±0.04 0.23±0.05 0.27±0.05 0.27±0.02 0.26±0.01 0.29±0.06 0.32±0.06 0.30±0.08 0.17±0.03 C20:4 (n-6) 3.83±0.45 2.34±0.61 3.15±0.63 2.51±0.06 3.12±0.� 3.59±0.05� 2.24±0.23 4.24±0.68� 4.99±0.63� C20:5 (n-3) 0.44±0.07 0.20±0.03 0.28±0.08 0.42±0.03 0.61±0.02� 0.36±0.29� 0.39±0.07 1.04±0.03� 0.53±0.09 C22:6 (n-3) 1.41±0.04 0.86±0.29 1.48±0.40 1.11±0.16 2.44±0.12� 1.35±0.06 1.22±0.08 2.70±0.06� 2.43±0.33� SFA 72.66±1.01 79.48±2.24 72.91±1.70 79.39±1.95 69.82±0.38� 75.02±1.13� 80.00±0.77 67.76±1.01� 72.50±0.28� MUFA 6.71±0.67 5.14±0.90 7.15±0.48 3.92±0.51 7.71±0.16� 6.96±0.47� 3.90±0.30 7.56±0.35� 4.66±0.14 PUFA 20.64±0.97 15.39±1.62 19.95±2.09 16.69±1.45 22.47±0.24� 18.02±1.16 16.09±0.90 24.68±0.69� 22.84±0.34� n-6 18.54±0.91 14.09±1.40 17.92±1.84 14.89±1.32 19.26±0.31� 16.02±1.06 14.16±0.78 20.65±0.58� 19.70±0.07� n-3 2.10±0.13 1.29±0.31 2.03±0.49 1.80±0.19 3.21±0.14� 2.00±0.13 1.93±0.14 4.03±0.11� 3.13±0.41 P/S 0.29±0.02 0.20±0.03 0.28±0.03 0.21±0.02 0.32±0.01� 0.24±0.02 0.20±0.01 0.37±0.02� 0.32±0.06� n-6/n-3 8.94±0.58 12.69±1.72 11.44±2.21 8.81±0.90 6.10±0.32� 8.07±0.37 7.40±0.29 5.12±0.05� 7.07±1.19 Values are mean±SE; �Significantly different from the initial value in the same group at p<0.05 by repeated measure design.
0 week 4 week 12 week 0 week 4 week 12 week 0 week 4 week 12 week
HRT DIET HRT+DIET
Fatty acids
Table 4.Changes in fatty acids composition in serum phospholipid during the study period
Relative % of total fatty acids
4, differences due to treatment were observed; plasma TXB2 levels were lower in both the DIET group and the HRT+
DIET group than in the HRT group (p<0.05). However, TXB2levels in the DIET and the HRT+DIET groups re- turned to initial levels at week 12.
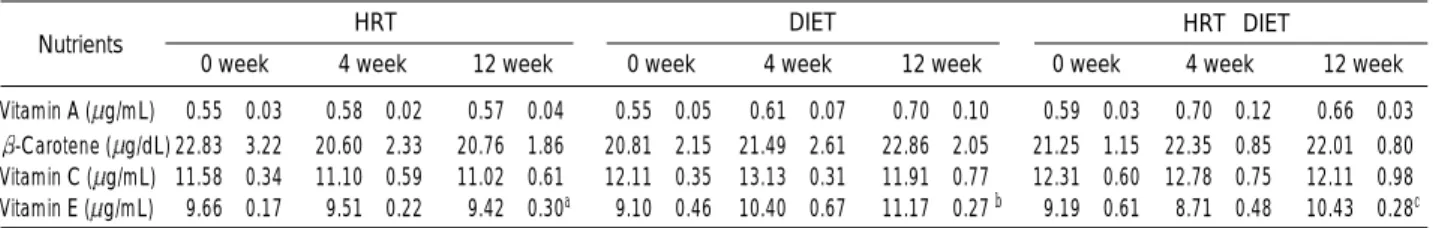
The changes in serum antioxidant are shown in Table 5. In the DIET group, serum vitamin A levels increased by 10.9%
at week 4 and increased by 27.3% at week 12 (p<0.05). In the HRT+DIET group, serum vitamin A level increased by 11.9% only at week 12 (p<0.05). In the HRT+DIET group, serum -carotene levels increased by 3.6% at week 4 and increased by 5.2% at week 12, whereas in the DIET group, the serum vitamin E level increased by 14.3% at week 4 and increased by 22.7% at week 12 (p<0.05). As for serum vita- min E levels, at week 12, a difference due to treatment was also observed; serum vitamin E levels were higher in both the DIET group and the HRT+DIET group than in the HRT group (p<0.05). Serum vitamin C, which, at the beginning of this study, was ingested at a level higher than the RDA,
did not significantly change throughout the study period.
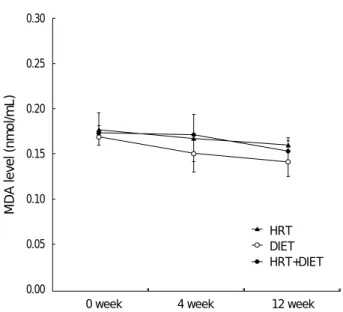
With changes in serum antioxidant vitamin A, vitamin E, and -carotene levels, the serum MDA levels in the DIET group significantly decreased by 10.5% at week 4 and de- creased by 15.2% at week 12 (p<0.05). In the HRT+DIET group, the serum MDA levels decreased by 10.8% only at week 12 (p<0.05) (Fig. 4).
DISCUSSION
It is well established that Greenland Eskimos have a low incidence of cardiovascular disorders and they also have a bleed- ing tendency that may result from reduced platelet aggrega- tion. It has been shown that their intake of n-3 fatty acid, C20:5 is high and, conversely, their intake of n-6 fatty acids, C18:2 and C20:4 is low. Also, both their plasma and platelet lipids have a similar fatty acid pattern to that found in their diet (29).
Therefore, it has been suggested that a shift in dietary fatty acids composition towards the Greenland Eskimo pattern may prevent certain cardiovascular disorders, especially by reducing
Vitamin A ( g/mL) 0.55±0.03 0.58±0.02 0.57±0.04 0.55±0.05 0.61±0.07� 0.70±0.10� 0.59±0.03 0.70±0.12 0.66±0.03� -Carotene ( g/dL) 22.83±3.22 20.60±2.33 20.76±1.86 20.81±2.15 21.49±2.61 22.86±2.05 21.25±1.15 22.35±0.85� 22.01±0.80� Vitamin C ( g/mL) 11.58±0.34 11.10±0.59 11.02±0.61 12.11±0.35 13.13±0.31 11.91±0.77 12.31±0.60 12.78±0.75 12.11±0.98 Vitamin E ( g/mL) 9.66±0.17 9.51±0.22 9.42±0.30a 9.10±0.46 10.40±0.67� 11.17±0.27 b� 9.19±0.61 8.71±0.48 10.43±0.28c Values are mean±SE; �Significantly different from the initial value in the same group at p<0.05 by repeated measure design; Values with different alpha- bets within the same week are significantly different among groups based on the initial value at p<0.05 as analyzed by repeated measure design.
0 week 4 week 12 week 0 week 4 week 12 week 0 week 4 week 12 week
HRT DIET HRT+DIET
Nutrients
Table 5.Changes in serum antioxidant vitamins during the study period
Estradiol level (pg/mL)
50.00
40.00
30.00
20.00
10.00
0.00
0 week 4 week 12 week
HRT DIET HRT+DIET
Fig. 1.The changes in serum estradiol (E2) level. �, significantly different from the initial value in the same group at p<0.05 by a repeated measure design; Values with different characters with- in the same week are significantly different among groups based on the initial value at p<0.05 as analyzed by a repeated measure design.
�a
�a
�a
�a
�b
�b
HRT DIET HRT+DIET
C20:5/C20:4
0.30
0.25
0.20
0.15
0.10
0.05
0.00
0 week 4 week 12 week
Fig. 2.The changes in C20:5/C20:4 ratio in serum phospholipid.
�, significantly different from the initial value in the same group at p<0.05 by a repeated measure design.
�
the risk of thrombosis (30).
In the present study, at week 4, with the changes in the dietary fat composition after the dietary fat modification, serum phospholipid (PL) P/S ratios increased by 52.4% in the DIET group, and increased by 85.0% in the HRT+DIET group (p<0.05). Also at week 4, n-6/n-3 ratios decreased by 30.7% in the DIET group and decreased by 30.8% in the HRT+DIET group (p<0.05). Despite the fact that fatty acid changes in dietary fat in the two groups were maintained until week 12, ratios in serum PL tended to return to their initial values at week 12. The reason for this finding remains uncertain, but in some cases, poor responses can be explained by poor adherence to diet. Many studies have indicated that changes in fatty acids of dietary fat led to changes in fatty acids of serum and cell lipids, and, consequently, said studies pointed out the impor- tance of dietary habits on the blood fatty acids composition (30-32). Therefore, we can suppose that the subjects of the HRT group and the HRT+DIET group may have progres- sively departed from the prescribed balanced diet, but failed to report these behavioral changes in their dietary diaries. On the other hand, in the HRT group, a few fatty acids of serum PL also changed, even though there were no significant changes in their fatty acid intakes. Several studies have suggested that estrogen can affect blood fatty acid composition, but we can- not conclude whether those changes are due to estrogen, or not (33, 34). Even now, the effect of estrogen on serum fatty acid composition is controversial, and, as such, requires fur- ther research.
Platelet aggregation is modulated by the production of TXA2 and PGI2. An optimal balance of TXA2-PGI2may be impor-
tant in the prevention of thrombotic conditions. Evidence indi- cates that dietary fatty acids can alter this balance (35, 36).
According to Kinsella et al. (35), the only dietary fatty acid change shown to affect thrombosis in humans is an increased intake of n-3 fatty acids. When this occurs, the platelets accu- mulate n-3 fatty acids, especially eicosapentaenoic acid. The n-3 fatty acids replace some of the arachidonic acid in the platelet membranes, decreasing its availability for eicosanoid formation. As a result, less TXA2is produced in response to activation, and the tendency for the platelets to aggregate is reduced (30, 38). In this present study, at week 4, the ratios of C20:5/C20:4 in serum PL increased, but plasma TXB2 levels, metabolites of TXA2(39), decreased by 35.0% in the DIET group (p<0.05) and decreased by 18.8% in the HRT +DIET group (NS). Recently, Mantzioris et al. reported that an increase of dietary C20:5 intake led to an average 3-fold increase in C20:5 in plasma, platelet, and mononuclear cell phospholipids, and they also reported TXB2synthesis decreased by 36% (39). These findings, taken in conjunction with pre- vious epidemiological studies in Eskimos, suggest that a change in fatty acids consumption, such that a diet with a high C20:
5/C20:4 ratio could reduce platelet aggregability by decreas- ing plasma TXB2levels, would exert a beneficial influence on certain cardiovascular disorders.
Many studies have suggested that oxidative modification of low-density lipoprotein (LDL) promotes atherosclerosis, which, in turn, has brought about considerable interest in the role of dietary antioxidant vitamins in preventing CVD (40-42).
When PUFAs metabolism is studied, antioxidants should be measured because lipid peroxides, formed by the peroxidation of PUFAs, may be important in the development of atheroscle- rosis and thrombosis (12, 43, 44). It has also been suggested
HRT DIET HRT+DIET
MDA level (nmol/mL)
0.30
0.25
0.20
0.15
0.10
0.05
0.00
0 week 4 week 12 week
Fig. 4.The changes in serum lipid peroxide level. �, significantly different from the initial value in the same group at p<0.05 by a repeated measure design; MDA, malondialdehyde.
�
�
�
TXB2level (pg/mL)
50.00
40.00
30.00
20.00
10.00
0.00
0 week 4 week 12 week
HRT DIET HRT+DIET
Fig. 3.The changes in plasma TXB2level. �, significantly different from the initial value in the same group at p<0.05 by a repeated measure design; Values with different characters within the same week are significantly different among groups based on the initial value at p<0.05 as analyzed by a repeated measure design.
b
�a
that oxidized LDL may enhance the progression of atheroscle- rotic lesions by increasing platelet adhesion and aggregation, triggering thrombosis and impairing vasodilatation (45).
Living organisms have two principal means of protecting themselves from the potentially injurious effects of free radi- cals. One means of protection involves enzymes such as glu- tathion peroxidase and catalase, both of which contain specif- ic trace elements (selenium, copper, manganese, and zinc). The other means of protection involves antioxidants, especially vitamin C and E, and carotenoids. Vitamin C, -tocopherol, and -carotene are among the most abundant dietary antiox- idants, and the concentration of these antioxidants is mainly determined by their dietary supply (46). The role of dietary antioxidant vitamins in preventing CVD can be of greater importance in postmenopausal women because serum lipid peroxides levels in postmenopausal women are higher than serum lipid peroxides levels in premenopausal women (47).
In this present study, there was a significant reduction in serum MDA levels in the DIET group and in the HRT+
DIET group, despite an increase of P/S ratios in the dietary fat and serum PL of the two groups. This reduction in serum MDA levels is considered to be due to the increase in the two groups’serum vitamin A, -carotene, and especially vitamin E levels, through the modification of these aforementioned dietary antioxidant vitamins. Clinical trials suggest that vita- min E reduces platelet aggregability, and trials also suggest that there is a strong association between low serum vitamin E levels and platelet aggregability. These results indicate that antioxidants may be important in the regulation of platelet function (48, 49). Salonen et al. have reported that antioxi- dant supplementation in men with low a antioxidant status and a high fat intake reduces lipid peroxidation, reduces the capacity of platelets to aggregate and to produce TXA2, and also reduces in vivo platelet activation (49). The reduction in plasma TXB2levels may be related to the observed reduc- tion of serum MDA levels in both the DIET group and the HRT+DIET group (week 4), taking into account the results of these studies (48-49). In fact, there was a significant corre- lation between the serum MDA levels and the plasma TXB2 levels in the DIET group and the HRT+DIET group ( = 0.684, p=0.007, data not shown). However, previous clinical trials on the effects of antioxidants on platelet function have produced inconsistent results. Recently, epidemiological and clinical trial data suggested the absence of relevant clinical effects of antioxidant vitamins on the risk of cardiovascular events (50). Thus, the relationship between serum antioxidant vitamins, MDA levels, and platelet function needs further research.
We do not know whether the reduction in the plasma TXB2 level observed in our study was due to changes in serum PL fatty acid composition or changes in the serum MDA levels.
The relationship between fatty acid composition, antioxidant vitamins, serum MDA levels, and platelet function needs fur- ther research. However, more importantly, the focus in this
present study is on ‘what diet is good’ rather than ‘what nutrient is good’ for the prevention of cardiovascular disease. The dietary modifications needed to prevent certain diseases may probably be much larger than those usually occurring in the human diet, making it unlikely that these processes would come into play under ordinary conditions. In fact, this study devoted considerable effort to encourage dietary compliance, which is not easy in routine clinical practice. Nevertheless, it is very stimulating to note that postmenopausal women, if they are highly motivated, can decrease their thrombotic risks by way of dietary intervention which can be achieved by replac- ing SFAs with PUFAs, eating less fat- and cholesterol-rich foods, eating more fish and lean meat, and eating more fresh fruits and vegetables.
ACKNOWLEDGMENT
We would like to thank Hyejoung Hong and Yoonjung Choi for their assistance. We also thank professor Jongsuk Kwon at Singu College and Junghae Noh at the Korean Food Research Institute for their advice and assistance.
REFERENCES
1. Eaker ED, Packard B, Thom TJ. Epidemiology and risk factors for coronary heart disease in women. Cardiovasc Clin 1989; 19: 129- 45.
2. Tunstall-Pedoe H, Kuulasmaa K, Mahonen M, Tolonen H, Ruokokos- ki E, Amouyel P. Contribution of trends in survival and coronary- event rates to changes in coronary heart disease mortality: 10-year results from 37 WHO MONICA Project population. Lancet 1999;
353: 1547-57.
3. National Statistical Office Republic of Korea. Annual report on the cause of death statistics, Seoul, Korea, 1999: 20-35.
4. Bar J, Tepper R, Fuchs J, Pardo Y, Goldberger S, Ovadia J. The effect of estrogen replacement therapy on platelet aggregation and adenosine triphosphate release in postmenopausal women. Obstet Gynecol 1993; 81: 261-4.
5. Gerhard M, Ganz P. How do we explain the clinical benefits of estro- gen? From bedside to bench. Circulation 1995; 92: 5-8.
6. Sirtori CR, Gatti E, Tremoli E, Galli C, Franceschini G, Colli S, Maderna P, Marangoni F, Perego P. Olive oil, corn oil, and n-3 fatty acids differently affect lipids, lipoproteins, platelets and superoxide formation in type II hypercholesterolemia. Am J Clin Nutr 1992; 56:
113-22.
7. Hoak JC, Spector AA. Workshop on dietary fatty acids and thrombo- sis. Am J Clin Nutr 1992; 56: 783S-4S.
8. Cabre E, Periago JL, Mingorance MD, Fernandez-Banares F, Abad A, Esteve M, Gil A, Lachica M, Gonzalez-Huix F, Gassull MA.
Factors related to the plasma fatty acid profile in healthy subjects, with special reference to antioxidant micronutrient status: a multi- variate analysis. Am J Clin Nutr 1992; 55: 831-7.
9. Hornstra G, Lussenberg RN. Relationship between the type of dietary fatty acid and the arterial thrombosis tendency in rats. Atheroscle- rosis 1975; 22: 499-516.
10. Renaud S, Morazain R, Godsey F, Dumont E, Thevenon C, Martin JL, Mendy F. Nutrients, platelet function and composition in nine groups of French and British farmers. Atherosclerosis 1986; 60:
37-48.
11. Bang HO, Dyerberg J, Sinclair HM. The composition of the Eskimo food in northwestern Greenland. Am J Clin Nutr 1980; 33: 2657-61.
12. Stringer MD, Gorog PG, Freeman A, Kakkar VV. Lipid peroxides and atherosclerosis. BMJ 1989; 298: 281-4.
13. Yla-Herttuala S, Palinski W, Rosenfeld ME, Parthasarathy S, Carew TE, Butler S, Witztum JL, Steinberg D. Evidence for the presence of oxidatively modified low-density lipoprotein in atherosclerotic lesions of rabbits and man. J Clin Invest 1989; 84: 1086-95.
14. Chin JH, Azhar S, Hoffman BB. Inactivation of endothelial derived relaxing factor by oxidized lipoproteins. J Clin Invest 1992; 89: 10-8.
15. Oubina P, Sanchez-Muniz FJ, Rodenas S, Cuesta C. Eicosanoid production, thrombogenic ratio, and serum and LDL peroxides in normo- and hypercholesterolaemic post-menopausal women con- suming two oleic acid-rich diets with different content of minor com- ponents. Br J Nutr 2001; 85: 41-7.
16. Miller GJ. Hyperlipidaemia and hypercoagulability. Prog Lipid Res 1993; 32: 61-9.
17. Sanchez-Muniz FJ, Oubina P, Benedi J, Rodenas S, Cuesta C. Pre- liminary study on platelet aggregation in postmenopausal women consuming extra virgin olive oil and high oleic acid sunflower oil. J Am Oil Chem Soc 1998; 75: 217-23.
18. Kim SY, Jung KA, Lee BK, Chang YK. A study of the dietary intake status and one portion size of commonly consumed food and dishes in Korean elderly women. Korean J Commun Nutr 1997; 2: 578- 92.
19. Kim SY, Jung KA, Choi YJ, Chang YK. Comparisons of nutrients intake of normocholesterolemia and hypercholesterolemia in the postmenopausal women. Korean J Commun Nutr 2000; 5: 461-74.
20. Ulbricht TLV, Southgate DAT. Coronary heart disease: seven dietary factors. Lancet 1991; 338: 985-92.
21. Kim SY, Jung KA, Chang YK. Development of a semi-quantitative food frequency questionnaire to assess dietary intake of the elderly women in Korea. J Korean Living Sci Res 2000; 18: 311-42.
22. Hong HJ. Validation study of a self-administered semi-quantitative food frequency questionnaire among postmenopausal women in Seoul. Master thesis. Hanyang University, 1999.
23. Bieri G, Tolliver JJ, Catignani GL. Simultaneous determination of alpha-tocopherol and retinal in plasma or red blood cell by high performance liquid chromatography. Am J Clin Nutr 1979; 32:
2143-9.
24. Kim HY. Influence of carotene supplementation on serum carotene and retinal levels in lactoovovegetarian and nonvegetarian women.
Korean J Nutr 1989; 22: 257-65.
25. Otsuka M, Kurata T, Suzuki E, Arakawa N, Inagaki C. Separative determination of ascorbic acid and erythrobic acid in animal tissues by high performance liquid chromatography. J Nutr Sci Vitaminol 1981; 27: 9-15.
26. Yagi K. A simple fluorometric assay for lipoperoxide in blood plas- ma. Biochem Med 1976; 15: 212-6.
27. Folch J, Lees M, Stanley GHS. A simple method for the isolation and purification of total lipids from animal tissue. J Biochem 1957; 226:
497-509.
28. Morrison WR, Smith LM. Preparation of fatty acid methylesters and dimethyl acetals from lipids with boron fluoride methanol. J Lipid Res 1964; 5: 600-8.
29. Dyerberg J, Bang HO. Hemostatic function and platelet polyunsatu- rated fatty acids in Eskimos. Lancet 1979; ii: 433.
30. Nagakawa Y, Orimo H, Harasawa M, Morita I, Yashiro K, Murota S. Effect of eicosapentaenoic acid on the platelet aggregation and composition of fatty acid in man. Atherosclerosis 1983; 47: 71-5.
31. Siess W, Roth P, Scherer B, Kurzmann I, Bohlig B, Weber PC.
Platelet-membrane fatty acids, platelet aggregation, and thrombox- ane formation during a mackerel diet. Lancet 1980; 1: 441-4.
32. Denke MA. Diet and lifestyle modification and its relationship to atherosclerosis. Med Clin North Am 1994; 78: 197-223.
33. Fehily AM, Dickerson JW, Meade BW, Ellis FR. Plasma and ery- throcyte membrane fatty acids in oral contraceptive users. Clin Chim Acta 1982; 120: 41-7.
34. Ottosson UB, Lagrelius A, Rosing U, von Schoultz B. Relative fatty acid composition of lecithin during postmenopausal replacement therapy: a comparison between ethinyl estradiol and estradiol valer- ate. Gynecol Obstet Invest 1984; 18: 296-302.
35. Kinsella JE, Lokesh B, Stone RA. Dietary n-3 polyunsaturated fatty acids and amelioration of cardiovascular disease: possible mecha- nisms. Am J Clin Nutr 1990; 52: 1-28.
36. Spector AA. Can changes in dietary fatty acid intake lead to changes in physiologic responses related to thrombosis? Am J Clin Nutr 1992;
56: S797.
37. FitzGerald GA, Catella F, Oates JA. Eicosanoid biosynthesis in human cardiovascular disease. Hum Pathol 1987; 18: 248-52.
38. Knapp HR. Dietary fatty acids in human thrombosis and haemosta- sis. Am J Clin Nutr 1997; 65: 1687S-98S.
39. Mantzioris E, Cieland LG, Gibson RA, Neumann MA, Demasi M, James MJ. Biochemical effects of a diet containing foods enriched with n-3 fatty acids. Am J Clin Nutr 2000; 72: 42-8.
40. Manson JE, Gaziano JM, Jonas MA, Hennekens CH. Antioxidants and cardiovascular disease: A review. J Am Coll Nutr 1993; 12:
426-32.
41. Manson JE, Gaziano JM, Spelsberg A, Ridker PM, Cook NR, Bur- ing JE, Willett WC, Hennekens CH. A secondary prevention trial of antioxidant vitamins and cardiovascular disease in women. Ann Epidemiol 1995; 5: 261-9.
42. Kushi LH, Folsom AR, Prineas RJ, Mink PJ, Wu Y, Bostick RM.
Dietary antioxidant vitamins and death from coronary heart disease in postmenopausal women. N Engl J Med 1996; 334: 1156-62.
43. Yagi K. Increased serum lipid peroxides initiate atherogenesis.
Bioassays 1984; 1: 58-60.
44. Cabre E, Periago JL, Mingorance MD, Fernandez-Banares F, Abad A, Esteve M, Gil A, Lachica M, Gonzalez-Huix F, Gassull MA.
Factors related to the plasma fatty acid profile in healthy subjects, with special reference to antioxidant micronutrient status: a multi-
variate analysis. Am J Clin Nutr 1992; 55: 831-7.
45. Holvoet P, Collen D. Oxidized lipoproteins in atherosclerosis and thrombosis. FASEB J 1994; 8: 1279-84.
46. Gey KF, Moser UK, Jordan P, Stahelin HB, Eichholzer M, Ludin E. Increased risk of cardiovascular disease at suboptimal plasma concentrations of essential antioxidants: an epidemiological update with special attention to carotene and vitamin C. Am J Clin Nutr 1993; 57(suppl): S787-97.
47. Massafra C, Buonocore G, Giola D, Sargentini I, Farina G. Effects of estradiol and medroxyprogesterone-acetate treatment on erythro- cyte antioxidant enzyme activities and malondialdehyde plasma lev- els in amenorrhoic women. J Clin Endocrinol Metab 1997; 82:
173-5.
48. Lake AM, Stuart MJ, Oski FA. Vitamin E deficiency and enhanced platelet function: reversal following E supplementation. J Pediatr 1977; 90: 722-5.
49. Salonen JT, Salonen R, Seppanen K, Rinta-Kiikka S, Kuukka M, Korpela H, Alfthan G, Kantola M, Schalch W. Effects of antioxi- dant supplementation on platelet function: a randomized pair-matched, placebo-controlled, double-blind trial in men with low antioxidant status. Am J Clin Nutr 1991; 53: 1222-9.
50. Marchioli R, Schweiger C, Levantesi G, Tavazzi L, Valagussa F.
Antioxidant vitamins and prevention of cardiovascular disease: epi- demiological and clinical trial data. Lipids 2001; 36(Suppl): S53-63.