ISSN 2234-3806 • eISSN 2234-3814
https://doi.org/10.3343/alm.2018.38.1.9
Serum Macrophage Migration Inhibitory Factor as a Biomarker of Active Pulmonary Tuberculosis
Zhong-bo Shang, M.D.1,*, Jun Wang, M.D.2,*, Shou-gang Kuai, M.D.1,2, Yin-yin Zhang, M.D.2, Qin-fang Ou, M.D.3, Hao Pei, M.D.2, and Li-hua Huang, M.D.3
Department of Clinical Laboratory1, Wuxi Huishan People’s Hospital, Wuxi, Jiangsu; Departments of Clinical Laboratory2 and Respiratory Medicine3, The Fifth People’s Hospital of Wuxi, Affiliated to Jiangnan University, Wuxi, Jiangsu, China
Background: Macrophage migration inhibitory factor (MIF), a pro-inflammatory cytokine with chemokine-like functions, has been shown to play a central role in several acute and chronic inflammatory diseases. However, limited information is available regarding the use of MIF as an inflammatory pathway marker in patients with tuberculosis. This study aimed to investigate the association of MIF with IFN-γ and TNF-α in active pulmonary tuberculo- sis (APTB) following anti-tuberculosis treatment.
Methods: The MIF, TNF-α, and IFN-γ serum levels were determined in 47 patients with APTB by cytokine-specific ELISA at four phases: prior to anti-tuberculosis drug treatment (baseline), and following 2, 4, and 6 months of treatment. In addition, we measured the MIF, TNF-α, and IFN-γ serum levels in 50 health controls.
Results: MIF serum levels were significantly elevated (P <0.05) in patients with APTB prior to treatment compared with that in control subjects, and TNF-α ≥449.7 pg/mL was associated with high MIF levels ( ≥13.1 ng/mL). MIF levels were significantly reduced (P <0.01) following 2, 4, and 6 months of treatment, with variations in TNF-α and IFN-γ serum levels. MIF levels were positively correlated with the paired TNF-α level at baseline (r=0.1103, P =0.0316) and following 6 months of treatment (r=0.09569, P =0.0364).
Conclusions: A reduction in the MIF serum levels in patients with APTB following anti-tu- berculosis treatment may positively affect host immune protection against Mycobacterium tuberculosis infection. Thus, serum MIF levels may constitute a useful marker for assess- ing therapy effectiveness in patients with APTB.
Key Words: Macrophage migration inhibitory factor, TNF-α, IFN-γ, Active pulmonary tu- berculosis
Received: November 23, 2016 Revision received: May 10, 2017 Accepted: September 20, 2017 Corresponding author: Shou-gang Kuai Departments of Clinical Laboratory, Huishan People’s Hospital, 214187, Wuxi, Jiangsu, China
Tel: +86-0510-83318119 Fax: +86-0510-68918000 E-mail: [email protected]
* Zhong-bo Shang and Jun Wang are co- first authors.
© Korean Society for Laboratory Medicine This is an Open Access article distributed under the terms of the Creative Commons Attribution Non-Commercial License (http://creativecom- mons.org/licenses/by-nc/4.0) which permits unrestricted non-commercial use, distribution, and reproduction in any medium, provided the original work is properly cited.
INTRODUCTION
Macrophage migration inhibitory factor (MIF) was first described as a soluble factor released by activated T-lymphocytes in 1966 [1]. MIF, a pro-inflammatory cytokine with chemokine-like func- tions, has been shown to play a central role in several acute and chronic inflammatory diseases by promoting leukocyte recruit- ment [1-5]. As an important pro-inflammatory cytokine, MIF may
counter-regulate glucocorticoid effects by activating immune/in- flammatory cells and promoting the expression of matrix metal- loproteinases and the release of nitric oxide, prostaglandin E2 [6-9], or pro-inflammatory and inflammatory cytokines, such as TNF-α, IL-1β, IL-2, IL-6, IL-8, and IFN-γ [10]. In addition, sev- eral studies have shown a correlation between the high expres- sion of MIF alleles and improved outcomes of pneumonia and meningococcal meningitis and more severe outcomes of ma-
2017-03-16 https://crossmark-cdn.crossref.org/widget/v2.0/logos/CROSSMARK_Color_square.svg
laria [11-13].
Host immune cells secrete a number of cytokines involved in the defense against Mycobacterium tuberculosis (M.tb) infection [14]; these cytokines play important roles in the initiation and regulation of the immune response during the different stages of tuberculosis (TB) development [15]. The interaction between infected macrophages and T lymphocytes is critical for protec- tive immunity against M.tb and is mediated by a number of in- flammatory cytokines produced by several cell types [16]. Fol- lowing standard anti-tuberculosis drug (ATD) therapy, it is likely that cytokine-mediated cell signaling is altered, which ultimately leads to recovery of TB infection. Thus, assessing the associa- tion of the major cytokines at different stages of disease progres- sion is necessary to elucidate the host response mechanism against M.tb. The major cytokines produced by immune cells during the effective phases of the immune response include IFN-γ, TNF-α, and MIF [17], which activate macrophages by potentiating their microbicidal mechanisms [18], including au- tophagy mechanisms involved in M.tb clearance [19], and main- taining the structural integrity of granulomas [20].
A number of groups have attempted to identify cytokines and other clinical characteristics in patients with TB in order to de- termine which of these could be used as biomarkers for TB de- velopment. Limited information is available regarding the use of MIF as an inflammatory pathway marker in patients with TB un- dergoing ATD therapy. Thus, the objective of this study was to assess the role of MIF associated with IFN-γ and TNF-α in ac- tive pulmonary tuberculosis (APTB) following ATD therapy.
METHODS 1. Study population
A case-control study, including two study groups, was conducted from January 2015 to June 2016. The first group consisted of 47 patients with APTB enrolled from the Respiration Department of the Wuxi Fifth People’s Hospital, China. The patients were di- agnosed as having TB based on positive results for acid-fast ba- cilli (AFB) and a chest X-ray examination. For the control group, 50 healthy subjects were matched for analysis; they were identi- fied by self-report and recruited from the general population in the same geographic area with negative T-SPOT.TB assays. The age between patients with APTB (median 44.6 years, range 28.7–
72.3 years) and healthy controls (median 43.5 years, range 26.2–
73.1 years) was not statistically different. The same result was the gender ratio of the two groups.
2. Clinical and demographic characteristics
The clinical characteristics of 47 patients with APTB and 50 healthy controls are shown in Table 1. The median age of pa- tients was 48 years; 57.4% of the patients were male. All pa- tients enrolled in our study were receiving treatment for the first time. The control group included 50 healthy subjects (60% fe- male and 40% male) with a median age of 43.5 (26.2–73.1) years. Eighteen (38.3%) patients had a history of smoking, 12 patients (17.6%) were HBV/HCV-positive patients, six (12.8%) patients had been diagnosed as having diabetes mellitus (DM), and four (8.5%) patients had cancer. Eleven patients with APTB had coexisting extra-pulmonary lesions, 29 patients were bacte- riologically confirmed, 20 patients exhibited cavitation on initial chest X-ray (CXR), and only six patients presented with drug re- sistance.
3. Ethical considerations
Ethical approval and informed consent were obtained from all individuals prior to enrollment in the study, according to the eth- ical guidelines approved by the ethical committee of Wuxi 5th People’s Hospital affiliated with Jiangnan University.
4. Quantitative cytokine assays
Serum samples were obtained from healthy controls and patients with APTB. Patient samples were obtained at four time-points:
Table 1. Clinical features of patients with tuberculosis and healthy controls
Clinical features
Active TB (n=47)
N (%)
Healthy controls (n=50) N (%)
P valuea
Age (year)
≥50 13 (27.7) 11 (22.0) 0.417
<50 34 (72.3) 39 (78.0)
Sex, male 27 (57.4) 30 (60.0) 0.839
History of smoking 18 (38.3) 11 (22.0) 0.120
Cancer 4 (8.5) 0
DM 6 (12.8) 0
HBV/HCV 12 (17.6) 0
Cavitation on initial CXR 20 (42.5) 0 Coexistence of extra-pulmonary lesion 11 (23.4) 0 Presence of drug resistance 6 (12.8) 0 Culture positive and/or smear-positive 29 (61.7) 0
aby Pearson’s chi-square test.
Abbreviations: DM, diabetes mellitus; CXR, chest X-ray.
at first admission prior to any treatment, and following two, four, and six months of standard anti–TB treatment. The sera were collected following centrifugation and frozen immediately at -20°C until analysis. MIF, IFN-γ, and TNF-α serum levels were deter- mined using an ELISA Kit for humans (R&D Systems, Minneap- olis, MN, USA), according to the manufacturer’s instructions.
Assays were repeated twice to obtain an average. Absorbance at 492 nm was measured using a spectrophotometer.
5. Statistical analysis
All data were statistically analyzed using SPSS 17.0 (SPSS, Inc., Chicago, IL, USA). The Pearson’s chi-square test and Mann–
Whitney U test were used to identify significant differences be- tween groups; P <0.05 (two-sided) was considered as a statisti- cally significant difference. The odds ratios (ORs) were estimated with 95% confidence intervals (95% CIs) from the bivariate anal- ysis; P <0.05 was considered statistically significant. ROC curves were analyzed to determine the best cut-off value of each pa-
rameter. Spearman’s correlation analysis was constructed to as- sess the relationship between MIF and other clinical character- istics; P <0.05 was considered statistically significant.
RESULTS
1. Patient cytokine serum levels prior to anti-tuberculosis treatment
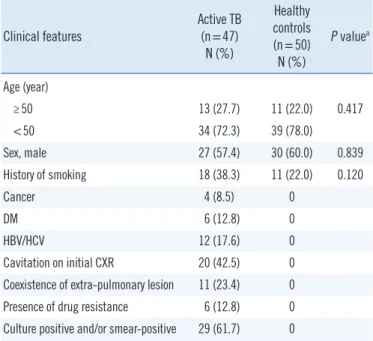
Prior to treatment, the average level of MIF (17.19 ng/mL vs 9.36 ng/mL, P <0.01), TNF-α (583.6 pg/mL vs 343.3 pg/mL, P <0.05), and IFN-γ (559.5 pg/mL vs 396.7 pg/mL, P <0.01) were significantly different between patients with APTB and healthy controls (Fig. 1). The best cut-off value was 13.1 ng/mL for MIF, 449.7 pg/mL for TNF-α, and 548.9 pg/mL for IFN-γ.
The cutoff value MIF =13.1 ng/mL was used to divide the 47 patients with APTB into two groups (MIF level ≥13.1 ng/mL and MIF level <13.1 ng/mL). The cut-off values TNF-α=449.7 pg/mL and IFN-γ=548.9 pg/mL were used to examine whether
Fig. 1. Serum levels of MIF, TNF-α, and IFN-γ in 47 patients with active pulmonary TB and 50 control subjects. (A) MIF levels in pa- tients with TB (17.19 ng/mL [12.71–21.67] and in control subjects (9.36 ng/mL [7.29–11.43]. (B) TNF-α levels in patients with TB (583.6 pg/mL [453.1–844.5] and in control subjects (343.3 pg/mL [298.6–434.2]. (C) IFN-γ levels in patients with TB (559.5 pg/mL [255.0–864.0] and in control subjects (396.7 pg/mL [189.5–603.9].
Data are presented as median values (interquartile range).
Abbreviation: MIF, macrophage migration inhibitory factor.
30
20
10
0 TB CON
MIF (ng/mL)
P <0.001
A 3,000
2,000
1,000
0 TB CON
TNF-α (pg/mL)
P =0.04 B
1,000
500
0 TB CON
IFN-γ (pg/mL)
P <0.001 C
different levels of TNF-α and IFN-γ were associated with high MIF levels. Thirty-nine (83%) of the patients with APTB had el- evated pre-treatment MIF levels (≥13.1 ng/mL), and eight (17%) patients had lower MIF levels (<13.1 ng/mL) (Table 2). The 47 patients with APTB were divided into two groups based on MIF level to analyze the factors associated with MIF level. The results indicated that only levels of TNF-α≥449.7 pg/mL were associ- ated with high MIF levels (OR=12.78, 95% CI, 1.326–123.1).
2. Alteration of serum cytokine concentration following ATD treatment
In patients with APTB, the serum levels of MIF, TNF-α, and IFN-γ significantly decreased (P <0.01) over the six months of ATD treatment (Fig. 2), reaching or approaching values close to those of the healthy controls. The median serum baseline MIF level was 17.19 (12.71–21.67) ng/mL, and MIF level decreased to 14.57 (11.98–16.98) ng/mL following two months of ATD ther- apy. MIF levels further decreased to 9.79 (8.17–12.35) ng/mL and 7.84 (6.34–8.70) ng/mL following four and six months of ATD therapy, respectively. Taken together, these findings indi- cate that there was a rapid decrease in serum MIF levels be- tween zero to six months of ATD therapy; similar changes were observed for the serum levels of TNF-α and IFN-γ. Interestingly, six patients presented with drug resistance (one or more of iso- niazid, rifampicin, pyrazinamide, and ethambutol) following six months of ATD therapy; their average MIF levels (12.53 ng/mL)
remained significantly higher (P <0.0001) than that of the other patients (7.16 ng/mL).
3. Relationship between patient cytokine concentrations prior to and post anti-tuberculosis treatment
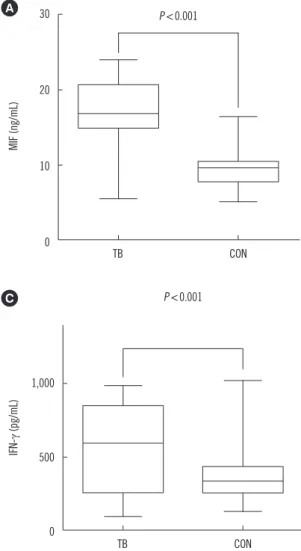
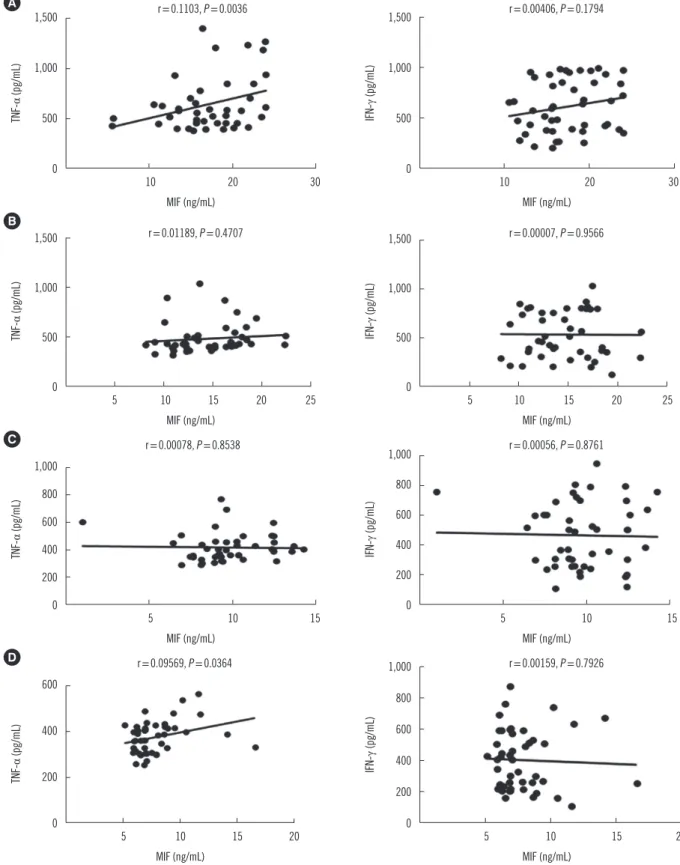
We next analyzed the correlation between MIF and IFN-γ serum levels in the patient groups at baseline and following two, four, and six months of ATD therapy. All correlations for the serum levels of MIF and IFN-γ showed P values higher than 0.05 (Fig.
3). However, a positive correlation was observed between MIF and TNF-α serum levels at baseline and following six months of therapy in the APTB group (P <0.05) (Fig. 3).
DISCUSSION
Understanding the immune mechanisms responsible for the outcomes of M.tb infection is crucial for developing improved preventive and therapeutic strategies. To date, MIF-related mac- rophage responses and the role of pro-inflammatory activation in TB has not been studied.
In this study, we compared two groups: 47 patients with APTB and 50 healthy controls from Eastern China. The MIF, TNF-α, and IFN-γ serum levels in the 47 patients with APTB were as- sessed during six-month period of ATD treatment. We also de- termined the MIF, TNF-α, and IFN-γ serum levels in 50 healthy controls. At baseline, the patients with APTB had highly elevated Table 2. Odds ratio (OR) for the associations between potential risk factors and high MIF level (≥13.1 ng/mL)
Active TB (n=47) MIF ≥13.1 ng/mL
(n=39) MIF <13.1 ng/mL
(n=8) OR P value
Age (year)
<50 28 6 Reference
≥50 11 2 0.593 (0.065–5.436) 0.644
Sex, male 24 3 3.243 (0.502–20.94) 0.216
History of smoking 15 3 1.127 (0.157–8.104) 0.906
Cancer 4 0
DM 5 1 0.555 (0.039–7.947) 0.665
HBV/HCV 10 2 1.214 (0.131–11.22) 0.865
Initial cavitation 18 2 4.759 (0.485–46.70) 0.181
Coexistence of extra-pulmonary lesion 9 2 3.236 (0.239–43.89) 0.377
Presence of drug resistance 6 0
Culture positive and/or smear-positive 24 5 1.456 (0.225–9.415) 0.693
TNF-α ≥449.7 pg/mL 34 4 12.78 (1.326–123.1) 0.028
IFN-γ ≥548.9 pg/mL 21 4 1.234 (0.177–8.625) 0.832
Abbreviations: MIF, macrophage migration inhibitory factor; DM, diabetes mellitus.
serum levels of MIF, TNF-α, and IFN-γ, and following ATD ther- apy, their levels rapidly decreased to near normal values. As pre- viously reported, a number of pro-inflammatory cytokines in- cluding MIF, TNF-α, and IFN-γ are excessively secreted follow- ing M.tb infection from host macrophages [21], and elevated circulating MIF can activate peripheral blood mononuclear cells to promote the production of inflammatory mediators, thereby enhancing the inflammatory response [22]. The dramatic re- sponse of serum MIF during ATD treatment was evident, indi- cating that MIF can be used as a marker (similar to TNF-α and IFN-γ) for assessing therapy effectiveness in patients with APTB.
Moreover, patients with severe TB who did not respond to ATD therapy maintained high MIF levels; this finding further supports the use of MIF as a marker.
We attempted to further elucidate the role of MIF in patients
with APTB by studying the relationship between MIF and other inflammatory biomarkers. Interestingly, we observed a positive correlation between serum MIF and TNF-α levels in patients with APTB at baseline and following six months of ATD therapy; TNF-α
≥449.7 pg/mL was associated with high MIF levels (≥13.1 ng/
mL). However, a similar association was not observed for MIF and IFN-γ levels. MIF is functionally distinguished from other cytokines by its upstream immune regulatory action on immune cells [23]. The relationship between MIF and TNF-α suggests a possible role for MIF in the activation of TNF-α inflammation.
TNF-α can be secreted by multiple immune cells, including den- dritic cells, T cells, macrophages, and neutrophils [24], and has multiple functions [25, 26]. Several studies have reported that TNF-α is required for the formation and maintenance of granu- loma integrity [27-30]. This role has been suggested as an ex- Fig. 2. Serum levels of inflammatory cytokines (MIF, TNF-α, and IFN-γ) in active pulmonary tuberculosis (APTB). Patients with APTB (n= 47) at baseline and following 2, 4, and 6 months of anti-tuberculosis drug (ATD) treatment are indicated with solid lines. Serum levels of inflammatory cytokines in healthy controls at baseline (n=50) are shown with dotted lines. (A) The MIF level in patients with APTB was 17.19 (12.71–21.67) ng/mL at base- line and decreased to 14.57 (11.98–16.98) ng/mL, 9.79 (8.17–
12.35) ng/mL, and 7.84 (6.34–8.70) ng/mL following 2, 4, and 6 months of ATD therapy, respectively. (B) The TNF-α level in pa- tients with APTB was 583.6 (453.1–844.5) pg/mL at baseline and decreased to 481.6 (398.7–504.0) pg/mL, 415.5 (346.7–
454.9) pg/mL, and 374.5 (312.0–415.0) pg/mL following 2, 4, and 6 months of ATD therapy, respectively. (C) The IFN-γ level in 20
15
10
5
0 0 2 4 6
Month
MIF (ng/mL)
MIF P <0.0001 A
1,000
800
600
400
200
0 0 2 4 6
Month
TNF-α (pg/mL)
TNF-α P <0.0001 B
800
600
400
200
0 0 2 4 6
Month
IFN-γ (pg/mL)
IFN-γ P <0.0001 C
patients with APTB was 559.5 (255.0–864.0) pg/mL at baseline and decreased to 535.2 (341.2–794.0) pg/mL, 465.7 (258.3–649.9) pg/
mL, and 401.2 (227.2–574.6) pg/mL following 2, 4, and 6 months of ATD therapy, respectively. Data are presented as median values (in- terquartile range); error bars indicate standard error of means.
Abbreviation: MIF, macrophage migration inhibitory factor.
Fig. 3. Relationship between serum MIF levels and TNF-α and IFN-γ levels. Levels at baseline (A) and following 2 months (B), 4 months (C), and 6 months (D) of ATD therapy. Only the inflammatory cytokines MIF and TNF-α exhibited a statistically significant (P <0.05) Spear- man correlation coefficient value in patients with APTB at baseline and following 6 months of ATD treatment (A and D).
Abbreviation: MIF, macrophage migration inhibitory factor.
1,500
1,000
500
0
10 20 30
MIF (ng/mL)
TNF-α (pg/mL)
r=0.1103, P =0.0036 A
1,500
1,000
500
0
10 20 30
MIF (ng/mL)
IFN-γ (pg/mL)
r=0.00406, P =0.1794
1,000 800 600 400 200 0
5 10 15
MIF (ng/mL)
TNF-α (pg/mL)
r=0.00078, P =0.8538 C
1,000 800 600 400 200 0
5 10 15
MIF (ng/mL)
IFN-γ (pg/mL)
r=0.00056, P =0.8761
MIF (ng/mL) MIF (ng/mL)
600
400
200
0 5 10 15 20
TNF-α (pg/mL)
r=0.09569, P =0.0364
D 1,000
800 600 400 200
0 5 10 15 20
IFN-γ (pg/mL)
r=0.00159, P =0.7926 1,500
1,000
500
0 5 10 15 20 25
MIF (ng/mL)
TNF-α (pg/mL)
r=0.01189, P =0.4707 B
1,500
1,000
500
0 5 10 15 20 25
MIF (ng/mL)
IFN-γ (pg/mL)
r=0.00007, P =0.9566
planation for the reactivation of TB against TNF-α [29, 31, 32]
and is consistent with the theory that granulomas benefit the host by containing and controlling M.tb [26]. In fact, previous studies have demonstrated decreased production of TNF-α in patients with multidrug-resistant TB [33, 34].
Several limitations in our study merit consideration. First, the patients in our study were hospital-based and were recruited from the region of Jiangsu Province, China; thus, selection bias cannot be eliminated. Second, the quantification of cytokines in serum by ELISA may not accurately reflect the increased ex- pression of MIF in inflammation sites; therefore, these findings must be interpreted with caution. Third, TB severity, including symptoms, course of APTB, and sputum bacteriological factor, might influence the levels of some cytokines. Thus, further in- vestigation of the immune function in patients with APTB is re- quired to clarify immune pathogenesis and provide the rationale for immune-based interventions.
In conclusion, our findings indicate that a reduction in the MIF serum levels in patients with APTB following anti-TB treatment might play a positive role in host immune protection against M.tb infection. Moreover, serum MIF levels may constitute a useful marker for assessing therapy effectiveness in patients with APTB.
Authors’ Disclosures of Potential Conflicts of Interest
No potential conflicts of interest relevant to this article are re- ported.
Acknowledgements
This study was supported by research grants from the key Pro- gram of Wuxi Administration of Science & Technology, China (No.
CSE31N1510) and the research foundation of Wuxi Healthy Bu- reau, China (No. ML201310).
Author Contributions
Shou-Gang Kuai, Jun Wang and Zhong-Bo Shang analyzed the data; Qin-Fang Ou, and Yin-Yin Zhang, Hao Pei, and Li-hua Huang contributed reagents/materials/ analysis tools; and Shou-Gang Kuai, Jun Wang wrote the paper.
REFERENCES
1. Calandra T and Roger T. Macrophage migration inhibitory factor: a regu-
lator of innate immunity. Nat Rev Immunol 2003;3:791-800.
2. Gregory JL, Morand EF, Mckeown SJ, Ralph JA, Hall P, Yang YH, et al.
Macrophage migration inhibitory factor induces macrophage recruit- ment via CC chemokine ligand 2. J Immunol 2006;177:8072-79.
3. Tillmann S, Bernhagen J, Noels H. Arrest functions of the MIF ligand/re- ceptor axes in atherogenesis. Front Immunol 2013;4:115.
4. Santos LL and Morand EF. Macrophage migration inhibitory factor: a key cytokine in RA, SLE and atherosclerosis. Clin Chim Acta 2013;399:1-7.
5. Morand EF, Leech M, Bemhagen J. MIF: a new cytokine link between rheumatoid arthritis and atherosclerosis. Nat Rev Drug Discov 2006;5:
399-410.
6. Baugh JA and Bucala R. Macrophage migration inhibitory factor. Crit Care Med 2002;30:S27-35.
7. Lolis E and Bucala R. Macrophage migration inhibitory factor. Expert Opin Ther Targets 2003;7:153-64.
8. Leng L and Bucala R. Macrophage migration inhibitory factor. Critical Care Med 2005;33:S475-77.
9. Coban N, Onat A, Yildirim O, Can G, Erginelunaltuna N. Oxidative stress- mediated (sex-specific) loss of protection against type-2 diabetes by ma- crophage migration inhibitory factor (MIF)-173G/C polymorphism. Clin Chim Acta 2015;438:1-6.
10. Calandra T, Bernhagen J, Metz CN, Spiegel LA, Bacher M, Donnelly T, et al. MIF as a glucocorticoid-induced modulator of cytokine production.
Nature 1995;377:68-71.
11. Awandare GA, Martinson JJ, Were T, Ouma C, Davenport GC, Ong’echa JM, et al. MIF (macrophage migration inhibitory factor) promoter poly- morphism and susceptibility to severe malarial anemia. J Infect Dis 2009;
200:629-37.
12. Yende S, Angus DC, Kong L, Kellum JA, Weissfeld L, Ferrell R, et al. The influence of macrophage migration inhibitory factor gene polymorphism on outcome from community-acquired pneumonia. FASEB J 2009;23:
2403-11.
13. Renner P, Roger T, Bochud PY, Sprong T, Sweep FC, Bochud M, et al.
A functional microsatellite of the macrophage migration inhibitory factor gene associated with meningococcal disease. FASEB J 2012;26:907- 16.
14. Cooper AM and Khader SA. The role of cytokines in the initiation, expan- sion,and control of cellular immunity to tuberculosis. Immunol Rev 2008;
226:191-204.
15. Ameglio F, Casarini M, Capoluongo E, Mattia P, Puglisi G, Giosue S. Post- treatment changes of six cytokines in active pulmonary tuberculosis: dif- ferences between patients with stable or increased fibrosis. Int J Tuberc Lung Dis 2005;9:98-104.
16. Munk ME and Emoto M. Functions of T-cell subsets and cytokines in mycobacterial infections. Eur Respir J 1995;20:668-75.
17. Boom WH, Canaday DH, Fulton SA, Gehring AJ, Rojas RE, Torres M.
Human immunity to M. tuberculosis: T cell subsets and antigen pro- cessing. Tuberculosis 2003;83:98-106.
18. Denis M. Interferon-gamma-treated murine macrophages inhibit growth of tubercle bacilli via the generation of reactive nitrogen intermediates.
Cell Immunol 1991;132:150-7.
19. Gutierrez MG, Master SS, Singh SB, Taylor GA, Colombo MI, Deretic V.
Autophagy is a defense mechanism inhibiting BCG and Mycobacterium tuberculosis survival in infected macrophages. Cell 2004;119:753-66.
20. Jacobs M, Brown N, Allie N, Rvffel B. Fatal Mycobacterium bovis BCG infection in TNF-LT-alpha –deficient mice. Clin Immunol 2000;94:192- 99.
21. Van CR, Ottenhoff TH, Vander Meer JW. Innate immunity to Mycobacte- rium tuberculosis. Clin Microbiol Rev 2002;15:294-309.
22. White DA, Fang L, Chan W, Morand EF, Kiriazis H, Duffy SJ, et al. Pro-
inflammatory action of MIF in acute myocardial infarction via activation of peripheral blood mononuclear cells. PloS One 2013;8:e76206.
23. Llamas-Covarrubias MA, Valle Y, Bucala R, Navarro-Hernandez RE, Pal- afox-Sanchez CA, Padilla-Gutierrez JR, et al. Macrophage migration in- hibitory factor (MIF): genetic evidence for participation in early onset and early stage rheumatoid arthritis. Cytokine 2013;61:759-65.
24. Vassalli P. The pathophysiology of tumor necrosis factors. Annu Rev Im- munol 1992;10:411-52.
25. Pasparakis M, Alexopoulou L, Douni E, Kollias G. Tumour necrosis fac- tors in immune regulation: everything that’s interesting is. . .new! Cyto- kine Growth Factor Rev 1996;7:223-29.
26. Flynn JL and Chan J. Immunology of tuberculosis. Annu Rev Immunol 2001;19:93-129.
27. Berry MP, Graham CM, McNab FW, Bioch SA, Oni T, Wilkinson KA, et al. An interferon-inducible neutrophil-driven blood transcriptional signa- ture in human tuberculosis. Nature 2010;466:973-77.
28. Bean AG, Roach DR, Briscoe H, France MP, Korner H, SedqwicK JD, et al. Structural deficiencies in granuloma formation in TNF gene-targeted mice underlie the heightened susceptibility to aerosol Mycobacterium tuberculosis infection, which is not compensated for by lymphotoxin. J Immunol 1999;162:3504-11.
29. Chakravarty SD, Zhu G, Tsai MC, Mohan VP, Marino S, Kirschner DE, et
al. Tumor necrosis factor blockade in chronic murine tuberculosis en- hances granulomatous inflammation and disorganizes granulomas in the lungs. Infect Immun 2008;76:916-26.
30. Roach DR, Briscoe H, Saunders B, France MP, Riminton S, Britton WJ.
Secreted lymphotoxin-α is essential for the control of an intracellular bacterial infection. J Exp Med 2001;193:239-46.
31. Botha T and Ryffel B. Reactivation of latent tuberculosis infection in TNF- deficient mice. J Immunol 2003;171:3110-8.
32. Mohan VP, Scanga CA, Yu K, Scottd HM, Tanaka KE, Tsanq E, et al. Ef- fects of tumor necrosis factor α on host immune response in chronic per- sistent tuberculosis: possible role for limiting pathology. Infect Immun 2001;69:1847-55.
33. Smith SM, Klein MR, Malin AS, Sillah J, Mcadam KP, Dockrell HM, et al. Decreased IFN-gamma and increased IL-4 production by human CD8(+) T cells in response to Mycobacterium tuberculosis in tuberculo- sis patients. Tuberculosis 2002;82:7-13.
34. Sharma S, Sharma M, Roy S, Kumar P, Bose M. Mycobacterium tuber- culosis induces high production of nitric oxide in coordination with pro- duction of tumor necrosis factor-alpha in patients with fresh active tu- berculosis but not in MDR tuberculosis. Immunol Cell Biol 2004;82:
377-82.