I. Introduction
A gene expression profile provides a snapshot of the tran- scriptional level in a cell under specific conditions. It is widely used in biological analyses, including identification of genes that show expression patterns associated with certain phenotypes, identification of molecular markers that can be used to diagnose a disease state, and inference of the regu- latory relationships of genes corresponding to a biological process [1]. The representative way to analyze an expression profile is to identify differentially expressed genes (DEGs) or co-expressed genes related to certain phenotypes. In ad-
Drug Similarity Search Based on Combined Signatures in Gene Expression Profiles
Kihoon Cha, MS1, Min-Sung Kim, PhD2, Kimin Oh, MS1, Hyunjung Shin, PhD3, Gwan-Su Yi, PhD1
Departments of 1Bio and Brain Engineering and 2Information and Communications Engineering, Korea Advanced Institute of Science and Technology, Dae- jeon; 3Department of Industrial Engineering, Ajou University, Suwon, Korea
Objectives: Recently, comparison of drug responses on gene expression has been a major approach to identifying the func- tional similarity of drugs. Previous studies have mostly focused on a single feature, the expression differences of individual genes. We provide a more robust and accurate method to compare the functional similarity of drugs by diversifying the features of comparison in gene expression and considering the sample dependent variations. Methods: For differentially ex- pressed gene measurement, we modified the conventional t-test to normalize variations in diverse experimental conditions of individual samples. To extract significant differentially co-expressed gene modules, we searched maximal cliques among the co-expressed gene network. Finally, we calculated a combined similarity score by averaging the two scaled scores from the above two measurements. Results: This method shows significant performance improvement in comparison to other approaches in the test with Connectivity Map data. In the test to find the drugs based on their own expression profiles with leave-one-out cross validation, the proposed method showed an area under the curve (AUC) score of 0.99, which is much higher than scores obtained with previous methods, ranging from 0.71 to 0.93. In the drug networks, we could find well clus- tered drugs having the same target proteins and novel relations among drugs implying the possibility of drug repurposing.
Conclusions: Inclusion of the features of a co-expressed module provides more implications to infer drug action. We propose that this method be used to find collaborative cellular mechanisms associated with drug action and to simply identify drugs having similar responses.
Keywords: Pharmacological Biomarkers, Transcriptome, Gene Expression Regulation, Gene Regulatory Networks, Drug Re- positioning
Healthc Inform Res. 2014 January;20(1):52-60.
http://dx.doi.org/10.4258/hir.2014.20.1.52 pISSN 2093-3681 • eISSN 2093-369X
Submitted: November 15, 2013 Revised: January 24, 2014 Accepted: January 27, 2014 Corresponding Author Gwan-Su Yi, PhD
Department of Bio and Brain Engineering, Korea Advanced Institute of Science and Technology, 291, Daehak-ro, Yuseong-gu, Daejeon 305-701, Korea. Tel: +82-42-350-6160, Fax: +82-42-350-6814, E- mail: gsyi@kaist.ac.kr
This is an Open Access article distributed under the terms of the Creative Com- mons Attribution Non-Commercial License (http://creativecommons.org/licenses/by- nc/3.0/) which permits unrestricted non-commercial use, distribution, and reproduc- tion in any medium, provided the original work is properly cited.
ⓒ 2014 The Korean Society of Medical Informatics
dition, researchers can also compare expression patterns of profiles with those of other profiles. This comparison can provide an alternative way to query large-scale gene expres- sion repositories, such as the Gene Expression Omnibus and ArrayExpress, in a content based manner [2-5]. To support comparison of expression patterns, various expression simi- larity search methods have been devised.
Since the advent of the Connectivity Map [6], which pro- vides large-scale libraries of expression profiles correspond- ing to human cell lines treated with diverse small molecules, the usage of expression similarity search has been extended to drug discovery and development. The Connectivity Map also provides a comparison method to measure similarities between a query gene signature and these reference profiles.
To measure the similarity, a query gene signature comprising up- and down-regulated genes from the user is required. The Connectivity Map calculates the score of each reference pro- file by estimating whether the up-regulated genes exist at the top of the reference profile and whether the down-regulated genes exist at the bottom of the reference profile. The useful- ness of the dataset and comparison approach is proved by the performance of case studies related to drug repurposing, unveiling of the mechanism of action of uncharacterized small molecules, the mimicry of a certain biological state, etc. This innovative approach has led to the development of diverse methods to large-scale analysis of drug response pro- files [7-12]. Although these variant methods have adopted different pattern matching approaches to measure similarity, the major concept of similarity measurement, which is the use of the up- and down-regulated gene signature from the query profile, is still commonly used.
Co-expressed gene sets can be identified from drug re- sponse profiles using clustering methods [13]. In clustering, it is assumed that the expression patterns of co-expressed gene sets are correlated in all conditions. Alternatively, bi- clustering can be used to search gene sets that are correlated in a subset of the conditions [14]. Significantly perturbed or newly generated co-expressed gene sets from a drug re- sponse profile can be more appropriate to explain the expres- sion states of cells treated with a certain drug. Several studies have identified differentially co-expressed genes known to be involved in cancer, even though their expression levels were not significantly changed [15-17]. For such reasons, genes with differential co-expression patterns can be another valu- able signature to characterize drug treatment profiles in ad- dition to DEGs.
In this paper, we propose a novel method to measure the similarities between drug response profiles by combining DEGs and dilated cardiomyopathy (DCMs) simultaneously.
Our method shows significant performance improvement in comparison to other approaches in a test with Connectiv- ity Map data. We construct a drug-drug network using our method and find well clustered drugs having the same target proteins. Using the proposed method, drug-associated col- laborative cellular mechanisms can be identified as well as drugs having similar gene expression responses.
II. Methods
1. Construction of Drug Dataset
The drug response data was downloaded from the Connec- tivity Map website (http://www.broadinstitute.org/cmap/). It contains 6,100 gene expression profiles of 5 cell lines treated with 1,309 distinct small molecules. The expression profiles were grouped by batch ID, and then each group was normal- ized by robust multi-array average. After the extraction of expression values from each experiment, they were merged into a single matrix. The merged expression profiles were further processed with limma package to normalize the ex- pression intensities between different arrays using R [18].
Among the 5 cell lines, we used 3 cell lines (PC3, human prostate cancer cell lines; MCF7, human breast adenocarci- noma cell line; HL60, human promyelocytic leukemia cells) for this study because only a few experiments had been performed with the other two cell lines (SKMEL5, ssMCF7).
The small molecules measured at least 10 times were selected for this research, and 29 target drugs passed this criterion.
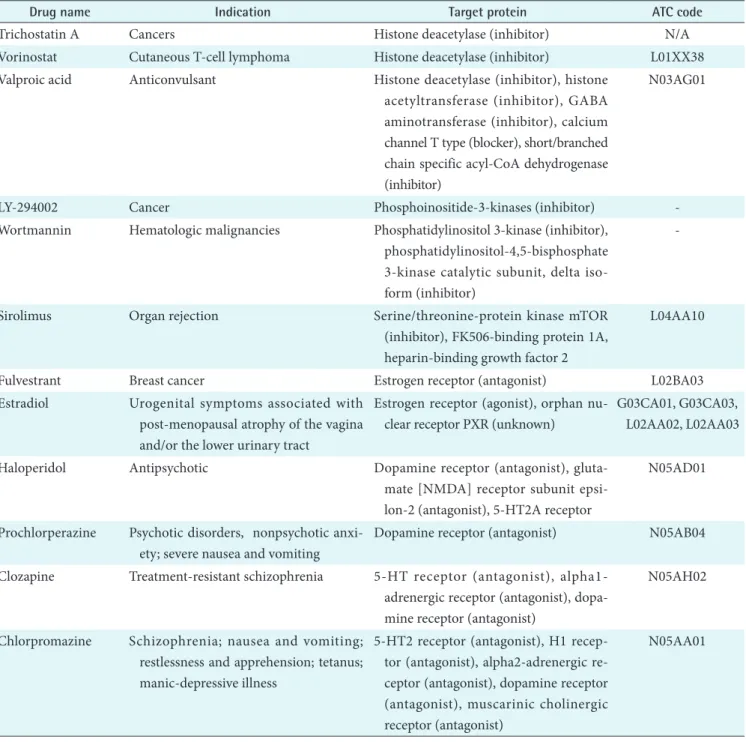
After the selection, we collected pharmaceutical informa- tion on the 29 selected drugs from drug databases. The drug information includes target proteins, the Anatomical Thera- peutic Chemical classification code, and drug indication as listed in Table 1.
As a final step, we randomly selected 10 experiments from each drug to reduce bias by the number of experiments. For instance, trichostatin A was experimented with 181 times. In contrast, metformin was measured only 10 times.
2. Construction of Previous Differential Expression Simi- larity Search Methods
For gene-level similarity analysis, 5 different methods were implemented. First, the differential expression profiles of all genes were compared by using Spearman rank correlation (CellMontage) [4]. The other 4 methods used gene signa- tures, which comprise a preselected number of top/down DEGs, extracted only from the query profile. The Connec- tivity Map uses Kolmogorov-Smirnov statistics to measure the correlation pattern of two drug response profiles. Iorio et al. [8] measured the Gene Set Enrichment Analysis score.
Cheng et al. [11] calculated the cosine similarity between two differential expression profiles that can be calculated as a dot product of two vectors. Zhang and Gant [7] devised a method that orders genes based on their absolute value of differential expression. Based on the ranking, the importance of a gene is allocated by the absolute value of its rank rather than its differential expression value. The direction of regu- lation is maintained by additionally allocating importance with the sign of its rank. Based on the reassigned query gene signature and reference expression profile, the connection strength between them is calculated.
3. Identification of Differentially Co-expressed Gene Module Signature
A co-expressed gene module, a group of genes, shows cor- related expression pattern in all samples. In comparison with the module, genes consisting of DCMs do not need to be correlated across all conditions. The genes only need to be correlated in one of two predefined conditions: control or drug treatment. Therefore, we can identify two types of DCMs. A down-correlation module is a gene group which shows correlation in control samples, and the correlation completely disappears or is significantly reduced after drug
Table 1. Pharmaceutical information of 29 selected small molecules
Drug name Indication Target protein ATC code
Trichostatin A Cancers Histone deacetylase (inhibitor) N/A
Vorinostat Cutaneous T-cell lymphoma Histone deacetylase (inhibitor) L01XX38 Valproic acid Anticonvulsant Histone deacetylase (inhibitor), histone
acetyltransferase (inhibitor), GABA aminotransferase (inhibitor), calcium channel T type (blocker), short/branched chain specific acyl-CoA dehydrogenase (inhibitor)
N03AG01
LY-294002 Cancer Phosphoinositide-3-kinases (inhibitor) -
Wortmannin Hematologic malignancies Phosphatidylinositol 3-kinase (inhibitor), phosphatidylinositol-4,5-bisphosphate 3-kinase catalytic subunit, delta iso- form (inhibitor)
-
Sirolimus Organ rejection Serine/threonine-protein kinase mTOR
(inhibitor), FK506-binding protein 1A, heparin-binding growth factor 2
L04AA10
Fulvestrant Breast cancer Estrogen receptor (antagonist) L02BA03
Estradiol Urogenital symptoms associated with post-menopausal atrophy of the vagina and/or the lower urinary tract
Estrogen receptor (agonist), orphan nu- clear receptor PXR (unknown)
G03CA01, G03CA03, L02AA02, L02AA03
Haloperidol Antipsychotic Dopamine receptor (antagonist), gluta-
mate [NMDA] receptor subunit epsi- lon-2 (antagonist), 5-HT2A receptor
N05AD01
Prochlorperazine Psychotic disorders, nonpsychotic anxi- ety; severe nausea and vomiting
Dopamine receptor (antagonist) N05AB04 Clozapine Treatment-resistant schizophrenia 5-HT receptor (antagonist), alpha1-
adrenergic receptor (antagonist), dopa- mine receptor (antagonist)
N05AH02
Chlorpromazine Schizophrenia; nausea and vomiting;
restlessness and apprehension; tetanus;
manic-depressive illness
5-HT2 receptor (antagonist), H1 recep- tor (antagonist), alpha2-adrenergic re- ceptor (antagonist), dopamine receptor (antagonist), muscarinic cholinergic receptor (antagonist)
N05AA01
treatment. In contrast, the correlation of certain genes, or an up-correlation module, can be newly generated after drug treatment. We identified DCMs which satisfy the following two conditions: 1) DCMs are composed of significantly co- expressed gene pairs in one of the two conditions and 2) the gene pairs consisting of identified modules show significant differential co-expression compared to the other condition.
The overall procedure to identify DCM signatures is illus- trated in Figure 1. To identify a significant co-expressed gene pairs in the two conditions, we measured the Pearson corre- lation coefficient (PCC) of all possible combinations of gene pairs and used them to find the distribution of correlations in each condition. In the correlation distribution, we selected the top 5% of gene pairs in the distribution and defined them Table 1. Continued
Drug name Indication Target protein ATC code
Fluphenazine Psychotic disorders Dopamine receptor (antagonist) N05AB02
Trifluoperazine Anxiety disorders, depressive symptoms secondary to anxiety and agitation
Dopamine receptor (antagonist) N05AB06 Thioridazine Schizophrenia and generalized anxiety
disorder
Dopamine receptor (antagonist) N05AC02 Tanespimycin Breast cancer, melanoma; multiple my-
eloma
Heat shock protein HSP90 (inhibitor) -
Geldanamycin - Heat shock protein HSP90 (inhibitor) -
Alvespimycin Ovarian cancer, refractory hematological malignancies; breast cancer; leukaemia
Heat shock protein HSP90 (inhibitor) -
Monorden - Heat shock protein HSP90 (inhibitor) -
Alpha-estradiol Hair loss Androgen receptor (antagonist) -
Troglitazone Type II diabetes mellitus Peroxisome proliferator-activated recep- tor gamma (agonist)
A10BG01 Rosiglitazone Type II diabetes mellitus Peroxisome proliferator-activated recep-
tor gamma (agonist)
A10BG02 Pioglitazone Type II diabetes mellitus Peroxisome proliferator-activated recep-
tor gamma (agonist)
A10BG03 Nordihydroguaiaretic
acid
- Acetyl-CoA acetyltransferase, mitochon- drial (inhibitor), arachidonate 5-lipox- ygenase (inhibitor)
-
15-delta
prostaglandin J2
- - -
Tretinoin Acute promyelocytic leukemia; photo- damage
Retinoic acid receptor (agonist) D10AD01, L01XX14 Acetylsalicylic acid Various forms of pain, inflammation Cyclooxygenase-1 (inhibitor), cyclooxy-
genase-2 (inhibitor)
A01AD05, B01AC06, N02BA01
Metformin NIDDM, polycystic ovary syndrome AMPK (activator) A10BA02
Genistein Prostate cancer DNA topoisomerase 2-alpha (inhibitor), estrogen receptor (inhibitor), estrogen receptor beta (inhibitor), peroxisome proliferator activated receptor gamma (agonist)
-
ATC code: the Anatomical Therapeutic Chemical classification code, GABA: gamma-aminobutyric acid, mTOR: mammalian target of rapamycin, PXR: pregnane X receptor, NMDA: N-methyl-D-aspartate receptor, NIDDM: non-insulin-dependent diabetes mel- litus, AMPK: AMP-activated protein kinase.
as significantly co-expressed gene pairs. Among the signifi- cant gene pairs, we further selected gene pairs which showed significant differential co-expression. For the selection, we also found the distribution of differential co-expression by measuring all possible differences of co-expressions of gene pairs in the two conditions. The top 5% of the gene pairs were assumed to be significant differential co-expression pairs. The gene pairs that satisfied the two conditions were used to form the gene differential co-expression network. In the network, each gene pair was assumed to be a seed group, and each seed group is expanded by identifying the maximal clique in the network. A maximal clique is a sub-network, the nodes of which are fully connected with all other nodes.
The detailed expansion method was performed with the following procedures. If we found a down-correlation mod- ule, the seed groups were sorted based on the co-expression value in the control samples. Among the sorted seed groups, the group with the highest co-expression value was se- lected for expansion. Based on the selected seed group, we searched neighbor genes connected to all member genes of the seed group. The distance to a neighbor was measured by averaging the co-expression values between the neighbor and member genes in the group. Among the neighbors, the gene with the highest co-expression values was selected for merging. This merging step was iteratively performed until there was no neighbor gene that was fully linked to members
of the currently expanded module. If the expansion of the selected seed group was finished, the genes included to the expanded module were removed from the sorted gene pairs.
With the remaining gene pairs, the expansion of the next seed group was iteratively performed. The identified mod- ules are maximal cliques in the gene co-expression network which comprise gene pairs that have significantly co-ex- pressed in the target condition and have a higher differential co-expression value compared to the other condition. The up-correlation module is also searched with the same pro- cedures by searching with co-expressed gene pairs in drug treatment samples. We set the minimum module size as 6 in this research.
4. Identification of Differentially Expressed Gene Signature In the Connectivity Map, the transcriptional response of each drug is measured from independent experiments vary- ing diverse conditions including different cell lines. There- fore, even though experiments are performed with the same drug, they have significantly different expression values in the control samples. The representative way to identify sig- nificantly DEGs in two different conditions is to perform a t-test. The t-test finds genes that have a slight variance of expression values in each condition and significant changes of expression values between the two conditions. The expres- sion inconsistency of each gene in control samples can ham- Figure 1. Overall procedures to mea- sure differential expression similarity. (A) identifica- tion of differentially co- expressed gene module sig- nature. (B) identification of differentially expressed gene signature. (C) Calculation combined score of the two different signatures. FDR:
false discovery rate.
57
Vol. 20 • No. 1 • January 2014 www.e-hir.org
Drug Similarity Search Using CS per the identification of DEGs using the method. Therefore,
we converted the expression value of each gene into a new value by adapting these simple formulas:
- 1 - 2
Control Drug Control Control
E E
N E
, (1)
2
Control Drug
Drug Drug
E E
N E
. (2)
UP Control Drug
DC PCC PCC , (3)
DOWN Drug Control
DC PCC PCC , (4)
1
query ref
n i i
i
DC DC
DCM n
, (5)1
N j
j
DCS DCM N
. (6)min
max min
k Sim Simk
NSim Sim Sim
. (7)
2
Module DEG
combined NSim NSim
NSim . (8)
CombinedAB
NSim and NSimCombinedBA ,
2
AB BA
AB Combined Combined
Combined NSim NSim
NSim . (9)
29 406
2
, (1)
- 1 - 2
Control Drug Control Control
E E
N E
, (1)
2
Control Drug
Drug Drug
E E
N E
. (2)
UP Control Drug
DC PCC PCC , (3)
DOWN Drug Control
DC PCC PCC , (4)
1
query ref
n i i
i
DC DC
DCM n
, (5)1
N j
j
DCS DCM
N
. (6)min
max min
k Sim Simk
NSim Sim Sim
. (7)
2
Module DEG
combined NSim NSim
NSim . (8)
CombinedAB
NSim and NSimCombinedBA ,
2
AB BA
AB Combined Combined
Combined NSim NSim
NSim . (9)
29 406
2
. (2)
Here, EControl and EDrug denote the original expression values of each drug response experiment. This simple conversion can reduce the inconsistency of expression values in control samples by shifting the original values and focusing more on the degree of differential expression values. By using the converted expression profiles, we performed a t-test with a false discovery rate (FDR) multiple testing corrections of 0.05 to the profiles. To identify significant DEGs, we extracted 100 up-regulated genes and 100 down-regulated genes with the lowest p-value.
5. Differential Expression Similarity Search with Identi- fied Gene Signature
We performed a similarity search between drug response profiles with the identified DCMs and DEGs. Before calcula- tion of the combined score of the two different signatures, the differential expression similarity based on each signa- ture was measured independently. For the calculation of the DCM-based similarity score, the modules were identified from the query profile. We calculated the differentially co- expressed gene module-based similarity score (DCS) be- tween two profiles, namely, the query profile and reference profile:
2
Control Drug Control Control
E E
N E
, (1)
2
Control Drug
Drug Drug
E E
N E
. (2)
UP Control Drug
DC PCC PCC , (3)
DOWN Drug Control
DC PCC PCC , (4)
1
query ref
n i i
i
DC DC
DCM n
, (5)1
N j
j
DCS DCM N
. (6)min
max min
k Sim Simk
NSim Sim Sim
. (7)
Module2 DEG
combined NSim NSim
NSim . (8)
CombinedAB
NSim and NSimCombinedBA ,
2
AB BA
AB Combined Combined
Combined
NSim NSim
NSim
. (9)
29 406
2
, (3)
- 1 - 2
Control Drug Control Control
E E
N E
, (1)
2
Control Drug
Drug Drug
E E
N E
. (2)
UP Control Drug
DC PCC PCC , (3)
DOWN Drug Control
DC PCC PCC , (4)
1
query ref
n i i
i
DC DC
DCM n
, (5)1
N j
j
DCS DCM N
. (6)min
max min
k k
Sim Sim NSim Sim Sim
. (7)
Module2 DEG
combined NSim NSim
NSim . (8)
CombinedAB
NSim and NSimCombinedBA ,
2
AB BA
AB Combined Combined
Combined NSim NSim
NSim
. (9)
29 406
2
, (4)
- 1 - 2
Control Drug Control Control
E E
N E
, (1)
2
Control Drug
Drug Drug
E E
N E
. (2)
UP Control Drug
DC PCC PCC , (3)
DOWN Drug Control
DC PCC PCC , (4)
1
query ref
n i i
i
DC DC
DCM n
, (5)1
N j
j
DCS DCM N
. (6)min
max min
k Sim Simk
NSim Sim Sim
. (7)
2
Module DEG
combined NSim NSim
NSim . (8)
CombinedAB
NSim and NSimCombinedBA ,
2
AB BA
AB Combined Combined
Combined NSim NSim
NSim . (9)
29 406
2
, (5)
- 1 - 2
Control Drug Control Control
E E
N E
, (1)
2
Control Drug
Drug Drug
E E
N E
. (2)
UP Control Drug
DC PCC PCC , (3)
DOWN Drug Control
DC PCC PCC , (4)
1
query ref
n i i
i
DC DC
DCM n
, (5)1
N j
j
DCS DCM N
. (6)min
max min
k Sim Simk
NSim Sim Sim
. (7)
Module2 DEG
combined NSim NSim
NSim . (8)
CombinedAB
NSim and NSimCombinedBA ,
2
AB BA
AB Combined Combined
Combined NSim NSim
NSim . (9)
292 406
. (6)
Here, DC denotes the differential co-expression value of a gene pair in a certain condition. We calculated two dif- ferent types of DCs because there are two different types of modules in the module signature, that is, an up-correlation module and down-correlation module. DCM denotes the similarity score of each module. In each module, there are n possible combinations of gene pairs. For each gene pair, we calculated the difference between the DC from the query profile and the DC from the reference profile. The DCS was
measured by averaging the score of all identified DCM sig- natures.
To calculate the DEG-based similarity score, SimDEG, we re- trieved DEGs from the query profile. We averaged the differ- ential expression values of each selected gene because there are multiple instances in the query and reference profiles.
Based on the DEGs, we measured the PCC between the que- ry profile and reference profile. After calculating two similar- ity scores, SimModule and SimDEG, we scaled them because they had different ranges of scores. We scaled each score between 0 and 1:
- 1 - 2
2
Control Drug Drug Drug
E E
N E
. (2)
UP Control Drug
DC PCC PCC , (3)
DOWN Drug Control
DC PCC PCC , (4)
1
query ref
n i i
i
DC DC
DCM n
, (5)1
N j
j
DCS DCM N
. (6)min
max min
k Sim Simk
NSim Sim Sim
. (7)
2
Module DEG
combined NSim NSim
NSim . (8)
CombinedAB
NSim and NSimCombinedBA ,
2
AB BA
AB Combined Combined
Combined NSim NSim
NSim . (9)
29 406
2
. (7)
The combined score of the two different signature-based similarity scores is defined as
- 1 - 2
2
Control Drug
Drug Drug
E E
N E
. (2)
UP Control Drug
DC PCC PCC , (3)
DOWN Drug Control
DC PCC PCC , (4)
1
query ref
n i i
i
DC DC
DCM n
, (5)1
N j
j
DCS DCM
N
. (6)min
max min
k Sim Simk
NSim Sim Sim
. (7)
2
Module DEG
combined NSim NSim
NSim . (8)
CombinedAB
NSim and NSimCombinedBA ,
2
AB BA
AB Combined Combined
Combined
NSim NSim
NSim . (9)
29 406
2
. (8)
III. Results
1. Performance Comparison of Differential Expression Similarity Search Methods
We measured the performance of several similarity search methods by calculating the area under the receiver operat- ing characteristic (ROC) curve, or the area under the curve (AUC). Figure 1 shows the overall performance of each method. For the performance estimation of previous similar- ity search methods, we used differential expression informa- tion from each instance. For the gene signature-based meth- ods, we extracted 100 up-regulated genes and 100 down- regulated genes from query instances to use them as gene signatures. After measuring the performance of previous methods, we found that there is no significant performance difference between previous similarity search methods that use differential expression information only from the input query profile. If a certain similarity search method shows good performance by allocating highly positive similarity scores between the expression profiles treated with the tar- get drug, the other methods also show good performance for the target drug. If a certain method cannot effectively find similarities between instances measured with the target drug, the others also cannot find the connections between them. These results indicate that, although the development of an effective similarity measurement method is important, the extraction of appropriate response signatures from drug response profiles was more important.
To compare our method with previous differential expres-
sion similarity search methods, multiple experiments were needed to measure co-expression between all pairs of genes and to perform a t-test for each gene. Therefore, we ran- domly selected 10 sub-experiment groups, which comprised 3 experiments, from each drug. We used all 10 experiments of each drug to infer the DCM signature and DEG signature.
We tested our similarity search method using the combined score and previous methods for the 29 selected drugs listed in Table 2. Our novel similarity search method achieved very high performance compared to previous methods as shown in Figure 2. This means that, although the DCMs and
DEGs were identified from the target drug, the extracted gene signatures can be specific features for the target drug, which can be distinguished from other drugs, in addition to common features that are fairly representative properties for target drug response profiles.
2. Construction of Drug Network
After the performance measurement, we checked whether an identified gene signature can be effectively used to find novel associations between drugs and to find instances treated with the same drug. For this purpose, we made drug-drug Table 2. Performance of expression similarity search methods for selected 29 drugs
Drug name CellMontage [4] Cheng et al. [11] Connectivity Map [6] Zhang and Gant [7] Iorio et al. [8] Combined score
15-delta prostaglandin J2 0.8953 0.9617 0.9836 0.9966 0.9993 1.0000
LY-294002 0.7304 0.8419 0.8731 0.8438 0.8941 0.9995
Acetylsalicylic acid 0.5702 0.9141 0.8859 0.9568 0.9839 1.0000
Alpha-estradiol 0.5814 0.9630 0.8927 0.9854 0.9989 1.0000
Alvespimycin 0.9452 0.9938 0.9972 0.9991 1.0000 1.0000
Chlorpromazine 0.5500 0.8172 0.7489 0.8355 0.8505 1.0000
Fulvestrant 0.5390 0.7144 0.8657 0.7593 0.8157 1.0000
Geldanamycin 0.9689 0.9942 0.9951 0.9997 1.0000 1.0000
Genistein 0.6602 0.8518 0.9529 0.9067 0.9461 1.0000
Haloperidol 0.5055 0.9233 0.9164 0.9769 0.9964 0.9999
Metformin 0.5761 0.6901 0.6872 0.7336 0.8150 1.0000
Monorden 0.8742 0.9904 0.9915 0.9958 0.9984 1.0000
Nordihydroguaiaretic acid 0.5502 0.9124 0.8709 0.9628 0.9982 0.9995
Pioglitazone 0.7254 0.8356 0.8602 0.8940 0.9273 1.0000
Prochlorperazine 0.7784 0.8932 0.8755 0.9241 0.9445 1.0000
Rosiglitazone 0.6680 0.8705 0.8165 0.8958 0.9554 1.0000
Sirolimus 0.8167 0.9301 0.9175 0.9541 0.9461 0.9995
Tanespimycin 0.9635 0.9902 0.9828 0.9996 1.0000 1.0000
Thioridazine 0.8140 0.8707 0.8770 0.8904 0.9323 1.0000
Tretinoin 0.6016 0.9265 0.8383 0.9474 0.9650 1.0000
Trifluoperazine 0.8371 0.9640 0.9546 0.9993 0.9986 0.9998
Valproic acid 0.7202 0.9284 0.8749 0.9445 0.9646 1.0000
Vorinostat 1.0000 1.0000 1.0000 1.0000 1.0000 1.0000
Wortmannin 0.8912 0.9442 0.9478 0.9662 0.9707 0.9999
Trichostatin A 0.9939 0.9998 0.9954 1.0000 1.0000 1.0000
Clozapine 0.4935 0.9452 0.8869 0.9920 1.0000 1.0000
Estradiol 0.5036 0.8451 0.8534 0.9344 0.9861 0.9998
Fluphenazine 0.7064 0.8533 0.8909 0.8854 0.9359 1.0000
Troglitazone 0.5646 0.7531 0.7173 0.8781 0.9596 1.0000
ALL 0.7095 0.8645 0.8859 0.8948 0.9305 0.9999
Drug Similarity Search Using CS
networks based on predicted similarity results among the 29 selected drugs. We calculated similarity scores based on the identified gene signature of each drug. The two similarity scores,
- 1 - 2
2
Control Drug
Drug Drug
E E
N E
. (2)
UP Control Drug
DC PCC PCC , (3)
DOWN Drug Control
DC PCC PCC , (4)
1
query ref
n i i
i
DC DC
DCM n
, (5)1
N j
j
DCS DCM
N
. (6)min
max min
k k
Sim Sim NSim Sim Sim
. (7)
2
Module DEG
combined NSim NSim
NSim . (8)
CombinedAB
NSim and NSimCombinedBA ,
2
AB BA
AB Combined Combined
Combined NSim NSim
NSim . (9)
29 406
2
and
- 1 - 2
2
Control Drug
Drug Drug
E E
N E
. (2)
UP Control Drug
DC PCC PCC , (3)
DOWN Drug Control
DC PCC PCC , (4)
1
query ref
n i i
i
DC DC
DCM n
, (5)1
N j
j
DCS DCM
N
. (6)min
max min
k k
Sim Sim NSim Sim Sim
. (7)
2
Module DEG
combined NSim NSim
NSim . (8)
CombinedAB
NSim and NSimCombinedBA ,
2
AB BA
AB Combined Combined
Combined NSim NSim
NSim . (9)
29 406
2
, have different values because their query signatures are different from each other.
Therefore, from the Equation (9), we defined the similarity score given to drugs A and B as in previous research [8]:
- 1 - 2
Control Drug Control Control
E E
N E
, (1)
2
Control Drug Drug Drug
E E
N E
. (2)
UP Control Drug
DC PCC PCC , (3)
DOWN Drug Control
DC PCC PCC , (4)
1
query ref
n i i
i
DC DC
DCM n
, (5)1
N j
j
DCS DCM N
. (6)min
max min
k Sim Simk
NSim Sim Sim
. (7)
2
Module DEG
combined NSim NSim
NSim . (8)
AB Combined
NSim and NSimCombinedBA ,
2
AB BA
AB Combined Combined
Combined NSim NSim
NSim . (9)
29 406
2
. (9)
After the similarity measurement, we could get
- 1 - 2
Control Drug Control Control
E E
N E
, (1)
2
Control Drug Drug Drug
E E
N E
. (2)
UP Control Drug
DC PCC PCC , (3)
DOWN Drug Control
DC PCC PCC , (4)
1
query ref
n i i
i
DC DC
DCM n
, (5)
1
N j
j
DCS DCMN
. (6)
min
max min
k Sim Simk
NSim Sim Sim
. (7)
2
Module DEG
combined NSim NSim
NSim . (8)
AB Combined
NSim and NSimBACombined,
2
AB BA
AB Combined Combined
Combined NSim NSim
NSim . (9)
29 406 2
pairwise distances. To estimate the significance threshold for the distances, we used the empirical probability distribution function of these distances as in previous research [8]. In this research, we chose the significance threshold value as the up- per bound of 10% of the empirical probability distribution.
After filtering the pairwise distances using this threshold, we drew drug networks from the predicted similarities between drugs as illustrated in Figure 3. We grouped 25 drugs based on their target proteins. There were five target groups includ- ing 18 drugs. Those five groups of drugs are well clustered in this similarity network. Seven round-shaped drugs which have heterogeneous targets are scattered in the network.
Some connections found in this similarity network between drugs for different known targets may imply the possibility of drug repositioning.
IV. Discussion
We introduced a novel computational method for similarity search of drug response profiles. The main idea of our meth-
od is the use of combined signatures of DCMs and DEGs.
Integrating co-expressed gene modules can be more robust for various datasets with various numbers of samples and diverse conditions. The method was evaluated using search- ing experiments with data obtained from a profile library of cell lines treated with the same drug and identifying known drug groups that share the same pharmaceutical action. We demonstrated the high performance of our method with a 0.99 AUC score for searching the same drug by combined signature.
Drug repositioning is possible using the connection be- tween drugs. Therefore, we predicted a drug-drug network to reveal the association between drugs. Although valproic acid is an anticonvulsant drug, it is associated with vorino- stat and the same target protein. Thus, valproic acid can be a valuable drug for cutaneous T-cell lymphoma after clinical testing. Moreover, association between drugs can indicate a novel target. In our network, nordihydroguaiaretic acid targeting Acetyl-CoA acetyltransferase is similar to thiorida- zine, trifluoperazine, fluphenazine, and haloperidol targeting dopamine receptors. Therefore, we can infer that nordihy- droguaiaretic acid has a novel target, dopamine receptors.
There were several limitations of our study. We used drug response profiles from the Connectivity Map. These profiles were obtained from only 5 cancer cell lines. It is limited in precisely measuring drug response profiles in relation to other diseases except several cancers. Therefore, it is neces- sary to investigate the drug response of disease-associated cell lines. For instance, to identify similar drugs for diabetes mellitus drugs, we need the drug response profiles in diabe- tes mellitus-associated cell lines, such as liver or adipocyte cell lines. Moreover, the number of samples for most drugs Figure 2. Predicted drug-drug net-
work of selected 29 drugs.
in drug response profiles is small. We only used the 29 se- lected drugs with more than 10 samples because DCMs need to calculate correlation in sufficient samples. Finally, we ex- pected that response profiles using protein expression show better results than those using mRNA expression.
Conflict of Interest
No potential conflict of interest relevant to this article was reported.
Acknowledgments
This work was supported by the National Research Founda- tion of Korea grant funded by the Korea government (No.
2010-0028631). This research was supported by the Bio &
Medical Technology Development Program of the National Research Foundation funded by the Korean government (2012048758).
References
1. Qu XA, Rajpal DK. Applications of Connectivity Map in drug discovery and development. Drug Discov Today 2012;17(23-24):1289-98.
2. Engreitz JM, Morgan AA, Dudley JT, Chen R, Thathoo R, Altman RB, et al. Content-based microarray search using differential expression profiles. BMC Bioinformat- ics 2010;11:603.
3. Le HS, Oltvai ZN, Bar-Joseph Z. Cross-species que- ries of large gene expression databases. Bioinformatics 2010;26(19):2416-23.
4. Fujibuchi W, Kiseleva L, Taniguchi T, Harada H, Horton P. CellMontage: similar expression profile search server.
Bioinformatics 2007;23(22):3103-4.
5. Vazquez M, Nogales-Cadenas R, Arroyo J, Botias P, Gar- cia R, Carazo JM, et al. MARQ: an online tool to mine GEO for experiments with similar or opposite gene expression signatures. Nucleic Acids Res 2010;38(Web Server issue):W228-32.
6. Lamb J, Crawford ED, Peck D, Modell JW, Blat IC, Wrobel MJ, et al. The Connectivity Map: using gene- expression signatures to connect small molecules, genes,
and disease. Science 2006;313(5795):1929-35.
7. Zhang SD, Gant TW. A simple and robust method for connecting small-molecule drugs using gene-expression signatures. BMC Bioinformatics 2008;9:258.
8. Iorio F, Bosotti R, Scacheri E, Belcastro V, Mithbaokar P, Ferriero R, et al. Discovery of drug mode of action and drug repositioning from transcriptional responses. Proc Natl Acad Sci U S A 2010;107(33):14621-6.
9. Shigemizu D, Hu Z, Hung JH, Huang CL, Wang Y, DeLisi C. Using functional signatures to identify repo- sitioned drugs for breast, myelogenous leukemia and prostate cancer. PLoS Comput Biol 2012;8(2):e1002347.
10. Williams G. A searchable cross-platform gene expres- sion database reveals connections between drug treat- ments and disease. BMC Genomics 2012;13:12.
11. Cheng J, Xie Q, Kumar V, Hurle M, Freudenberg JM, Yang L, et al. Evaluation of analytical methods for con- nectivity map data. Pac Symp Biocomput 2013:5-16.
12. Pacini C, Iorio F, Goncalves E, Iskar M, Klabunde T, Bork P, et al. DvD: an R/Cytoscape pipeline for drug repurpos- ing using public repositories of gene expression data. Bio- informatics 2013;29(1):132-4.
13. Yun T, Hwang T, Cha K, Yi GS. CLIC: clustering analysis of large microarray datasets with individual dimension- based clustering. Nucleic Acids Res 2010;38(Web Server issue):W246-53.
14. Yun T, Yi GS. Biclustering for the comprehensive search of correlated gene expression patterns using clustered seed expansion. BMC Genomics 2013;14:144.
15. Lai Y, Wu B, Chen L, Zhao H. A statistical method for identifying differential gene-gene co-expression pat- terns. Bioinformatics 2004;20(17):3146-55.
16. Carter SL, Brechbuhler CM, Griffin M, Bond AT. Gene co-expression network topology provides a framework for molecular characterization of cellular state. Bioinfor- matics 2004;20(14):2242-50.
17. Kostka D, Spang R. Finding disease specific alterations in the co-expression of genes. Bioinformatics 2004;20 Suppl 1:i194-9.
18. Smyth GK, Michaud J, Scott HS. Use of within-array rep- licate spots for assessing differential expression in micro- array experiments. Bioinformatics 2005;21(9):2067-75.