lic hospitals are less competitive than those of private hospi- tals. The adoption rates of Electronic Medical Record (EMR) systems in Korean hospitals in 2012 were the following:
87.5% for tertiary hospitals, 71.7% for general hospitals, and 72.9% for hospitals [1]. However, the adoption rates of pub- lic hospitals were much lower than those of private hospitals [2]. As public hospitals play important roles in providing medical and preventive services to low income patients, the Korean government has begun to disseminate newly devel- oped EMR-based information systems to public hospitals as of 2012 to strengthen their service capacity.
New information systems (IS) for public hospitals included a computerized provider order entry (CPOE) system, EMR, admission-discharge-transfer (ADT) system, lab system, a picture archive and communication system (PACS), a cus- tomer relationship management (CRM) system, activity- based costing (ABC) system, and data warehouse.
Performance Evaluation of Public Hospital Information Systems by the Information System Success Model
Kyoung Won Cho, PhD1, Sung-Kwon Bae, PhD1, Ji-Hye Ryu, MPH1, Kyeong Na Kim, MPH1, Chang-Ho An, MPH2, Young Moon Chae, PhD3
1Department of Healthcare Administration, Kosin University, Busan; 2The Korea Association of Regional Public Hospital, Seoul; 3Graduate School of Public Health, Yonsei University, Seoul, Korea
Objectives: This study was to evaluate the performance of the newly developed information system (IS) implemented on July 1, 2014 at three public hospitals in Korea. Methods: User satisfaction scores of twelve key performance indicators of six IS success factors based on the DeLone and McLean IS Success Model were utilized to evaluate IS performance before and after the newly developed system was introduced. Results: All scores increased after system introduction except for the complete- ness of medical records and impact on the clinical environment. The relationships among six IS factors were also analyzed to identify the important factors influencing three IS success factors (Intention to Use, User Satisfaction, and Net Benefits). All relationships were significant except for the relationships among Service Quality, Intention to Use, and Net Benefits. Conclu- sions: The results suggest that hospitals should not only focus on systems and information quality; rather, they should also continuously improve service quality to improve user satisfaction and eventually reach full the potential of IS performance.
Keywords: Electronic Medical Records, Information Systems, Evaluation Studies
Healthc Inform Res. 2015 January;21(1):43-48.
http://dx.doi.org/10.4258/hir.2015.21.1.43 pISSN 2093-3681 • eISSN 2093-369X
Submitted: December 29, 2014 Revised: January 26, 2015 Accepted: January 26, 2015 Corresponding Author Young Moon Chae, PhD
Graduate School of Public Health, Yonsei University, 50 Yonsei-ro, Seodaemun-gu, Seoul 120-752, Korea. Tel: +82-2-2228-1505, Fax:
+82-2-392-7734, E-mail: [email protected]
This is an Open Access article distributed under the terms of the Creative Com- mons Attribution Non-Commercial License (http://creativecommons.org/licenses/by- nc/3.0/) which permits unrestricted non-commercial use, distribution, and reproduc- tion in any medium, provided the original work is properly cited.
ⓒ 2015 The Korean Society of Medical Informatics
I. Introduction
The Korean health delivery system is heavily dominated by the private sector. The facilities and manpower of most pub-
The government has taken a cautious approach to dissemi- nating the new IS by selecting public hospitals which met the following criteria: strong top management support, stable financial status, sufficient IS budget, and sufficient demands for IS (high ratio of outpatients/beds). In addition, the gov- ernment evaluated the performance of the IS based on the key performance indicators (KPI), such as user satisfaction and reduction in medication errors and personnel costs, be- fore disseminating it to other hospitals.
This study is a part of a government project to evaluate the performance of the new IS in public hospitals that have im- plemented the system. The performance of the IS was evalu- ated based on the DeLone and McLean IS Success Model [3], which subdivides success measures into six distinct factors:
System Quality, Information Quality, Service Quality, Inten- tion to Use, User Satisfaction, and Net Benefits. Several pre- vious studies have evaluated hospital information systems based on the DeLone and McLean model. Van Der Meijden et al. [4] examined the determinants of success of inpatient clinical information systems according to the DeLone and McLean framework. Park et al. [5] analyzed the performance of the information systems in 38 hospitals by using the De- Lone and McLean model, and they found that both System Quality and Information Quality significantly influenced User Satisfaction. Pai and Huang [6] used path analysis for the structured equation model (SEM) to analyze how three quality factors (system, information, and service) influence perceptions of the healthcare information system in terms
of usefulness, perceived ease-of-use, and intention to use.
They found that three quality factors influenced intention to use through the mediating factors (perceived ease-of- use and perceived usefulness). While Intention to Use is an important success factor, the relationships among IS success should be analyzed by focusing on Net Benefits as outcome factors and using three quality factors as input factors and Intention to Use and User Satisfaction as mediating factors, as suggested by DeLone and McLean for performance evalu- ation of hospital information systems.
The purpose of this study was to evaluate the performance of the newly developed IS in three public hospitals (Andong, Taegu, and Pohang) that introduced the system in order to determine whether the system was effective in improving user satisfaction and reducing medication errors and per- sonnel costs. Specifically, the KPI satisfaction scores for six IS success factors based on the DeLone and McLean model were compared before and after system introduction. In addition, the relationships among the six IS success factors were analyzed by using path analysis for the SEM in order to identify the important factors influencing three IS success factors (Intention to Use, User Satisfaction, and Net Benefits).
II. Methods
1. Subject
To examine the changes in the KPI satisfaction scores in six IS success factors, two surveys were conducted 171, 225, and
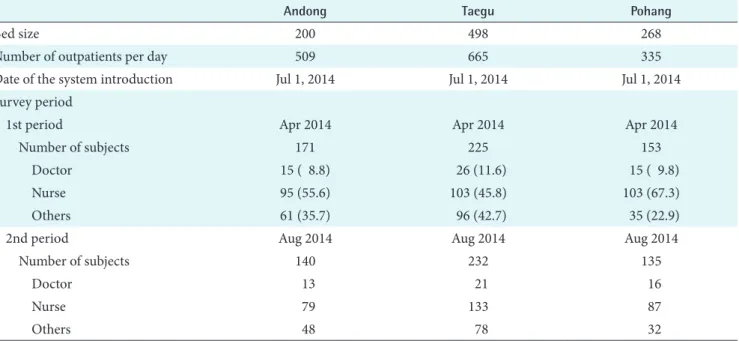
Table 1. Characteristics of study hospitals
Andong Taegu Pohang
Bed size 200 498 268
Number of outpatients per day 509 665 335
Date of the system introduction Jul 1, 2014 Jul 1, 2014 Jul 1, 2014
Survey period
1st period Apr 2014 Apr 2014 Apr 2014
Number of subjects 171 225 153
Doctor 15 ( 8.8) 26 (11.6) 15 ( 9.8)
Nurse 95 (55.6) 103 (45.8) 103 (67.3)
Others 61 (35.7) 96 (42.7) 35 (22.9)
2nd period Aug 2014 Aug 2014 Aug 2014
Number of subjects 140 232 135
Doctor 13 21 16
Nurse 79 133 87
Others 48 78 32
Values are presented as number (%).
153 users prior to using the system and 140, 232, and 135 users after having experienced the system at three hospitals (Andong, Taegu, and Pohang), as seen in Table 1.
2. Analytic Methods
1) Comparison of key performance indicators before and after system introduction
Based on the DeLone and McLean framework, user satis- faction scores of twelve KPIs for six IS success factors were compared before and after system introduction by using the t-test: System Quality (response time, user friendly screen design, and security and privacy), Information Quality (completeness of medical record, accessibility of clinical in- formation), Service Quality (improved medical service, im- proved business process), Intention to Use, User Satisfaction (impact of system on organization, improved clinical envi- ronment), and Net Benefits (reduction in personnel costs, reduction in medication errors).
2) Relationships among IS success factors assessed by the structural equation model and reliability testing
The relationships among IS success factors were analyzed by SEM, which is a statistical technique for testing and estimat- ing causal relations using a combination of statistical data and qualitative causal assumptions [4]. SEM allows confir- matory modeling which starts out with a hypothesis that is represented in a causal model.
Reliability means the extent to which a measuring instru- ment contains variable errors, that is, errors that appear inconsistently between observations either during any one measurement procedure or each time a given variable is measured by the same instrument. To test for the reliabili- ties of factors in the SEM model, composite reliability (CR) was used based on the procedures outlined by Fornell and Larcker [7]. The reliability was acceptable if the CR was 0.70 or higher. The internal consistency reliability of KPIs in six IS success factors were assessed by Cronbach’s α. The in- ternal consistency is acceptable if Cronbach’s α exceeds 0.6 [8]. SPSS21 and AMOS18 were used for the t-test and path analysis for the SEM.
III. Results
1. Comparison of Key Performance Indicators for IS Success Factors Before and After System Introduction The satisfaction scores for three KPIs (response time, user friendly design, and security and privacy) of System Quality all increased after the system was implemented at all hospi- Table 2. K
ey performance indicators of IS success factors for three public hospitals Success factorAttributeAndongTaeguPohang 1st2ndp-value1st2ndp-value1st2ndp-value System QualityResponse time3.033.040.912.903.030.132.852.980.17 User friendly design3.463.460.953.263.290.763.083.070.87 Security & privacy3.223.470.013.193.250.392.933.150.02 Information QualityCompleteness of medical record3.623.560.053.383.570.083.393.300.30 Access to clinical information3.333.460.143.343.510.022.963.300.00 Service QualityImproved patient service 3.313.470.053.333.380.433.033.300.00 Improved business process 3.323.700.003.383.460.222.903.420.00 Intention to UseIntention to use3.673.750.343.403.710.003.543.560.78 User SatisfactionImproved organization3.323.640.003.353.370.753.033.290.00 Improved medical services3.433.530.233.383.340.643.043.270.01 Net BenefitsReduction in personnel costs3.273.420.103.123.190.322.943.160.03 Reduction in medication error3.193.380.043.133.270.063.093.170.35 IS: information system.
tals (Table 2). Specifically, the scores for security and privacy significantly increased after system introduction at the An- dong and Taegu hospitals. The KPI satisfaction scores for two Information Quality factors (completeness of medical record and accessibility of clinical information) showed inconsistent results. While the scores for completeness of medical record significantly increased after system introduction at the Taegu hospital, those of the other two hospitals slightly decreased after system introduction. The KPI satisfaction scores for accessibility of clinical information increased at all hospi- tals after system introduction. Two KPI satisfaction scores regarding Service Quality (improved service quality and improved quality of business process) improved after system introduction. In particular, the scores for both service qual- ity KPIs significantly increased after system introduction at the Pohang hospital. Scores for Intention to Use increased af- ter system introduction for all hospitals. Scores for two KPIs
(impact of system on organization and improved clinical environment) of User Satisfaction increased for the Andong and Pohang hospitals, but the scores for improved clinical environment at the Taegu hospital slightly decreased after system introduction. Finally, the two KPI satisfaction scores for net benefits (reduction in personnel costs and medica- tion errors), which is the system outcome, all increased after system introduction at all hospitals.
2. Relationships among IS Success Factors Assessed by the Structural Equation Model
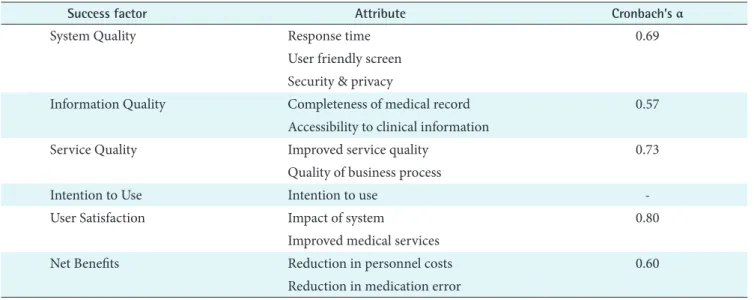
An SEM analysis was conducted to confirm the hypoth- esized relationships that were identified by the DeLone and McLean model. As shown in Table 3, Cronbach’s α exceeded the acceptable value of 0.6 for internal consistency except for Information Quality (0.57). This indicates that the success factors were reasonably reliable in terms of internal consis-
Table 3. Reliability of information system success factors
Success factor Attribute Cronbach’s α
System Quality Response time 0.69
User friendly screen Security & privacy
Information Quality Completeness of medical record 0.57
Accessibility to clinical information
Service Quality Improved service quality 0.73
Quality of business process
Intention to Use Intention to use -
User Satisfaction Impact of system 0.80
Improved medical services
Net Benefits Reduction in personnel costs 0.60
Reduction in medication error
Table 4. Standardized estimates for information system success factors
β SE CR p-value
System Quality → Intention to Use 0.135 0.056 2.390 0.017
Information Quality → Intention to Use 0.374 0.061 6.122 <0.001
Service Quality → Intention to Use 0.114 0.059 1.903 0.057
System Quality → User Satisfaction 0.180 0.032 5.647 <0.001
Information Quality → User Satisfaction 0.135 0.035 3.881 <0.001
Service Quality → User Satisfaction 0.607 0.036 16.909 <0.001
Intention to Use → Net Benefits -0.002 0.033 -0.048 0.962
User Satisfaction → Net Benefits 0.961 0.051 18.938 <0.001
β: path coefficient, SE: standard error, CR: composite reliability.
Absolute fit measures χ2/df = 1.872.
tency.
The CR of the success factors all exceeded the acceptable value (CR>0.7) for reliability, and the χ²/df value was 1.872, which was less than the acceptable value of 2.0 (Table 4).
This suggests that the SEM was a good fit of the internal structure of the model.
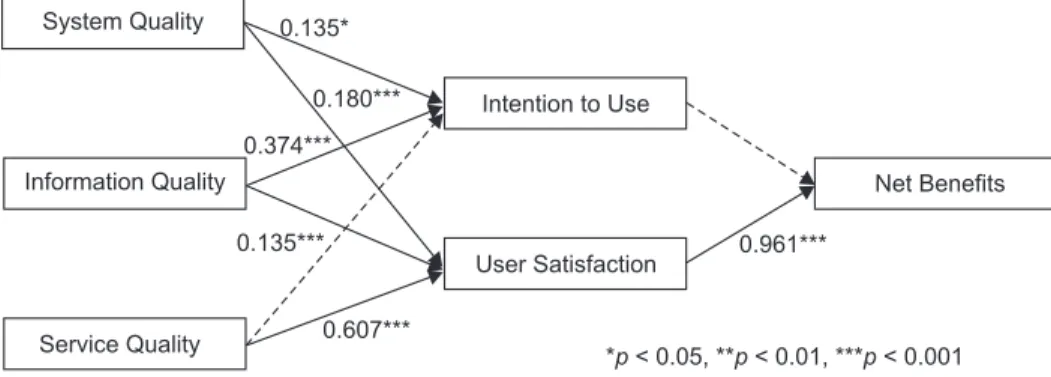
In Figure 1, the solid line shows the sets of quality indica- tors that significantly (at 5% significance level) contributed to User Satisfaction, and the dotted line related to Intention to Use shows a statistically insignificant relationship to net benefits. Specifically, System Quality significantly affected Intention to Use with the path coefficient (or standardized coefficient) β of 0.135 and User Satisfaction with β of 0.180.
Information Quality also significantly affected intention to use with β of 0.374 and User Satisfaction with β of 0.135.
However, Service Quality did not significantly affect Inten- tion to Use. It only significantly affected User Satisfaction with β of 0.607. Intention to Use did not significantly affect Net Benefits, but User Satisfaction significantly affected net benefits.
The SEM results showed that the three quality measures had a significant linkage to the most widely used success measure, that is, user satisfaction and the intended IS output net benefits. In particular, User Satisfaction had the largest effect on net benefits. However, Service Quality, Intention to Use, and Net Benefits did not have significant linkage.
IV. Discussion
This study evaluated the performance of a newly developed EMR-based information system for three public hospitals by examining the changes in satisfaction scores for twelve KPIs of six success factors based on the DeLone and McLean IS Success Model. Most of the KPI satisfaction scores increased after system introduction. This is in line with the findings of previous studies [4,5]. Kaushal et al. [9] also found that the CPOE system significantly reduced medication errors.
However, the satisfaction scores for completeness of medi-
cal record and impact on medical services did not increase for some hospitals after system introduction. This is possibly due to the fact that doctors, the primary users of the new system, comprised less than 10% of the total respondents in both surveys and the fact that users did not have enough time to experience the system.
This study also examined the effects of system functions of the newly developed information system (System Quality, Information Quality, and Service Quality) on satisfaction factors (Intention to Use and User Satisfaction) and Net Benefits by using the DeLone and McLean model. We found that all three quality factors had a significant influence on User Satisfaction and that User Satisfaction strongly influ- enced Net Benefits. The results suggest that hospitals should not only focus on systems and information quality; rather, they should also continuously improve Service Quality to improve User Satisfaction and eventually reach the full po- tential of IS performance. The results are also consistent with the findings of previous studies. The system quality indicator of user friendly design was a significant factor influencing user satisfaction in the studies conducted by Park et al. [5]
and Kim et al. [10]. Pai and Huang [6] also found that when users felt more satisfied with the service quality of healthcare information systems, their satisfaction with usefulness in- creased.
While System Quality and Information Quality were both significant factors influencing Intention to Use, Service Quality did not have significant linkage with Intention to Use and Net Benefits. This may be due to the fact that the second survey was conducted only one month after system implementation; thus, users did not have enough time to de- cide whether they intended to use the system or not.
This study has a couple of limitations. First, User Satisfac- tion, which is the key indicator in IS evaluation, is a mea- surement of system users’ perception. Therefore, there is a possibility of the indicator being subjective. Many studies have mentioned that quantifying measured factors is difficult when evaluating the outcomes of information systems. Fur-
* < 0.05, ** < 0.01, *** < 0.001p p p System Quality
InformationQuality
ServiceQuality
Net Benefits Intention to Use
User Satisfaction 0.135*
0.180***
0.374***
0.135***
0.607***
0.961***
Figure 1. Structural equation model for information system suc- cess factors.
thermore, the second survey was conducted only one month after the system was introduced in three hospitals; therefore, users did not have enough time to experience the system.
For the results to be more applicable, the performance of the system should be evaluated again six months after its imple- mentation by using the above results as baseline data.
Conflict of Interest
No potential conflict of interest relevant to this article was reported.
Acknowledgments
This research was supported by the “Performance evaluation program of information systems for the regional public hos- pitals” funded by the Ministry of Health and Welfare.
References
1. Cho I, Choi WJ, Choi WH, Kim MK. The adoptions and use of electronic nursing records in Korean hospitals:
findings of a nationwide survey. J Korean Clin Nurs Res 2013;19(3):345-56.
2. Chae YM, Yoo KB, Kim ES, Chae H. The adoption of electronic medical records and decision support systems in Korea. Healthc Inform Res 2011;17(3):172-7.
3. DeLone WH, McLean ER. The DeLone and McLean
model of information systems success: a ten-year update.
Journal of Manag Inf Syst 2003;19(4):9-30.
4. Van Der Meijden MJ, Tange HJ, Troost J, Hasman A.
Determinants of success of inpatient clinical informa- tion systems: a literature review. J Am Med Inform As- soc 2003;10(3):235-43.
5. Park J, Chae YM, Lee YT, Cho K, Kim J, Lee BH. Evalu- ation of CDSS for drug prescriptions based on success measures. J Korean Soc Med Inform 2009;15(3):293- 301.
6. Pai FY, Huang KI. Applying the Technology Acceptance Model to the introduction of healthcare information sys- tems. Technol Forecast Soc Change 2011;78(4):650-60.
7. Fornell C, Larcker DF. Evaluating structural equation models with unobservable variables and measurement error. J Mark Res 1981;18(1):39-50.
8. Chin WW. The partial least squares approach to struc- tural equation modeling. In: Marcoulides GA, editor.
Modern methods for business research. Mahwah (NJ):
Lawrence Erlbaum; 1998. p. 295-336.
9. Kaushal R, Shojania KG, Bates DW. Effects of computer- ized physician order entry and clinical decision support systems on medication safety: a systematic review. Arch Intern Med 2003;163(12):1409-16.
10. Kim J, Chae YM, Kim S, Ho SH, Kim HH, Park CB. A study on user satisfaction regarding the clinical decision support system (CDSS) for medication. Healthc Inform Res 2012;18(1):35-43.