Arousal and Valence Classification Model Based on Long Short-Term Memory and DEAP Data for Mental Healthcare Management
Eun Jeong Choi, MS1, Dong Keun Kim, PhD2
1Department of Computer Science, Graduate School, Sangmyung University, Seoul, Korea; 2Department of Intelligent Engineering Informatics for Human, College of Convergence Engineering, Sangmyung University, Seoul, Korea
Objectives: Both the valence and arousal components of affect are important considerations when managing mental health- care because they are associated with affective and physiological responses. Research on arousal and valence analysis, which uses images, texts, and physiological signals that employ deep learning, is actively underway; research investigating how to improve the recognition rate is needed. The goal of this research was to design a deep learning framework and model to clas- sify arousal and valence, indicating positive and negative degrees of emotion as high or low. Methods: The proposed arousal and valence classification model to analyze the affective state was tested using data from 40 channels provided by a dataset for emotion analysis using electrocardiography (EEG), physiological, and video signals (the DEAP dataset). Experiments were based on 10 selected featured central and peripheral nervous system data points, using long short-term memory (LSTM) as a deep learning method. Results: The arousal and valence were classified and visualized on a two-dimensional coordinate plane. Profiles were designed depending on the number of hidden layers, nodes, and hyperparameters according to the er- ror rate. The experimental results show an arousal and valence classification model accuracy of 74.65 and 78%, respectively.
The proposed model performed better than previous other models. Conclusions: The proposed model appears to be effec- tive in analyzing arousal and valence; specifically, it is expected that affective analysis using physiological signals based on LSTM will be possible without manual feature extraction. In a future study, the classification model will be adopted in mental healthcare management systems.
Keywords: Arousal and Valence Analysis, Supervised Machine Learning, Classification, Machine Learning, DEAP Dataset
Healthc Inform Res. 2018 October;24(4):309-316.
https://doi.org/10.4258/hir.2018.24.4.309 pISSN 2093-3681 • eISSN 2093-369X
Submitted: August 21, 2018
Revised: 1st, October 10, 2018; 2nd, October 19, 2018 Accepted: October 22, 2018
Corresponding Author Dong Keun Kim, PhD
Department of Intelligent Engineering Informatics for Human, College of Convergence Engineering, Sangmyung University, 20, Hongjimun 2-gil, Jongno-gu, Seoul 03016, Korea. Tel: +82-2-2287-5431, E-mail: [email protected] (https://orcid.org/0000-0002-8397-4649)
This is an Open Access article distributed under the terms of the Creative Commons Attribution Non-Commercial License (http://creativecommons.org/licenses/by-nc/4.0/) which permits unrestricted non-commercial use, distribution, and reproduction in any medium, provided the original work is properly cited.
ⓒ 2018 The Korean Society of Medical Informatics
I. Introduction
Recent advances in artificial intelligence technologies, such as deep learning, have resulted in the rapid development of the field, and hence in new research opportunities [1,2].
While the support of stable mental healthcare needs to be considered, the focus is on automated mental state detection, which is a complex phenomenon with both affective and physiological responses. Although regulation of emotion is a difficult concept, arousal and valence recognition studies have been undertaken to provide an understanding of affec- tive experiences using physiological signals, such as such as electrocardiography (ECG), photoplethysmography (PPG), and electroencephalography (EEG) [3-5]. In addition, some studies about early mental stress detection using physiologi- cal signals have been performed in the mental healthcare domain [6-9]. On the other hand, with significant advances in machine learning technologies, such as deep learning, artificial intelligence methods can be applied to improve the efficiency of emotion recognition. Recently, deep learning methods have been applied in the processing of physiologi- cal signals, such as EEG and skin resistance. The results were comparable to those of conventional methods [10-12].
In this study, a dataset for emotion analysis obtained from an EEG, physiological, and video signals database (DEAP) was used to conduct an emotion classification experiment to validate the efficacy of the deep learning-based approach.
The database is the largest, most comprehensive physiologi- cal signal emotion dataset publicly available. The goal of this study was to design an LTSM-based emotion classification model using EEG, galvanic skin response (GSR), and PPG signal data that can classify arousal (which indicates strength of emotion) and valence (which indicates positive and nega- tive degree of emotion) as high or low. The DEAP dataset provides data for 10 channels—namely, for 8 EEG chan- nels as well as single channels of GSR and PPG—to analyze emotional states. Then the accuracy of the emotion analysis presented in this paper is assessed by comparing it with the previous studies of Wang and Shang [11], which classifies emotions based on the deep belief network (DBN), which conducts learning by probabilistic judgment using signals of four channels as input data in the DEAP dataset from the central nervous system.
The remainder of this paper is organized as follows. In Section II, a brief overview of both emotion recognition and deep learning for emotion recognition is provided. The experimental design aspects of long short-term memory (LSTM)-based emotion recognition using physiological sig-
nals are discussed in Section II. The simulated and experi- mental schemes and their results are described in Section III.
Finally, the conclusions are summarized in Section IV.
1. Emotion Recognition Using Physiological Signals As previously mentioned, methods for emotion detection us- ing physiological signals have been extensively investigated and have provided encouraging results where the affective states are directly related to changes in bodily signals [13,14].
For the central nervous system (CNS), EEG is a useful tech- nique to study emotion variance. The brain’s response to var- ious stimuli is usually measured by dividing the EEG signals into different frequency rhythms, namely, delta (0.5–4 Hz), theta (4–8 Hz), beta (16–32 Hz), and gamma (32 Hz and above). These band waves are omnipresent in various parts of the brain [15]. In addition, among peripheral systems, autonomic nervous system (ANS) activity is considered a major component of an emotional response because the physiological signals based on ANS activity are very descrip- tive and easy to measure [13-15]. Pulse waves result from periodic pulsations in the blood volume, and are measured by the changes in optical absorption that they induce [16- 19]. Changes in the amplitudes of PPG signals are related to the level of tension in an individual. GSR signals can be an indicator of the autonomic activity of physiological arousal, which varies with the moisture level of the skin.
Emotion refers to the human being’s complex emotional state that is changed by external factors [20,21]. Russell [22]
classified human emotions into two dimensions: arousal rep- resents the strength of emotions in the degree of arousal and relaxation, while valence represents the degree of positivity and negativity.
Among the many emotion models, we adopted Russell’s model [22], where the two dimensions are represented by a vertical arousal and a horizontal valence axes.
2. Long Short-Term Memory
Deep learning in neural networks comprises decomposition of networks into multiple layers of processing with the aim of learning multiple levels of abstraction [5]. LSTM is one of the deformation models of an RNN that is used to overcome its long-term dependency problem. LSTM is particularly useful for sequential data, such as time series data [23].
LSTM solves the long-term dependency by installing three gates, which are used for input and output of the memory space; these are the input gate, forget gate, and output gate.
Each of the three gates determines how much of the input value will be reflected, how much of the current value is to
be forgotten, and whether or not to display the calculation up to present [24].
II. Methods
This section describes the data used in the experiment, the model, and the experimental method.
The first step in mapping physiological signals to emo- tions is to extract some features from raw signal data—for instance, analyzing the heart rate variability (HRV), which is equivalent to the response of the nervous system of the physiological signal with R-R intervals. These features are usually hand-engineered using task-dependent techniques developed by domain experts [13,25-27] and selected by ex- perts or feature selection algorithms. However, in this study, we overcame these disadvantages by adopting the LSTM model, which allows automatic feature selection through the learning and training process.
1. DEAP Dataset
DEAP is a multimodal dataset for the analysis of human af- fective states [12]. The EEG and peripheral physiological signals (down sampled to 128 Hz), including the horizon-
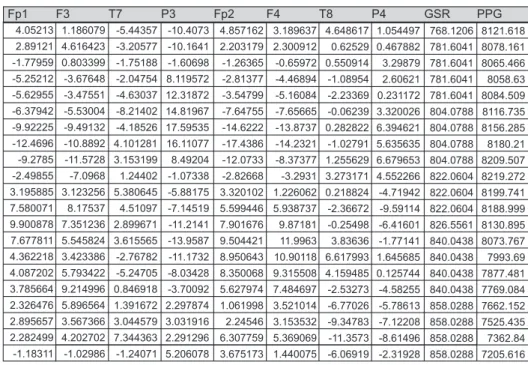
tal electrooculogram (hEOG), vertical electrooculogram (vEOG), zygomaticus major electromyogram (zEMG), tra- pezius major electromyogram (tEMG), GSR, respiration belt data, plethysmogram, and body temperature, of 32 subjects were recorded as each subject watched 40 one-minute long videos. The subjects rated the levels as continuous values of arousal, valence, liking, dominance, and familiarity. The structure of the DEAP dataset is shown in Table 1 and Figure 1. Figure 1 shows a small part of the DEAP dataset used as the input data. Also, Figure 1 shows the input data consisting of 10 channels’ physiological signals.
As a reference [13,14], we selected a PPG signal, a GSR sig- nal, and 8-channel EEG signals of the frontal lobe (Fp1, Fp2, F3, F4) that are responsible for the high level of cognitive, emotional, and mental functions; temporal lobes (T7, T8) responsible for the auditory area; and the occipital lobes (P3, P4) responsible for the auditory area of the 32-channel EEG signals. Only data with a length of 60 seconds (128 Hz × 60), excluding the initial 3 seconds (128 Hz × 3) corresponding to the baseline of the total data length of each signal (128 Hz
× 63 seconds), were used in the experiment. For each sub- ject, arousal and valence were evaluated in successive values from 1 to 9. A result of less than 5 was set to 0, while a result
Figure 1. Example of the DEAP dataset.
Fp1 F3 T7 P3 Fp2 F4 T8 P4 GSR PPG
4.05213 2.89121 -1.77959 -5.25212 -5.62955 -6.37942 -9.92225 -12.4696 -9.2785 -2.49855 3.195885 7.580071 9.900878 7.677811 4.362218 4.087202 3.785664 2.326476 2.895657 2.282499 -1.18311
1.186079 4.616423 0.803399 -3.67648 -3.47551 -5.53004 -9.49132 -10.8892 -11.5728 -7.0968 3.123256 8.17537 7.351236 5.545824 3.423386 5.793422 9.214996 5.896564 3.567366 4.202702 -1.02986
-5.44357 -3.20577 -1.75188 -2.04754 -4.63037 -8.21402 -4.18526 4.101281 3.153199 1.24402 5.380645 4.51097 2.899671 3.615565 -2.76782 -5.24705 0.846918 1.391672 3.044579 7.344363 -1.24071
-10.4073 -10.1641 -1.60698 8.119572 12.31872 14.81967 17.59535 16.11077 8.49204 -1.07338 -5.88175 -7.14519 -11.2141 -13.9587 -11.1732 -8.03428 -3.70092 2.297874 3.031916 2.291296 5.206078
4.857162 2.203179 -1.26365 -2.81377 -3.54799 -7.64755 -14.6222 -17.4386 -12.0733 -2.82668 3.320102 5.599446 7.901676 9.504421 8.950643 8.350068 5.627974 1.061998 2.24546 6.307759 3.675173
3.189637 2.300912 -0.65972 -4.46894 -5.16084 -7.65665 -13.8737 -14.2321 -8.37377 -3.2931 1.226062 5.938737 9.87181 11.9963 10.90118 9.315508 7.484697 3.521014 3.153532 5.369069 1.440075
4.648617 0.62529 0.550914 -1.08954 -2.23369 -0.06239 0.282822 -1.02791 1.255629 3.273171 0.218824 -2.36672 -0.25498 3.83636 6.617993 4.159485 -2.53273 -6.77026 -9.34783 -11.3573 -6.06919
1.054497 0.467882 3.29879 2.60621 0.231172 3.320026 6.394621 5.635635 6.679653 4.552266 -4.71942 -9.59114 -6.41601 -1.77141 1.645685 0.125744 -4.58255 -5.78613 -7.12208 -8.61496 -2.31928
768.1206 781.6041 781.6041 781.6041 781.6041 804.0788 804.0788 804.0788 804.0788 822.0604 822.0604 822.0604 826.5561 840.0438 840.0438 840.0438 840.0438 858.0288 858.0288 858.0288 858.0288
8121.618 8078.161 8065.466 8058.63 8084.509 8116.735 8156.285 8180.21 8209.507 8219.272 8199.741 8188.999 8130.895 8073.767 7993.69 7877.481 7769.084 7662.152 7525.435 7362.84 7205.616
Table 1. Structure of the DEAP dataset
Array name Array shape Array contents
Data 40 × 40 × 8064 (Video/trial) × channels × data (128 Hz × 63 seconds) Labels 40 × 4 (Video/trial) × label (valence, arousal, dominance, liking)
greater than or equal to 5 was set to 1 and used as output data (labels). The input and output data were stored as sepa- rate files, each of which was divided into 40 files for each participant. The total number of files was 1,280 (participant
× video). Of the 1,280 experimental data files, 1,024 files (representing 80% of the total data, from the 1st to the 32nd participants’ 40-channel signal files) were used to train the model, and 256 files (representing 20% of the data, from the
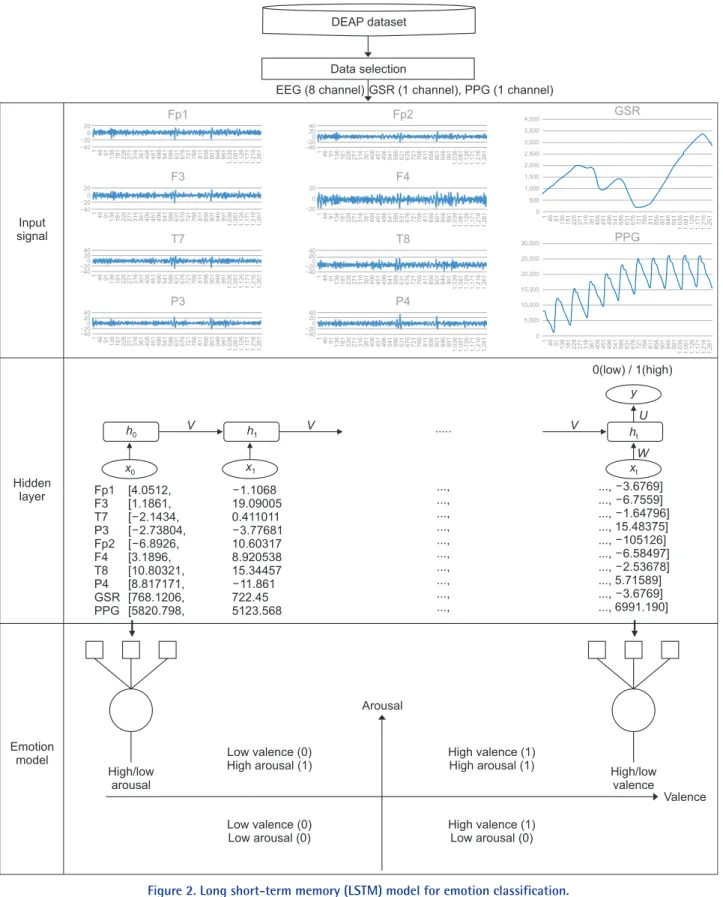
Figure 2. Long short-term memory (LSTM) model for emotion classification.
DEAP dataset
Data selection
EEG (8 channel) GSR (1 channel), PPG (1 channel)
Input signal
Fp1
20 0 20
401 46 91 136 181226 271 316 361 406 451 496 541 586 631676 721 766 811 856 901 946 991 1,036 1,0811,126 1,171 1,216 1,261
F3
20 0 20
401 46 91 136 181226 271 316 361 406 451 496 541 586 631676 721 766 811 856 901 946 991 1,036 1,0811,126 1,171 1,216 1,261
T7
1 46 91 136 181226 271 316 361 406 451 496 541 586 631676 721 766 811 856 901 946 991 1,036 1,0811,126 1,171 1,216 1,261
P3
1 46 91 136 181226 271 316 361 406 451 496 541 586 631676 721 766 811 856 901 946 991 1,036 1,0811,126 1,171 1,216 1,261
Fp2
40 200 20
401 46 91 136 181 226 271 316361 406 451 496 541 586 631 676 721 766811 856 901 946 991 1,036 1,081 1,126 1,171 1,2161,261
F4
20 0
201 46 91 136 181 226 271 316361 406 451 496 541 586 631 676 721 766811 856 901 946 991 1,036 1,081 1,126 1,171 1,2161,261
T8
4020 200
401 46 91 136 181 226 271 316361 406 451 496 541 586 631 676 721 766811 856 901 946 991 1,036 1,081 1,126 1,171 1,2161,261
P4
4020 200
401 46 91 136 181 226 271 316361 406 451 496 541 586 631 676 721 766811 856 901 946 991 1,036 1,081 1,126 1,171 1,2161,261
4,000 3,500 3,000 2,500 2,000 1,500 1,000 500 0
GSR
1 46 91 136181 226 271 316 361 406 451 496 541 586631 676 721 766 811 856 901 946 991 1,0361,081 1,126 1,171 1,216 1,261
30,000 25,000 20,000 15,000 10,000 5,000
0 1 46 91 136181 226 271 316 361 406 451 496 541 586631 676 721 766 811 856 901 946 991 1,0361,081 1,126 1,171 1,216 1,261 4020
0 2040
4020 200 40
h0
x0
V h1
x1
V ...
y
ht xt U
W 0(low) / 1(high)
V
Fp1 F3 T7 P3 Fp2 F4 T8 P4 GSR PPG
[4.0512, [1.1861, [ 2.1434, [ 2.73804, [ 6.8926, [3.1896, [10.80321, [8.817171, [768.1206, [5820.798,
1.1068 19.09005 0.411011 3.77681 10.60317 8.920538 15.34457 11.861 722.45 5123.568
..., ..., ..., ..., ..., ..., ..., ..., ..., ...,
..., 3.6769]
..., 6.7559]
..., 1.64796]
..., 15.48375]
..., 105126]
..., 6.58497]
..., 2.53678]
..., 5.71589]
..., 3.6769]
..., 6991.190]
Hidden layer
Emotion model
Arousal
High/low arousal
High/low valence
Valence Low valence (0)
High arousal (1)
High valence (1) High arousal (1)
Low valence (0) arousal (0) Low
High Low
valence (1) arousal (0)
PPG
33rd to the 40th participants’ 40-channel signal files) were used to evaluate the performance of the model.
2. LSTM-Based Emotion Classification Model
The structure of the proposed LSTM-based emotion clas- sification model using the central nervous system signals and autonomic nervous system signal is shown in Figure 2.
In the hidden layer of Figure 2, x0, x1,…, xt represent the 8 EEG signals of the central nervous system, the autonomic nervous system GSR signal, and the PPG signal, which are physiological signals of 10 channels used as input data. The state values h0, h1,…, ht of the hidden layer, determined from the input data, are those in which the result of the previous signal affects the current signal. In addition, a forget gate (․) was installed between the hidden layer nodes to determine how much of the current value should be forgotten. The out- put value y is communicated only once at the end, since the degrees of arousal and valence are classified into two catego- ries of low and high. Therefore, weights W, V and U are cal- culated for each physiological signal with sequence and out- put values of low or high that are generated. The output data of the proposed emotion classification model was the result of evaluating the degree of arousal and valence between 1 and 9 in the DEAP dataset. Since the performance of the model depends on the numbers of layers and nodes and the hyperparameters, we evaluated its accuracy by varying each parameter. Accuracy is a measure of how precise the model is based on the evaluation criteria. The ratio of prediction—
true positive (TP) and true negative (TN)—is expressed as accuracy (%). We tried to improve the performance of the proposed emotion classification model. The experiments were conducted using Deeplearning4j written for Java and Scala in a Window 10 environment. We installed CUDA 8.0 to use the GPU, and managed the project library by install- ing the build automation tool Apache Maven [27].
III. Results
1. The Designed LSTM Model
The accuracy results of the arousal and valence classification models, according to the hyperparameter setting values ap- plied to the LSTM, are shown in Tables 1 and 2, respectively.
We modified the hyperparameter more than 30 times based on the setup method that can give the best learning result.
Thus, only the top four results from each hyperparameter are shown in Tables 2 and 3.
Settings 1, 2 and 3 in Table 2 show the process of setting the hyperparameter value of the arousal classification model, and the numbers of layers and nodes. Settings 3 and 4 are part of the process of setting the hyperparameters with a fixed number of layers and nodes. The accuracy of the mod- el differs according to the value of the forget gate bias. If the learning rate is too low, the speed of the algorithm is slowed down, and the learning cannot be completed before the point at which the cost function is minimized. On the other hand, if the learning rate is too high, overshooting can occur without the minimum value being reached [28].
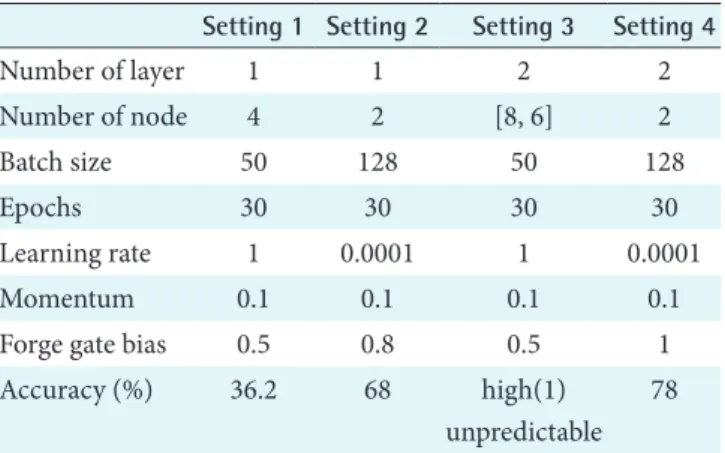
Settings 1, 2 and 3 in Table 3 show the process of setting the hyperparameter value of the valence classification model, and the numbers of layers and nodes. Settings 3 and 4 are part of the process of setting the hyperparameter with a fixed number of layers. As the result of Setting 3, if the neural net- work becomes larger, the number of parameters increases.
Thus, the performance of the algorithm may be lowered.
Therefore, Setting 3 is not predictable when the degree of valence is high (1).
2. Experimental Results
We classified the values of arousal and valence through the proposed LSTM model as low (0) and high (1). Thereafter,
Table 2. Performance comparison of the arousal classification model by hyperparameter setting
Setting 1 Setting 2 Setting 3 Setting 4
Number of layer 1 1 2 2
Number of node 6 4 [6, 4] 4
Batch size 64 128 64 128
Epochs 30 30 30 30
Learning rate 0.1 0.5 0.1 1
Momentum 0.1 0.7 0.1 1
Forge gate bias 1 1 0.6 1
Accuracy (%) 62.5 68.12 33 74.65
Table 3. Performance comparison of the valence classification model by hyperparameter setting
Setting 1 Setting 2 Setting 3 Setting 4
Number of layer 1 1 2 2
Number of node 4 2 [8, 6] 2
Batch size 50 128 50 128
Epochs 30 30 30 30
Learning rate 1 0.0001 1 0.0001
Momentum 0.1 0.1 0.1 0.1
Forge gate bias 0.5 0.8 0.5 1
Accuracy (%) 36.2 68 high(1)
unpredictable 78
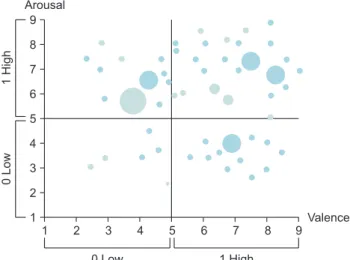
we arranged the results of the physiological data as the values of arousal and valence between 1 and 9. Figure 3 shows the distribution of the classification results using a two-dimen- sional coordinate plane with the arousal and valence axes. In Figure 3, darker color of the circles represents greater density of arousal or valence data in coordinates. Larger size of the circles indicates that accumulation of frequency of arousal or valence data.
Figure 4 shows the accuracy of the arousal classification model and the valence classification model; the LSTM- based valence classification model using physiological sig- nals showed 78% accuracy. In the experiment, the proposed arousal classification model had 2 layers, 4 nodes, 128 batch sizes, and a learning rate, momentum, and forget gate bias of 1, 1, and 1, respectively. The number of iterations was set to 8. As a result, the LSTM-based arousal classification model using physiological signals showed 74.65% accuracy.
In addition, the proposed valence classification model had 2 layers, 2 nodes, 128 batch sizes, and a learning rate, momen-
tum, and forget gate bias of 0.0001, 0.1, and 1, respectively.
The number of iterations was set to 7. As a result, the LSTM- based valence classification model using physiological sig- nals showed 78% accuracy. Figure 5 compares the accuracy of the model developed in this study to that of Wang and Shang [11]. As shown in Figure 5, although emotion classifi- cation is very personal and variable, in comparison with the results of other studies, each of the results is more than 20%
better than those of previous studies.
IV. Discussion
In this paper, we proposed an arousal and valence classifi- cation model based on LSTM using physiological signals obtained from the DEAP dataset for mental healthcare management. The performance of the emotion classifica- tion model depends on the number of layers, nodes, and hyperparameters. If the neural network becomes too large, it is important to find the appropriate number of layers and nodes due to the increase in the number of parameters.
Although, there were some limitations of the study, such as the lack of comparison with other classification methods, such as non-deep learning technique classification models, including naïve Bayesian, decision tress, and support vector machine and so on. To improve the accuracy of the arousal and valence status classification results, more systematic profile generation including hyperparameter settings will be performed in a future study.
1. Comparison with Other Previous Research
When the optimized parameters are set by these criteria, the proposed arousal and valence classification models based on LSTM achieve 74.65% and 78% accuracy, respectively. In addition, the performance of the proposed emotion classi- fication model proposed is compared with the performance
Arousal 100
90 80 70 60 50 40 30 20 10
%
0
Valence
72.66 73.05
Figure 4. The accuracy results of the arousal classification and valence classification model.
Arousal 100
90 80 70 60 50 40 30 20 10
%
0
Valence 60.9
51.2
72.66 73.05
Wang and Shang [11]
Proposed method
Figure 5. Accuracy comparison of emotion classification models.
1 9 8 7 6 5 4 3 2
1 Valence
1High0Low
9
2 3 4 5 6 7 8
0 Low 1 High
Arousal
Figure 3. Experimental results using a coordinate plane.
of the emotion classification model proposed by Wang and Shang [11], who classified the degree of arousal, valence, and liking based on DBN by using autonomic nervous system signals (hEOG, vEOG, zEMG, tEMG) of four channels as input data from the DEAP dataset. In that work, the classifi- cation accuracies for arousal, valence, and liking were 60.9%, 51.2%, and 68.4%, respectively. In this paper, only the de- grees of arousal and valence were classified; therefore, only the classification accuracy of arousal and valence were com- pared. Practically, the results of the LSTM model proposed in this paper achieved higher accuracy for arousal (1.99%) and valence (4.95%) than those of a previous study by Song [29], in which the arousal accuracy was 72.66%, and the va- lence accuracy was 73.05%.
Thus, we confirmed that the LSTM-based emotion clas- sification model using the central nervous system and auto- nomic nervous system signals is more suitable for classifying emotions than the DBN-based emotion classification model using autonomic nervous system signals. Those results indi- cate that the designed classification model has tremendous potential to facilitate and enhance personal mental health- care if it is adopted in mental health management systems, such as mobile or web-based applications. It can support individuals managing their own mental health, and it can be used in clinical care systems to enhance existing treatment processes, such as medical examination through interviews.
2. Conclusion
In this paper, we proposed an emotion classification model based on LSTM using central and autonomic nervous system signals obtained from the DEAP dataset.
It has been confirmed that, according to the situation or purpose, emotion classification is possible based on the LSTM, which extracts features from the time series data by itself using the central and autonomic nervous system signals. The model can quantitatively measure and analyze emotion without reflecting subjective judgment. Therefore, it is expected that emotion analysis using physiological sig- nals based on LSTM will be possible without processing. In a future study, the classification model will be adopted in mental healthcare management systems.
Conflict of Interest
No potential conflict of interest relevant to this article was reported.
Acknowledgments
This work was supported by the Industrial Strategic Technol- ogy Development Program (No. 10073159, Developing mir- roring expression based interactive robot technique by non- contact sensing and recognizing human intrinsic parameter for emotion healing through heart-body feedback) funded by the Ministry of Trade, Industry & Energy, Korea. This research was also supported by Basic Science Research Pro- gram through the National Research Foundation of Korea (NRF) funded by the Ministry of Education (No. 2017R1D- 1A1B03035606).
References
1. Salamon N, Grimm JM, Horack JM, Newton EK. Ap- plication of virtual reality for crew mental health in extended-duration space missions. Acta Astronaut 2018;146:117-22.
2. Valmaggia LR, Latif L, Kempton MJ, Rus-Calafell M.
Virtual reality in the psychological treatment for mental health problems: an systematic review of recent evi- dence. Psychiatry Res 2016;236:189-95.
3. Faust O, Hagiwara Y, Hong TJ, Lih OS, Acharya UR.
Deep learning for healthcare applications based on physiological signals: a review. Comput Methods Pro- grams Biomed 2018;161:1-13.
4. Zhang Q, Chen X, Zhan Q, Yang T, Xia A. Respiration- based emotion recognition with deep learning. Comput Ind 2017;92-93:84-90.
5. Yin Z, Zhao M, Wang Y, Yang J, Zhang J. Recognition of emotions using multimodal physiological signals and an ensemble deep learning model. Comput Methods Pro- grams Biomed 2017;140:93-110.
6. Haeyen S, van Hooren S, van der Veld WM, Hutsche- maekers G. Promoting mental health versus reducing mental illness in art therapy with patients with person- ality disorders: a quantitative study. Arts Psychother 2018;58:11-6.
7. Zhang L, Kong M, Li Z. Emotion regulation difficulties and moral judgement in different domains: the media- tion of emotional valence and arousal. Pers Individ Dif 2017;109:56-60.
8. Healey J, Picard RW. Detecting stress during real-world driving tasks using physiological sensors. IEEE trans In- tell Transp Syst 2005;6(2):156-66.
9. Xia L, Malik AS, Subhani AR. A physiological signal- based method for early mental-stress detection. Biomed
Signal Process Control 2018;46:18-32.
10. Lee D, Kim JH, Jung WH, Lee HJ, Lee SG. The study on EEG based emotion recognition using the EMD and FFT. Proceedings of the HCI Society of Korea; 2013 Jan 30-Feb 1; Jeongseon, Korea. p. 127-30.
11. Wang D, Shang Y. Modeling physiological data with deep belief networks. Int J Inf Educ Technol 2013;3(5):505-11.
12. DEAPdataset: a dataset for emotion analysis using EEG, physiological and video signal [Internet]. London:
Queen Mary University of London; c2017 [cited at 2018 Oct 1]. Available from: http://www.eecs.qmul.ac.uk/
mmv/datasets/deap.
13. Kim J, Andre E. Emotion recognition based on physi- ological changes in music listening. IEEE Trans Pattern Anal Mach Intell 2008;30(12):2067-83.
14. Kreibig SD. Autonomic nervous system activity in emo- tion: a review. Biol Psychol 2010;84(3):394-421.
15. Collet C, Vernet-Maury E, Delhomme G, Dittmar A.
Autonomic nervous system response patterns specificity to basic emotions. J Auton Nerv Syst 1997;62(1-2):45- 57.
16. Ryoo DW, Kim YS, Lee JW. Wearable systems for ser- vice based on physiological signals. Conf Proc IEEE Eng Med Biol Soc 2005;3:2437-40.
17. Jerritta S, Murugappan M, Nagarajan R, Wan K. Physi- ological signals based human emotion recognition: a review. Proceedings of 2011 IEEE 7th International Colloquium on Signal Processing and its Applications (CSPA); 2001 Mar 4-6; Penang, Malaysia. p. 410-5.
18. Chang CY, Zheng JY, Wang CJ. Based on support vector regression for emotion recognition using physiologi- cal signals. Proceedings of the 2010 International Joint Conference on Neural Networks (IJCNN); 2010 Jul 18- 23; Barcelona, Spain. p. 1-7.
19. Kim JH, Whang MC, Kim YJ, Woo JC. The study on
emotion recognition by time dependent parameters of autonomic nervous response. Korean J Sci Emot Sensib 2008;11:637-44.
20. Vogt T, Andre E. Improving automatic emotion recog- nition from speech via gender differentiation. Proceed- ings of Language Resources and Evaluation Conference (LREC); 2006 May 24-26; Genoa, Italy.
21. Mill A, Allik J, Realo A, Valk R. Age-related differences in emotion recognition ability: a cross-sectional study.
Emotion 2009;9(5):619-30.
22. Russell JA. A circumplex model of affect. J Pers Soc Psy- chol 1980;39(6):1161-78.
23. Kwon SJ. Sentiment analysis of movie reviews using the Word2vec and RNN [Master's thesis]. Seoul, Korea:
Dongguk University; 2009.
24. TensorFlow. Recurrent neural network [Internet]. [place unknown]: TensorFlow; c2018 [cited at 2018 Oct 1].
Available from: https://www.tensorflow.org/tutorials/
sequences/recurrent.
25. Chanel G, Kierkels JJ, Soleymani M, Pun T. Short-term emotion assessment in a recall paradigm. Int J Hum Comput Stud 2009;67(8):607-27.
26. Rainville P, Bechara A, Naqvi N, Damasio AR. Basic emotions are associated with distinct patterns of cardio- respiratory activity. Int J Psychophysiol 2006;61(1):5-18.
27. Deeplearning4j [Internet]. Ottawa, Canada: Eclipse Foundation; c2018 [cited at 2018 Oct 1]. Available from https://deeplearning4j.org/about.
28. Machine learning: learning rate, data processing, over- fitting [Internet]. [place unknown: publisher unknown];
c2017 [cited at 2018 Oct 1]. Available from http://copy- code.tistory.com/166.
29. Song SH. The emotion analysis based on long short term memory using the central and autonomic nervous system signals [Master's thesis]. Seoul, Korea: Sang- myung University; 2018.