D I A B E T E S & M E T A B O L I S M J O U R N A L
This is an Open Access article distributed under the terms of the Creative Commons Attribution Non-Commercial License (http://creativecommons.org/licenses/by-nc/4.0/) which permits unrestricted non-commercial use, distribution, and reproduction in any medium, provided the original work is properly cited.
Factors Related to Blood Intact Incretin Levels in Patients with Type 2 Diabetes Mellitus
Soyeon Yoo1,2, Eun-Jin Yang1, Gwanpyo Koh1,2
1Department of Internal Medicine, Jeju National University School of Medicine, Jeju,
2Department of Internal Medicine, Jeju National University Hospital, Jeju, Korea
Background: We performed this study to identify factors related to intact incretin levels in patients with type 2 diabetes mellitus (T2DM).
Methods: We cross-sectionally analyzed 336 patients with T2DM. Intact glucagon-like peptide 1 (iGLP-1) and intact glucose-de- pendent insulinotropic polypeptide (iGIP) levels were measured in a fasted state and 30 minutes after ingestion of a standard mixed meal. The differences between 30 and 0 minute iGLP-1 and iGIP levels were indicated as ∆iGLP-1 and ∆iGIP.
Results: In simple correlation analyses, fasting iGLP-1 was positively correlated with glucose, C-peptide, creatinine, and triglycer- ide levels, and negatively correlated with estimated glomerular filtration rate. ∆iGLP-1 was positively correlated only with ∆C- peptide levels. Fasting iGIP showed positive correlations with glycosylated hemoglobin (HbA1c) and fasting glucose levels, and negative correlations with ∆C-peptide levels. ∆iGIP was negatively correlated with diabetes duration and HbA1c levels, and posi- tively correlated with ∆glucose and ∆C-peptide levels. In multivariate analyses adjusting for age, sex, and covariates, fasting iGLP- 1 levels were significantly related to fasting glucose levels, ∆iGLP-1 levels were positively related to ∆C-peptide levels, fasting iGIP levels were related to fasting C-peptide levels, and ∆iGIP levels were positively related to ∆C-peptide and ∆glucose levels.
Conclusion: Taken together, intact incretin levels are primarily related to C-peptide and glucose levels. This result suggests that glycemia and insulin secretion are the main factors associated with intact incretin levels in T2DM patients.
Keywords: Diabetes mellitus, type 2; Gastric inhibitory polypeptide; Glucagon-like peptide 1; Intact incretin
Corresponding author: Gwanpyo Koh https://orcid.org/0000-0002-6020-2777 Department of Internal Medicine, Jeju National University School of Medicine, 15 Aran 13-gil, Jeju 63241, Korea
E-mail: [email protected]
INTRODUCTION
Incretin is a hormone that is secreted from the intestine within minutes after food intake and stimulates pancreatic β-cells to produce insulin, which leads to postprandial glucose stabiliza- tion. Glucagon-like peptide 1 (GLP-1) and glucose-dependent insulinotropic polypeptide (GIP) are two principal incretin hormones that are secreted from L-cells in the ileum and K- cells in the duodenum and jejunum, respectively [1]. Both in- cretins are responsible for 50% to 70% of the postprandial in- sulin secretion in healthy people. This incretin effect falls to
<20% in patients with type 2 diabetes mellitus (T2DM) [2,3].
Either reduced insulinotropic efficacy or reduced secretion of
incretin can be attributable to the reduced incretin effect in T2DM patients [4,5]. In T2DM, the impaired insulinotropic action of incretin is more pronounced in GIP than in GLP-1 [2]. Those impaired insulinotropic efficacies may be secondary to a general impairment in β-cell function rather than a specif- ic defect in incretin action [6]. In T2DM, meal related GLP-1 secretion have been found to be deficient compared with nor- mal state in some studies [7,8], whereas GIP levels are found to be relatively normal in the majority of studies [7-9]. In fasting state, small study reported decreased fasting level of GLP-1 in T2DM patients compared with normal state [10]. It has also been reported that some metabolic markers are related to in- cretin concentrations in T2DM patients. Two recent meta- https://doi.org/10.4093/dmj.2018.0105
pISSN 2233-6079 · eISSN 2233-6087
analyses suggested that the deterioration of glycemic control (glycosylated hemoglobin [HbA1c]) is associated with reduced GLP-1 and GIP secretions [11,12], and that high body mass index (BMI) is associated with increased GIP secretion, but in- creasing age is associated with reduced GIP responses [11].
Alssema et al. [13] reported that GIP response was positively related to triglyceride levels.
Intact incretin, a biologically active form of incretin, is de- graded by the enzyme dipeptidyl peptidase-4 (DPP-4) to inac- tive metabolite shortly after its secretion [14]. This inactive form accounts for a substantial part of total incretin. The total form of incretin reflects its secretion from enteroendocrine cells, whereas intact incretin reflects its action on glucose-in- duced insulin secretion [15]. Incretin-based drugs that in- crease circulating intact incretin level or mimic the action of intact GLP-1 (iGLP-1) have now emerged as important tools in the treatment of T2DM [16]. Thus, intact incretin is a target in the current strategy for the treatment of T2DM. Consider- ing the insulinotropic action of intact incretin, it can be as- sumed that there is some relationship between glucose, insulin, and intact incretin levels. However, only a few studies have in- vestigated the determinants or factors associated with intact incretin levels in T2DM patients.
Here, we measured iGLP-1 and intact GIP (iGIP) levels be- fore and after ingestion of a standard mixed meal in patients with T2DM. Then we cross-sectionally analyzed the relation- ships between intact incretin levels and various clinicobio- chemical variables including glycemic parameters.
METHODS
Subjects
This cross-sectional study included 336 patients with T2DM who admitted to the Diabetic Clinic at the Endocrinology De- partment of Jeju National University Hospital, South Korea.
Patients with stage 4 chronic kidney disease (estimated glo- merular filtration rate [eGFR] <30 mL/min), those with liver cirrhosis and ascites, and those with infectious or inflammato- ry disease were excluded. Patients receiving any DPP-4 inhibi- tor or GLP-1 receptor agonist, which may influence plasma in- cretin levels, were also excluded. The present study was con- ducted in compliance with the Declaration of Helsinki and was approved by the Institutional Review Board of Jeju National University Hospital (IRB No. JEJUNUH 2017-02-008). In ad- dition, written consent explaining the purpose and methods of
the present study was provided to all the subjects.
Study procedure
Blood samples were collected after night fasting (over 8 hours) in heparinized tubes to measure glucose, HbA1c, C-peptide, total cholesterol, triglyceride, high density lipoprotein choles- terol (HDL-C), low density lipoprotein cholesterol (LDL-C), alanine aminotransferase (ALT), and creatinine levels. Fasting iGLP-1 and iGIP levels were measured from blood samples that were stored in chilled ethylenediaminetetraacetic acid (EDTA) tubes, to which aprotinin (250 KIU/mL blood; Sigma- Aldrich, St Louis, MO, USA) and DPP-4 inhibitor (10 μL/mL blood; Merck Millipore, Darmstadt, Germany) were added.
Subsequently, the subjects were provided a standard mixed meal (480 kcal; carbohydrate: protein: fat=2.8:1:1). The stan- dard mixed meal consisted of boiled rice, soup, three side dish- es, and kimchi, and the ratio of the nutrients was always kept constant. The subjects were asked to complete their meal with- in 20 minutes. Additional blood samples were collected 30 minutes after the start of meal in heparinized tubes to measure glucose and C-peptide levels, and post-meal iGLP-1 and iGIP levels were measured from blood samples in chilled EDTA tubes, to which aprotinin and DPP-4 inhibitor were added. The EDTA tubes containing the blood were immediately stored in ice pouches and then centrifuged. The separated plasma were stored at –20°C, until iGLP-1 and iGIP levels were analyzed.
The differences between glucose, C-peptide, iGLP-1, and iGIP levels at 30 minutes after the meal and the corresponding fast- ing values were indicated as incremental glucose (∆glucose), C-peptide (∆C-peptide), iGLP-1 (∆iGLP-1), and iGIP (∆iGIP) levels, respectively.
Data on age, duration of diabetes mellitus, comorbid diseases, and antidiabetic agents taken by patient were collected from pa- tient histories and relevant electronic medical records from the Jeju National University Hospital. The height and weight of each subject were measured using an electronic meter. Systolic and diastolic blood pressure levels were recorded as the mean of two measurements after each subject rested for more than 10 min- utes. The waist circumference was measured (in cm to one deci- mal place) at the midpoint between the costal margin and iliac crest when each subject had both legs spread at shoulder width.
Measurement of biochemical markers
Blood glucose level was measured using the TBA-200FR chemical analyzer (Toshiba, Tokyo, Japan), with a glucose oxi-
dase method. HbA1c level was measured using the HLC- 723G8 (Tosoh, South San Francisco, CA, USA) with an ion-ex- change high-performance liquid chromatography. HbA1c standardization was performed in accordance with the guide- lines of the Korean Association of Quality Assurance for Clini- cal Laboratory. C-peptide level was measured by the Modular Analytics E170 electrochemiluminescence immunoassays (Hitachi, Tokyo, Japan). Total cholesterol, triglyceride, HDL-C, LDL-C, creatinine, and ALT levels were measured using the TBA-200FR chemical analyzer. The eGFR values were calcu- lated using the Modification of Diet in Renal Disease equation [17]. iGLP-1 (GLP-1 [7-36] amide, GLP-1 [7-37]) and iGIP (GIP [1-42]) levels were measured by a commercially available kit (Code No. 27784 and 27201, respectively; Immuno-Biological Laboratories Co. Ltd., Gunma, Japan) with a sandwich enzyme immunoassay.
Statistical analysis
All values are presented as mean±standard deviation or per- centage or median (interquartile range). The difference be- tween glucose, C-peptide, iGLP-1, and iGIP levels at 30 min- utes after meal and fasting were analyzed by paired t-tests or Wilcoxon signed rank test. Spearman’s rho were calculated to analyze the relationship between incretin levels and continu- ous clinicobiochemical variables. Wilcoxon rank sum test was used to compare incretin levels according to the presence or absence of categorical variables. Multiple linear regression analyses were used to determine independent relationships be- tween intact incretin levels and continuous clinicobiochemical variables. Regression analyses were performed using fasting iGLP-1, fasting GIP, ∆iGLP-1, or ∆iGIP levels as dependent variables and age, sex, and factors with significant differences in the univariate analysis (Spearman’s correlation and Wilcox- on rank sum test) as independent variables. All analyses were performed using the SPSS version 14.0 software program (SPSS Inc., Chicago, IL, USA), and P values of <0.05 were de- fined as significant.
RESULTS
Clinicobiochemical characteristics and fasting and postmeal incretin levels in the subjects
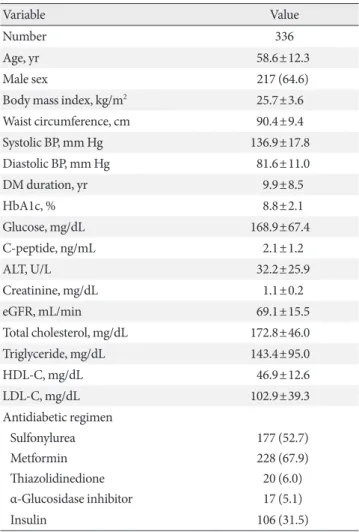
The levels of clinicobiochemical variables of the subjects are summarized in Table 1. A total of 336 patients with T2DM were enrolled in this study. Their average age was 58 years old,
and there were more men than women. The subjects had rela- tively long durations of diabetes and poor glycemic control.
About half of all subjects were taking sulfonylureas, about two- thirds were on metformin, and only a few subjects were taking thiazolidinediones or α-glucosidase inhibitors. About one- third of all subjects were injecting insulins (Table 1).
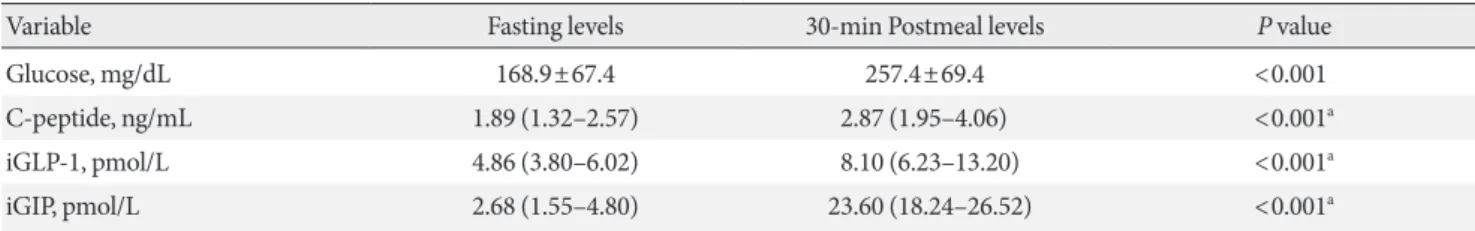
Fasting and 30-minute postmeal glucose, C-peptide, and in- tact incretin levels in the study subjects are presented in Table 2. Glucose and C-peptide levels were significantly increased af- ter ingestion of a standard mixed meal. In comparison with the fasting iGLP-1 and iGIP levels, those 30-minute levels in- creased by 190% and 570%, respectively. The increment of iGIP level was thus larger than that of iGLP.
Table 1. Clinical and laboratory characteristics of the study subjects
Variable Value
Number 336
Age, yr 58.6±12.3
Male sex 217 (64.6)
Body mass index, kg/m2 25.7±3.6
Waist circumference, cm 90.4±9.4
Systolic BP, mm Hg 136.9±17.8
Diastolic BP, mm Hg 81.6±11.0
DM duration, yr 9.9±8.5
HbA1c, % 8.8±2.1
Glucose, mg/dL 168.9±67.4
C-peptide, ng/mL 2.1±1.2
ALT, U/L 32.2±25.9
Creatinine, mg/dL 1.1±0.2
eGFR, mL/min 69.1±15.5
Total cholesterol, mg/dL 172.8±46.0
Triglyceride, mg/dL 143.4±95.0
HDL-C, mg/dL 46.9±12.6
LDL-C, mg/dL 102.9±39.3
Antidiabetic regimen
Sulfonylurea 177 (52.7)
Metformin 228 (67.9)
Thiazolidinedione 20 (6.0)
α-Glucosidase inhibitor 17 (5.1)
Insulin 106 (31.5)
Values are presented as mean±standard deviation or number (%).
BP, blood pressure; DM, diabetes mellitus; HbA1c, glycosylated he- moglobin; ALT, alanine aminotransferase; eGFR, estimated glomeru- lar filtration rate; HDL-C, high density lipoprotein cholesterol; LDL- C, low density lipoprotein cholesterol.
Univariate analyses of intact incretin levels with clinical and laboratory variables
We performed Spearman’s correlation anaylsis and Wilcoxon rank sum test for univariate analysis of the relationships be-
tween intact incretin levels and clinical and laboratory vari- ables (Tables 3 and 4). In the Spearman’s correlation analysis, fasting iGLP-1 levels were significantly positively correlated with glucose, creatinine, and triglyceride levels, and negatively Table 2. Blood levels of glucose, C-peptide, and intact incretin before and 30 minutes after ingestion of a standard mixed meal (n=336)
Variable Fasting levels 30-min Postmeal levels P value
Glucose, mg/dL 168.9±67.4 257.4±69.4 <0.001
C-peptide, ng/mL 1.89 (1.32–2.57) 2.87 (1.95–4.06) <0.001a
iGLP-1, pmol/L 4.86 (3.80–6.02) 8.10 (6.23–13.20) <0.001a
iGIP, pmol/L 2.68 (1.55–4.80) 23.60 (18.24–26.52) <0.001a
Values are presented as mean±standard deviation or median (interquartile range). P values are calculated using paired t-test.
iGLP-1, intact glucagon-like peptide 1; iGIP, intact glucose-dependent insulinotropic polypeptide.
aP values are calculated using Wilcoxon signed rank test.
Table 3. Correlational analysis of the relationships between intact incretin levels and clinical and laboratory variables (n=336) Variable
Fasting iGLP-1, pmol/L ΔiGLP-1, pmol/L Fasting iGIP-1, pmol/L ΔiGIP, pmol/L Spearman’s
rho P value Spearman’s
rho P value Spearman’s
rho P value Spearman’s
rho P value
Age, yr 0.049 0.373 0.029 0.597 –0.010 0.858 –0.015 0.783
Body mass index, kg/m2 0.023 0.678 –0.040 0.461 0.033 0.547 0.030 0.590
Waist circumference, cm 0.037 0.501 –0.063 0.260 0.023 0.674 –0.022 0.689
Systolic BP, mm Hg –0.026 0.638 –0.032 0.555 0.039 0.474 0.077 0.161
Diastolic BP, mm Hg –0.025 0.644 –0.003 0.957 0.013 0.808 0.061 0.262
DM duration, yr 0.061 0.265 –0.079 0.149 –0.016 0.768 –0.116 0.034
HbA1c, % 0.098 0.073 0.016 0.766 0.155 0.005 –0.184 0.001
Fasting glucose, mg/dL 0.172 0.002 –0.040 0.466 0.214 <0.001 –0.106 0.054
ΔGlucose, mg/dL –0.127 0.021 0.013 0.816 –0.039 0.481 0.197 <0.001
Fasting C-peptide, ng/mL 0.074 0.180 0.029 0.600 0.048 0.385 0.135 0.014
ΔC-peptide, ng/mL –0.086 0.117 0.154 0.005 –0.132 0.017 0.251 <0.001
ALT, U/L 0.066 0.237 0.031 0.582 –0.011 0.840 0.077 0.164
Creatinine, mg/dL 0.112 0.040 –0.072 0.190 –0.024 0.656 –0.036 0.509
eGFR, mL/min –0.138 0.012 0.029 0.600 –0.055 0.312 0.119 0.029
Total cholesterol, mg/dL 0.042 0.445 0.067 0.223 –0.101 0.066 0.063 0.252
Triglyceride, mg/dL 0.168 0.002 0.025 0.651 0.079 0.148 0.042 0.439
HDL-C, mg/dL –0.086 0.116 –0.012 0.822 –0.072 0.187 0.073 0.185
LDL-C, mg/dL 0.048 0.379 0.042 0.447 –0.095 0.082 0.022 0.684
ΔiGLP-1, pmol/L 0.017 0.750 - - - - - -
ΔiGIP, pmol/L - - - - –0.159 0.003 - -
P values are calculated using the Spearman’s rho correlation analysis.
iGLP-1, intact glucagon-like peptide 1; iGIP, intact glucose-dependent insulinotropic polypeptide; BP, blood pressure; DM, diabetes mellitus;
HbA1c, glycosylated hemoglobin; ALT, alanine aminotransferase; eGFR, estimated glomerular filtration rate; HDL-C, high density lipoprotein cholesterol; LDL-C, low density lipoprotein cholesterol.
correlated with eGFR. Other variables were not significantly correlated with fasting iGLP-1 levels. ∆iGLP-1 levels were only positively correlated with ∆C-peptide. Fasting iGIP levels showed significant positive correlations with HbA1c, fasting glucose and negative correlations with ∆C-peptide. Incremen- tal iGIP (∆iGIP) levels were significantly negatively correlated with diabetes duration and HbA1c, and positively correlated with ∆glucose, ∆C-peptide levels and eGFR (Table 3). Fasting level and incremental level of iGIP showed significant negative correlation.
The relationships between intact incretin levels and categori- cal variables were analyzed by Wilcoxon rank sum test. There were no sex differences regarding fasting iGLP-1, ∆iGLP-1, and fasting iGIP-1 levels. However, ∆iGIP levels were significantly higher in male subjects than females. Intact incretin levels did not differ with the use of sulfonylurea, metformin, thiazolidine- dione, and α-glucosidase inhibitor. However, insulin users had lower ∆iGIP levels compared with noninsulin users. No differ- ences were found in fasting iGLP-1, ∆iGLP-1, and fasting iGIP levels with the use of insulin (Table 4).
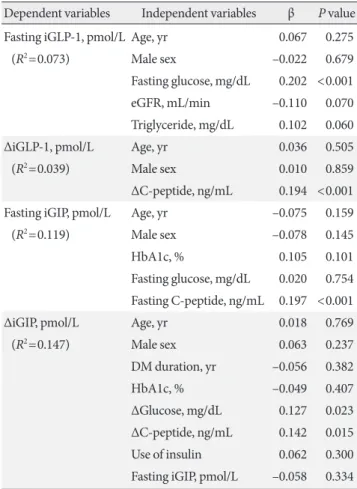
Multivariate analyses predicting intact incretin levels Multiple linear regression analyses were performed to examine the variables independently predicting intact incretin levels.
The variables included were age, sex, and significant variables in the univariate analyses. In the regression model with fasting iGLP-1 as the dependent variable, only fasting glucose re- mained significantly related factors. Age, sex, eGFR, and tri- glycerides failed to maintain those significant correlations.
Creatinine was excluded due to collinearity with age and eGFR. The model with ∆iGLP-1 showed that ∆C-peptide was a significantly related factor after adjustment for age and sex.
In the model with fasting iGIP, fasting C-peptide and ∆iGIP remained independent correlated factor after adjustment for age, sex, HbA1c, fasting glucose levels. ∆C-peptide was ex- cluded from the variables because it occurred later than fasting iGIP. The model with ∆iGIP showed that only ∆glucose, ∆C- peptide, and fasting iGIP were significant correlated factor af- ter adjustment for age, sex, disease duration, and the use of in- sulin (Table 5).
DISCUSSION
In this study, we cross-sectionally analyzed the relationships between intact incretin levels and various clinicochemical Table 4. Differences in intact incretin levels according to gender and the use of antidiabetic agents SexUse of sulfonylureaUse of metforminUse of thiazolidinedioneUse of α-glucosidase inhibitorUse of insulin Male (n=217)Female (n=119)P valueYes (n=177)No (n=159)P valueYes (n=228)No (n=108)P valueYes (n=20)No (n=316)P valueYes (n=17)No (n=319)P valueYes (n=106)No (n=230)P value Fasting iGLP-1, pmol/L
5.4±2.95.7±3.20.2745.7±2.85.4±3.20.1055.5±3.05.7±3.00.9657.0±3.55.5±3.00.0575.4±2.35.5±3.00.8945.5±2.75.6±3.10.776 ΔiGLP-1, pmol/L5.0±6.44.8±6.00.8124.9±6.24.9±6.30.4275.2±6.34.4±6.20.8934.0±5.85.0±6.30.3774.7±4.64.9±6.30.9284.6±6.05.0±6.40.726 Fasting iGIP-1, pmol/L
3.5±3.24.4±4.60.1283.8±3.43.9±4.20.9773.9±3.63.6±4.20.3385.2±4.83.7±3.70.3624.0±3.33.8±3.80.7453.7±3.33.9±4.00.851 ΔiGIP, pmol/L18.4±6.416.4±7.60.02217.6±6.917.7±6.90.89017.7±6.817.5±7.00.81618.4±5.017.6±7.00.98915.6±7.817.8±6.80.24216.2±7.118.4±6.70.004 P values are calculated using Wilcoxon rank sum test. iGLP-1, intact glucagon-like peptide 1; iGIP, intact glucose-dependent insulinotropic polypeptide.
variables in 336 T2DM patients. Univariate and multivariate analyses showed that fasting iGLP-1 levels were related to fast- ing glucose levels. ∆iGLP-1 levels were significantly correlated with ∆C-peptide levels, fasting iGIP levels were related to fast- ing C-peptide levels, and ∆iGIP levels were significantly corre- lated with ∆C-peptide and ∆glucose levels. Incretins are re- leased in response to food ingestion and regulate postprandial glucose levels rather than fasting glucose. Those postprandial increments are physiologically more important than the fast- ing levels. Therefore, our study results suggest that intact incre- tin levels are primarily related to C-peptide and glucose levels.
Few studies have investigated the predictors of incretin levels in T2DM patients. Toft-Nielsen et al. [7] reported that BMI and male sex negatively influenced the variability of both GLP-1 and GIP responses, and insulin area under the curve negatively
influenced that of only GLP-1 response. Vollmer et al. [9] re- ported that free fatty acid levels and sex were significantly relat- ed to GLP-1 response, but glucose control or insulin secretion was not related to incretin levels. Another study showed that GLP-1 and GIP responses to oral glucose were related to fasting triglycerides [13]. There is no clear reason why our results differ from other findings. Differences in methods of measuring in- cretin may be one of the reasons for the discrepancy. In our study, we measured intact incretin, in contrast to the above- mentioned studies that measured total incretin. Intact incretin is a biologically active form, whereas total forms of incretin are composed of intact incretin plus its metabolites produced by enzyme DPP-4. It is intact and not total incretin that stimulates insulin secretion and influences blood glucose levels. Therefore, we argue that our study showed the significant relationship with C-peptide and glucose levels—not with other parameters—be- cause we measured intact incretin levels.
The present study showed that ∆C-peptide levels were posi- tively correlated with both ∆iGLP-1 and ∆iGIP levels, which suggests that both incretins augmented insulin secretion. Spe- cifically, the ∆C-peptide levels had a stronger correlation with
∆iGLP-1 than ∆iGIP levels. This finding accords with previous research reporting that in T2DM patients the insulinotropic effect of GLP-1 is largely preserved more than that of GIP [18,19]. The present study also demonstrated that ∆glucose was significantly associated with ∆iGIP but not with ∆iGLP-1.
This result could be attributed to the downregulation of the β-cell GIP receptor in response to hyperglycemia [20,21]. The postmeal increment in iGIP level could compensate for de- creased expression of the GIP receptor. Morever, in pancreatic α-cells, GIP enhances postprandial glucagon secretion and GLP‐1 suppresses it [22]. The opposite effect of GIP and GLP- 1 on glucagon may be the reason for the difference in the asso- ciation between ∆iGIP and ∆iGLP-1 to ∆glucose. The lack of positive association between ∆glucose and ∆iGLP-1 might be due to the glucose-lowering effect of GLP-1. We measured the early-phase (0 to 30 minutes) glucose and incretin responses to ingestion of a meal. If we had measured their late responses, there would have been a negative relationship between ∆glu- cose and ∆iGLP-1 levels.
Fasting iGIP and ∆iGIP, showed significant negative correla- tion in univariate and multivariate analysis. It could be ex- plained by while the secretion of GIP increase to overcome the downregulated receptor in pancreatic β-cell, the K-cell has lim- its to secret GIP.
Table 5. Multiple linear regression analyses predicting intact incretin levels
Dependent variables Independent variables β P value Fasting iGLP-1, pmol/L Age, yr 0.067 0.275
(R2=0.073) Male sex –0.022 0.679
Fasting glucose, mg/dL 0.202 <0.001
eGFR, mL/min –0.110 0.070
Triglyceride, mg/dL 0.102 0.060
∆iGLP-1, pmol/L Age, yr 0.036 0.505
(R2=0.039) Male sex 0.010 0.859
∆C-peptide, ng/mL 0.194 <0.001 Fasting iGIP, pmol/L Age, yr –0.075 0.159
(R2=0.119) Male sex –0.078 0.145
HbA1c, % 0.105 0.101
Fasting glucose, mg/dL 0.020 0.754 Fasting C-peptide, ng/mL 0.197 <0.001
∆iGIP, pmol/L Age, yr 0.018 0.769
(R2=0.147) Male sex 0.063 0.237
DM duration, yr –0.056 0.382
HbA1c, % –0.049 0.407
∆Glucose, mg/dL 0.127 0.023
∆C-peptide, ng/mL 0.142 0.015 Use of insulin 0.062 0.300 Fasting iGIP, pmol/L –0.058 0.334 β, corrected regression coefficient; iGLP-1, intact glucagon-like pep- tide 1; R2, adjusted R squared; eGFR, estimated glomerular filtration rate; iGIP, intact glucose-dependent insulinotropic polypeptide;
HbA1c, glycosylated hemoglobin; DM, diabetes mellitus.
Fasting iGLP-1 and iGIP levels, unlike their postmeal incre- ments, were significantly related to fasting glucose and C-pep- tide levels, respectively. We do not know the reason for this discrepancy. On the other hand, female patients had higher fasting iGIP levels than males. It is known that women gener- ally have a slower gastric emptying rate than men [23], which could explain the higher fasting iGIP levels of female patients in our study. Indeed, because incretin hormones participate in the regulation of postprandial glucose rather than fasting glu- cose levels, fasting incretin levels were two to six times lower than their postmeal levels. Therefore, fasting iGLP-1 and iGIP levels are less important than their incremental levels after consumption of a meal in the physiological aspects of incretin hormones.
Our study has some limitations. First, we did not perform serial measurements of incretin. Postprandial incretin response is generally evaluated using area under the curve or peak con- centration of serum incretin. Theoretically, the area under the curve reflecting the integral of concentration—time is more desirable than peak concentration. However, to minimize in- convenience to the study subjects, we chose a peak concentra- tion for assessing the response. Our unpublished data show that intact incretin levels rapidly increased, peaked at 30 min- utes after ingestion of a meal, and gradually decreased with time (data not shown). Thus, we measured fasting and 30-min- ute postmeal values for evaluating the response. Second, we did not measure glucagon levels. iGLP-1 may exert its gluco- regulatory action mainly via the suppression of glucagon secre- tion [24]. Therefore, the measurement of glucagon would clari- fy the relationship between iGLP-1 and glucose levels. Third, total incretin levels and DPP-4 activity were not assessed in our study. If we had assessed total incretin and DPP-4 activity, we would have understood how intact and total incretin levels re- lated differently to clinical and laboratory parameters. Lastly, most subjects were taking various antidiabetic drugs during the study. We excluded subjects taking DPP-4 inhibitors or GLP-1 agonists that directly influence the serum level of incre- tin. However, it is known that α-glucosidase inhibitor [25], metformin [26], and insulin [27] can also increase blood incre- tin levels. Here, we showed that iGLP-1 and iGIP levels did not differ between users and nonusers of α-glucosidase inhibitor or metformin (Table 4). Although ∆iGIP levels were signifi- cantly different with the use of insulin, multivariate analysis adjusting for covariates revealed that the use of insulin did not predict ∆iGIP levels (Tables 4 and 5).
In conclusion, postmeal increments in intact incretin levels were primarily related to incremental glucose and C-peptide levels in patients with T2DM. These results suggest that glyce- mia and insulin secretion are the main factors associated with blood levels of intact incretin hormones. However, to under- stand the interrelation between intact incretin, glucose, and in- sulin secretion, serial measurements of glucagon, DPP-4 activ- ity, and total and intact incretin levels are required.
CONFLICTS OF INTEREST
No potential conflict of interest relevant to this article was re- ported.
AUTHOR CONTRIBUTIONS
Conception or design: G.K.
Acquisition, analysis, or interpretation of data: S.Y., E.J.Y., G.K.
Drafting the work or revising: S.Y., G.K.
Final approval of the manuscript: G.K.
ORCID
Soyeon Yoo https://orcid.org/0000-0002-0728-4013 Gwanpyo Koh https://orcid.org/0000-0002-6020-2777
ACKNOWLEDGMENTS
This research was supported by the research grant of Jeju En- docrine Society in 2017 and the 2019 scientific promotion pro- gram funded by Jeju National University.
REFERENCES
1. Baggio LL, Drucker DJ. Biology of incretins: GLP-1 and GIP.
Gastroenterology 2007;132:2131-57.
2. Nauck MA, Homberger E, Siegel EG, Allen RC, Eaton RP, Eb- ert R, Creutzfeldt W. Incretin effects of increasing glucose loads in man calculated from venous insulin and C-peptide respons- es. J Clin Endocrinol Metab 1986;63:492-8.
3. Vardarli I, Nauck MA, Kothe LD, Deacon CF, Holst JJ, Sch- weizer A, Foley JE. Inhibition of DPP-4 with vildagliptin im- proved insulin secretion in response to oral as well as “isogly- cemic” intravenous glucose without numerically changing the incretin effect in patients with type 2 diabetes. J Clin Endocri-
nol Metab 2011;96:945-54.
4. Creutzfeldt W. The incretin concept today. Diabetologia 1979;
16:75-85.
5. Creutzfeldt W, Nauck M. Gut hormones and diabetes mellitus.
Diabetes Metab Rev 1992;8:149-77.
6. Meier JJ, Nauck MA. Is the diminished incretin effect in type 2 diabetes just an epi-phenomenon of impaired beta-cell func- tion? Diabetes 2010;59:1117-25.
7. Toft-Nielsen MB, Damholt MB, Madsbad S, Hilsted LM, Hughes TE, Michelsen BK, Holst JJ. Determinants of the im- paired secretion of glucagon-like peptide-1 in type 2 diabetic patients. J Clin Endocrinol Metab 2001;86:3717-23.
8. Vilsboll T, Krarup T, Deacon CF, Madsbad S, Holst JJ. Reduced postprandial concentrations of intact biologically active gluca- gon-like peptide 1 in type 2 diabetic patients. Diabetes 2001;50:
609-13.
9. Vollmer K, Holst JJ, Baller B, Ellrichmann M, Nauck MA, Schmidt WE, Meier JJ. Predictors of incretin concentrations in subjects with normal, impaired, and diabetic glucose tolerance.
Diabetes 2008;57:678-87.
10. Legakis IN, Tzioras C, Phenekos C. Decreased glucagon-like peptide 1 fasting levels in type 2 diabetes. Diabetes Care 2003;
26:252.
11. Calanna S, Christensen M, Holst JJ, Laferrere B, Gluud LL, Vilsboll T, Knop FK. Secretion of glucose-dependent insulino- tropic polypeptide in patients with type 2 diabetes: systematic review and meta-analysis of clinical studies. Diabetes Care 2013;36:3346-52.
12. Calanna S, Christensen M, Holst JJ, Laferrere B, Gluud LL, Vilsboll T, Knop FK. Secretion of glucagon-like peptide-1 in patients with type 2 diabetes mellitus: systematic review and meta-analyses of clinical studies. Diabetologia 2013;56:965-72.
13. Alssema M, Rijkelijkhuizen JM, Holst JJ, Teerlink T, Scheffer PG, Eekhoff EM, Gastaldelli A, Mari A, Hart LM, Nijpels G, Dekker JM. Preserved GLP-1 and exaggerated GIP secretion in type 2 diabetes and relationships with triglycerides and ALT.
Eur J Endocrinol 2013;169:421-30.
14. Deacon CF, Nauck MA, Meier J, Hucking K, Holst JJ. Degrada- tion of endogenous and exogenous gastric inhibitory polypep- tide in healthy and in type 2 diabetic subjects as revealed using a new assay for the intact peptide. J Clin Endocrinol Metab 2000;
85:3575-81.
15. Deacon CF, Nauck MA, Toft-Nielsen M, Pridal L, Willms B, Holst JJ. Both subcutaneously and intravenously administered glucagon-like peptide I are rapidly degraded from the NH2-
terminus in type II diabetic patients and in healthy subjects.
Diabetes 1995;44:1126-31.
16. Nauck MA, Meier JJ. The incretin effect in healthy individuals and those with type 2 diabetes: physiology, pathophysiology, and response to therapeutic interventions. Lancet Diabetes En- docrinol 2016;4:525-36.
17. Levey AS, Coresh J, Greene T, Stevens LA, Zhang YL, Hendrik- sen S, Kusek JW, Van Lente F; Chronic Kidney Disease Epide- miology Collaboration. Using standardized serum creatinine values in the modification of diet in renal disease study equa- tion for estimating glomerular filtration rate. Ann Intern Med 2006;145:247-54.
18. Nauck MA, Heimesaat MM, Orskov C, Holst JJ, Ebert R, Creutzfeldt W. Preserved incretin activity of glucagon-like pep- tide 1 [7-36 amide] but not of synthetic human gastric inhibi- tory polypeptide in patients with type-2 diabetes mellitus. J Clin Invest 1993;91:301-7.
19. Vilsbøll T, Krarup T, Madsbad S, Holst JJ. Defective amplifica- tion of the late phase insulin response to glucose by GIP in obese type II diabetic patients. Diabetologia 2002;45:1111-9.
20. Lynn FC, Pamir N, Ng EH, McIntosh CH, Kieffer TJ, Pederson RA. Defective glucose-dependent insulinotropic polypeptide receptor expression in diabetic fatty Zucker rats. Diabetes 2001;
50:1004-11.
21. Lynn FC, Thompson SA, Pospisilik JA, Ehses JA, Hinke SA, Pamir N, McIntosh CH, Pederson RA. A novel pathway for regulation of glucose-dependent insulinotropic polypeptide (GIP) receptor expression in beta cells. FASEB J 2003;17:91-3.
22. Seino Y, Fukushima M, Yabe D. GIP and GLP-1, the two incre- tin hormones: similarities and differences. J Diabetes Investig 2010;1:8-23.
23. Hutson WR, Roehrkasse RL, Wald A. Influence of gender and menopause on gastric emptying and motility. Gastroenterolo- gy 1989;96:11-7.
24. Nagai E, Katsuno T, Miyagawa J, Konishi K, Miuchi M, Ochi F, Kusunoki Y, Tokuda M, Murai K, Hamaguchi T, Namba M. In- cretin responses to oral glucose load in Japanese non-obese healthy subjects. Diabetes Ther 2011;2:20-8.
25. Qualmann C, Nauck MA, Holst JJ, Orskov C, Creutzfeldt W.
Glucagon-like peptide 1 (7-36 amide) secretion in response to luminal sucrose from the upper and lower gut. A study using alpha-glucosidase inhibition (acarbose). Scand J Gastroenterol 1995;30:892-6.
26. Wu T, Thazhath SS, Bound MJ, Jones KL, Horowitz M, Rayner CK. Mechanism of increase in plasma intact GLP-1 by metfor-
min in type 2 diabetes: stimulation of GLP-1 secretion or re- duction in plasma DPP-4 activity? Diabetes Res Clin Pract 2014;106:e3-6.
27. Shimodaira M, Muroya Y, Kumagai N, Tsuzawa K, Honda K.
Effects of short-term intensive glycemic control on insulin, glucagon, and glucagon-like peptide-1 secretion in patients with type 2 diabetes. J Endocrinol Invest 2013;36:734-8.