Association of Circulating Brain-Derived Neurotrophic Factor with Cognition among Adult Obese Population
Ravi Babu Katuri1, Girwar Singh Gaur1,*, Jaya Prakash Sahoo2, Zachariah Bobby3, Karthik Shanmugavel1
Departments of 1Physiology, 2Endocrinology, and 3Biochemistry, Jawaharlal Institute of Postgraduate Medical Education and Research (JIPMER), Puducherry, India
Background: Obesity has a strong association with the risk of developing cognitive impairment and dementia at a later age. Brain-derived neurotrophic factor (BDNF) and its receptor appear to be important components in cognitive function and are also involved in energy homeostasis. The level of circulating BDNF and its association with cognition has yet to be delineated clearly. In this work we studied the association of circulating BDNF with cognition among the adult obese population.
Methods: The study involved 132 healthy participants between 18 and 40 years of age and of both sexes. The participants were categorized into an obesity group (n=66) and a non-obese group (n=66) based on their body mass index (Asian criteria). The level of cognitive performance was assessed by the event-related potentials P300 (ERPs-P300), mini-mental state examination (MMSE), both visual and auditory reaction times (VRT and ART, re- spectively), and other pen and paper tests related to memory and executive function. Serum BDNF, glycemic and lipid profiles were estimated.
Results: We found significant differences in the ERPs-P300 latency (P<0.001) and amplitude (P=0.002) be- tween the non-obese and obese group. The MMSE score was significantly reduced while VRT (P=0.005) and ART (P=0.001) were larger in the obese group. BDNF levels (P<0.001) were significantly reduced and negatively associated with the obese group. ERPs-P300 latency was negatively associated (r=–0.674, P=0.001) whereas amplitude (r=0.507, P<0.001) was positively associated with the BDNF levels in the adult obese population.
Conclusion: We found reduced circulating BDNF levels in obese adults and that lower BDNF levels were strongly associated with cognitive decline in the obese adult population.
Key words: Brain-derived neurotrophic factor, Cognition, Event-related potentials-P300, Mini-mental state examination, Obesity, Reaction time, BDNF receptor
Received October 10, 2020 Reviewed January 26, 2021 Accepted January 26, 2021
* Corresponding author Girwar Singh Gaur
https://orcid.org/0000-0002-6593-5187 Department of Physiology, Jawaharlal Institute of Postgraduate Medical Education and Research (JIPMER), Dhanwanthari Nagar, Gorimedu, Puducherry 605006, India Tel: +91-999-4470395 Fax: +91-413-2272067 E-mail: [email protected]
INTRODUCTION
Obesity has been determined to be a major health burden in both developing and developed countries.
1It causes hypertension, diabetes mellitus, dyslipidemia, coronary heart diseases, and can- cer.
2In addition to the ill effects of obesity on physical well-being, it also leads to the risk of developing mental health problems such as neurodegenerative disorder, dementia, and cognitive decline by impairing neuroplasticity.
3Available evidence has documented a strong association of adulthood obesity with dementia and cogni-
tive impairments at a later age.
4Cognitive assessment in humans has been done by event-related potentials P300 (ERPs-P300) tests and also both pen and paper tests, such as the mini-mental state ex- amination (MMSE), symbol cancellation tests (SCTs), simple re- action time and trail making tests (TMTs).
Cognition and energy balance have been demonstrated to be governed by the hypothalamus. Evidences from animal experi- ments and human studies indicated that reduced brain-derived neurotrophic factor (BDNF) leads to increased food intake, weight gain, and adiposity.
5Further, decreased circulating BDNF levels
Copyright © 2021 Korean Society for the Study of Obesity
This is an Open Access article distributed under the terms of the Creative Commons Attribution Non-Commercial License (https://creativecommons.org/licenses/by-nc/4.0/) which permits unrestricted non-commercial use, distribution, and reproduction in any medium, provided the original work is properly cited.
2017-03-16 https://crossmark-cdn.crossref.org/widget/v2.0/logos/CROSSMARK_Color_square.svg
have led to anorexic signals that caused BDNF receptor mutation in animal models. In accordance with these findings, scientific re- ports have documented restoration of normal food intake behavior, reduced adiposity, insulin resistance, and other metabolic abnor- malities by administering BDNF.
6These results have led to an un- derstanding of the interrelationship between circulating BDNF and obesity associated with neurological problems.
7However, there is no agreement in the scientific literature related to BDNF levels among the obese population. A few studies have reported increased levels of BDNF in obesity,
8but others did not.
9One study carried out by Hinderberger et al.
10reported a lack of as- sociation between obesity and circulating BDNF. As a result, the circulating level of BDNF and its association with obesity-related cognition has yet to be delineated clearly. Hence, in the present study, we aim to assess the association between circulating BDNF levels and cognition, anthropometry, and metabolic parameters in the obese adult population.
METHODS Study population
This was a cross-sectional comparative study conducted in the Department of Physiology of Jawaharlal Institute of Postgraduate Medical and Research (JIPMER), Puducherry, India. After obtain- ing approvals from the scientific advisory committee (JSAC48/
2017/68) and institute Human Ethics Committee (JIP/IEC/2017/
0270), 132 South Indian young adults with ages between 18 and 40 years of both sexes were included in the study. Body mass index (BMI) between 25 and 29.9 kg/m
2as obese group (n= 66) and apparently healthy non-obese adults with BMI between 18.5 and 22.9 kg/m
2group (n= 66) were recruited.
11Known cases of diabe- tes, hypertension, history of smoking, alcoholism, neurological dis- orders, psychological disorders, other endocrinology disorders, and participants who were on drugs for any chronic illness were exclud- ed from our study. Written informed consent was obtained from all the participants prior to the commencement of the study.
Anthropometric measurements
We recorded height in a standing posture with bare feet, using a wall-mounted stadiometer (VM Electronics, Chicago, IL, USA).
Weight was measured with a digital weighing balance to the nearest 0.1 kg. Hip circumference was measured at the level of the highest point of the gluteal region. Waist circumference (WC) was mea- sured at the widest diameter between the xiphoid process of the sternum and the iliac crest. Obesity indices such as waist to hip ra- tio (WHR) and BMI were calculated. BMI was calculated as the weight in kilograms divided by the square of the height in meters.
12Cognitive parameters
Event-related potentials
An ERPs measures the executive function (selective attention) of
the individuals by using an auditory oddball paradigm.
13The ERPs-
300 were recorded using “Electrophysiology/Electro–myography
machine (Nihon Kohden, Saitama, Japan) & Neuropack MEB
9200/9300 v08-15” software in a sound-proof room (Electrophysi-
ology lab) around 9 AM after a light breakfast. Participants were
asked to sit with their eyes closed while stimuli were given to mini-
mize eye movements and blinking. Electrodes filled with paste, ac-
cording to the International 10–20 system, were attached to the
scalp. The active electrode was placed at Cz (the intersecting point
of nasion-inion and inter-tragus midpoint). Reference electrodes
were kept at the right and left mastoid processes. A ground elec-
trode was fixed over the glabella. Impedance was maintained below
5 kΩ. Participants were asked to count silently the infrequent target
tones, which were presented randomly with a 0.20 probability in a
series of the non-target tones and to report the number of target
tones at the end of each run. Latencies and amplitudes on each
ERP components were measured. The target and non-target tones
were presented at a range of 20 and 80%, respectively, binaurally
over headphones at 40 dB. Before ERPs-P300 were recorded, the
participants completed several trials until they understood the
different tones and the requirements of the test. Subsequently, the
recordings were made. Trials including artifacts were automatically
rejected from the averages. The procedure was stopped after 35 av-
eraged target stimuli. Each test was performed twice to demon-
strate the consistency of the waveforms. The waveforms were
marked as N100, N200, P200, and P300. The peak latencies were
observed at 100, 150, 200, and 300 ms after the stimulus onset
concerning the waveform. The latencies and amplitudes of N100,
N200, P200, and P300 were marked.
14Reaction time
The reaction time (RT) apparatus consisted of an automated chronoscope with a four-digit display that recorded the response time with an accuracy of 1 millisecond. For all the participants, RT were recorded using the dominant hand of the participant (all of the subjects were right-handed). RT were measured using both au- ditory and visual modalities.
Auditory reaction time
In the auditory reaction time (ART) tests, two sound stimuli (click and beep) were given. The participants were asked to ignore the click sound and respond to the beep sound by releasing a but- ton. The “beep” sound is the “memory” stimulus to which the par- ticipant responds by releasing the button and the “click” sound is the “distractor” stimulus to which the participant does not respond.
Out of the ten recordings, the two lowermost and two uppermost outlying values were excluded, and the other six values were taken to calculate the mean ART in milliseconds.
15Visual reaction time
To determine the visual reaction time (VRT), two stimuli (red and green colored) were given, and the participants were asked to respond to one stimulus (recognition RT). Red and green colors were shown at random intervals. The participants were asked to re- spond to the red stimulus by releasing a button. At first, a trial was given. Subsequently, ten readings were taken. The two uppermost and lowermost values were excluded, and the other six values were averaged to determine the mean VRT.
15Mini-mental state examination
The MMSE was administered to assess cognitive function for each participant. The MMSE consists of 11 simple questions grouped into seven cognitive domains: orientation to time and place, registration of three words, attention, calculation, recall of three words, language, and visual construction. The total score was 30, this score provides a picture of an individual’s cognitive perfor- mance; a score of < 24 indicated cognitive impairment.
16Mini-cognitive assessment questionnaire
This questionnaire consists of mainly two domains i.e., recalling
memory and executive functions. Participants were informed of a name and an address and given two sets of words to memorize and recall when they were asked. The two sets of recalling words were given as four words in one set and three words in another set. After a minimum of four repetitions the participants were asked to re- member these two sets of words, the name, and the address. Partic- ipants were asked to recall them after some time. The score was given based on free recall (2 points) or clue recall (1 point). Execu- tive function was assessed by asking the participants to draw a clock on a piece of paper and mark the stated time with the arrows. The score was assessed based on the drawn clock (1 point) and the cor- rectly marked time (1 point).
17Symbol cancellation test
This test was a paper and pencil test done to assess the sustained attention of the participants. The participants were instructed to mark every open circle crossed by a single slanted line as quickly and accurately as possible. Scoring was done based on the time tak- en to finish the test (in seconds) and also by counting the number of errors (omissions and commissions) done by the participants.
18Symbol trail making test
The symbol trail making test (STMT) was also a paper and pen- cil test. This test was similar that of classical TMT. The STMT con- sisted of two parts, A (STMT-A) and B (STMT-B).
STMT-A
The participants were asked to connect the different-sized dots continuously from the smallest one to the largest one in increasing order. The time taken to perform the task and the number of the errors were recorded.
STMT-B
The participants were asked to match shaded and faded symbols.
The score reflects the total time required to finish the task and the number of mistakes.
Forward digit span test
This test assessed the immediate verbal memory span. It con-
tained digit sequences ranging from 3 to 8 numbers. In this test, the
participants were asked to repeat the digit sequences that were read by the examiner. The numbers were read only once and were not repeated. For every digit sequence, two trials were given. The ex- aminer pronounced a list of digit sequences at a rate of approximate- ly one digit per second and participants were required to immedi- ately repeat the list in the same order. If they succeeded, a sequence one digit longer was presented. If they failed, a second sequence of the same length was presented. If participants were successful on the second list, a list one digit longer was given, as before. However, if participants also failed on the second list, the test ended. The length of the digit sequences gradually increased, starting with a sequence of three numbers (e.g., 2, 9, 8) to a maximum of eight numbers (e.g., 1, 3, 4, 9, 6, 7, 5, 2). The span was established as the length of the longest list recalled correctly. The number of digits recalled reflect- ed the total score.
19Reverse digit span test
The same procedure for the forward digit span test (FDST) was used for the reverse digit span test (RDST). In the RDST, the par- ticipants were asked to repeat the digit sequences in the reverse or- der of what the examiner said. The score was taken as the maxi- mum number of digits that the subjects were able to reverse.
19Measurement of biochemical parameters
We collected 5 mL of venous blood for biochemical analysis us- ing an aseptic technique. The fasting blood glucose (FBG) level was estimated by the colorimetric method, the enzymatic method with glucose oxidase, and the peroxidase method, and insulin level (Calbiotech Inc., El Cajon, CA, USA) was estimated using the en- zyme-linked immunosorbent assay (ELISA) method. Further, we estimated glycated hemoglobin (HbA1c) with high-performance liquid chromatography. We calculated the homeostatic model as- sessment of insulin resistance (HOMA-IR) for the participants us- ing the formula (HOMA-IR= FBG (mmol)× insulin (µIU/L)/
22.5).
20Lipid profile parameters such as total cholesterol (TC), tri- glycerides (TG), and high-density lipoprotein cholesterol (HDL- C) concentrations were measured using a fully automated clinical chemistry analyzer (ChemWell Awareness Technology, Palm City, FL, USA). The concentration of very low-density lipoprotein (VLDL-C) was calculated using Friedewald equation.
21The ath-
erogenic index (AI) was calculated using the formula: AI= (TC–
HDL-C)/HDL-C.
22We measured the serum BDNF with ELISA, using a Fine Test (Wuhan Fine Biotech Co., Ltd., Wuhan, China), as per the manufacturer guidelines.
Statistical analysis
The data was analyzed using IBM SPSS version 20 (IBM Corp., Armonk, NY, USA) software. Normality of the data was analyzed using the Kolmogorov-Smirnov test. All the data were presented as mean± standard deviation. The level of significance between the groups was tested using an unpaired t-test. The association between BDNF and various parameters was assessed by Pearson’s correlation analysis. The P-values <0.05 were considered statistically significant.
RESULTS
Comparison of demographical parameters between the non-obese and obese groups
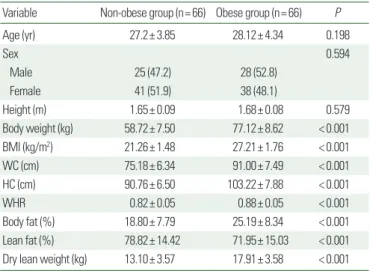
There was no significant difference caused by age or sex. Obesity indices such as BMI, WHR, body fat%, and dry lean fat% were higher while lean fat% was lower in the obese group than in the non-obese group (Table 1).
Table 1. Comparison of anthropometric parameters and body fat composition be- tween non-obese and obese groups
Variable Non-obese group (n= 66) Obese group (n= 66) P
Age (yr) 27.2± 3.85 28.12± 4.34 0.198
Sex 0.594
Male 25 (47.2) 28 (52.8)
Female 41 (51.9) 38 (48.1)
Height (m) 1.65± 0.09 1.68± 0.08 0.579
Body weight (kg) 58.72± 7.50 77.12± 8.62 < 0.001
BMI (kg/m2) 21.26± 1.48 27.21± 1.76 < 0.001
WC (cm) 75.18± 6.34 91.00± 7.49 < 0.001
HC (cm) 90.76± 6.50 103.22± 7.88 < 0.001
WHR 0.82± 0.05 0.88± 0.05 < 0.001
Body fat (%) 18.80± 7.79 25.19± 8.34 < 0.001
Lean fat (%) 78.82± 14.42 71.95± 15.03 < 0.001 Dry lean weight (kg) 13.10± 3.57 17.91± 3.58 < 0.001 Values are presented as mean± standard deviation or number (%). The mean differenc- es between the groups were analyzed using an unpaired t-test. A P-value < 0.05 con- sidered statistically significant.
BMI, body mass index; WC, waist circumference; HC, hip circumference; WHR, waist to hip ratio.
Comparison of cognitive parameters between the obese and non-obese groups
The mean latencies of ERPs-P300 increased and the amplitude decreased in the obese group. Reaction times like ART and VRT increased significantly in the obese group. The MMSE and mini-cog- nitive assessment questionnaire (Mini-CAQ) scores were higher in the non-obese group compared to the obese group. The SCT time and the number of errors were smaller in the non-obese group. The STMT time was comparable between the groups but the number of errors was significantly higher in the obese group than in the non-obese group. The RDST score was significantly higher in the non-obese group while the FDST score was comparable (Table 2).
Table 2. Comparison cognitive parameters between non-obese and obese groups Variable Non-obese group (n= 66) Obese group (n= 66) P ERPs-P300
Latency (ms) 316.48± 9.13 345.94± 7.53 < 0.001
Amplitude (mV) 14.53± 6.48 11.45± 4.25 0.002
Reaction time
ART (ms) 0.20± 0.03 0.22± 0.03 0.001
VRT (ms) 0.23± 0.03 0.25± 0.03 0.005
MMSE score 29.89± 0.63 27.56± 3.07 < 0.001
Mini-CAQ Score 20.21± 1.67 17.84± 3.71 < 0.001
SCT
Time (sec) 70.13± 12.50 78.22± 15.69 0.026
No. of errors 0.15± 0.40 1.03± 1.50 < 0.001 STMT
Time (sec) 45.80± 13.82 48.67± 17.19 0.304
No. of errors 0.18± 0.49 0.54± 0.94 0.006
Digit span test
FDST score 6.85± 1.11 6.55± 1.12 0.140
RDST score 6.00± 1.38 5.31± 1.45 0.006
Values are presented as mean± standard deviation. The mean difference between the groups were analyzed using unpaired t-test. A P-value < 0.05 considered statistically significant.
ERPs-P300, event-related potentials P300; ART, auditory reaction time; VRT, visual reac- tion time; MMSE, mini-mental state examination; Mini-CAQ, mini-cognitive assess- ment questionnaire; SCT, symbol cancellation test; STMT: symbol trail making test;
FDST, forward digit span test; RDST, reverse digit span test.
Table 3. Comparison of the biochemical parameters between non-obese and obese groups
Variable Non-obese group (n= 66) Obese group (n= 66) P
FBG (mg/dL) 76.96± 6.98 84.65± 15.10 < 0.001
HbA1c 5.2± 0.26 5.4± 0.38 < 0.001
Insulin (µIU/mL) 7.77± 3.16 13.86± 4.88 < 0.001
HOMA-IR 1.03± 0.89 1.81± 1.44 < 0.001
TC (mg/dL) 134.53± 20.65 173.95± 35.44 < 0.001
TG (mg/dL) 112.16± 38.11 156.20± 64.53 < 0.001
HDL-C (mg/dL) 46.60± 9.31 37.18± 11.83 < 0.001
LDL-C (mg/dL) 69.69± 25.94 112.06± 33.92 < 0.001
VLDL-C (mg/dL) 22.44± 7.61 31.73± 12.86 < 0.001
TC/HDL-C 3.00± 0.78 5.27± 2.42 < 0.001
TG/HDL-C 2.52± 1.09 4.92± 3.73 < 0.001
LDL-C/HDL-C 1.56± 0.70 3.29± 1.93 < 0.001
Atherogenic index 2.00± 0.78 4.27± 2.42 < 0.001
BDNF (ng/mL) 84.27± 9.90 63.79± 17.44 < 0.001
Values are presented as mean± standard deviation. The mean difference between the groups were analyzed using unpaired t-test. A P-value < 0.05 considered statistically significant.
FBG, fasting blood glucose; HbA1c, glycated hemoglobin; HOMA-IR, homeostatic mod- el assessment of insulin resistance; TC, total cholesterol; TG, triglycerides; HDL-C, high- density lipoprotein cholesterol; LDL-C, low-density lipoprotein cholesterol; VLDL-C, very low-density lipoprotein cholesterol; BDNF, brain derived neurotrophic factor.
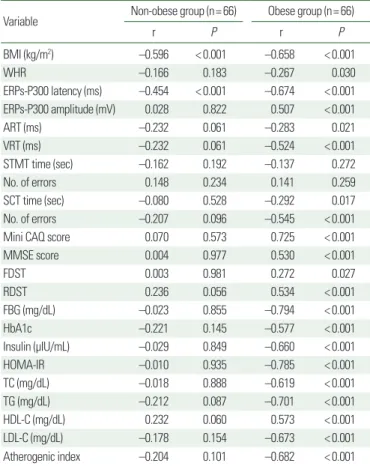
Table 4. Correlation of BDNF with anthropometric, cognitive, glycemic, and lipid profile parameters in non-obese and obese populations
Variable Non-obese group (n= 66) Obese group (n= 66)
r P r P
BMI (kg/m2) –0.596 < 0.001 –0.658 < 0.001
WHR –0.166 0.183 –0.267 0.030
ERPs-P300 latency (ms) –0.454 < 0.001 –0.674 < 0.001 ERPs-P300 amplitude (mV) 0.028 0.822 0.507 < 0.001
ART (ms) –0.232 0.061 –0.283 0.021
VRT (ms) –0.232 0.061 –0.524 < 0.001
STMT time (sec) –0.162 0.192 –0.137 0.272
No. of errors 0.148 0.234 0.141 0.259
SCT time (sec) –0.080 0.528 –0.292 0.017
No. of errors –0.207 0.096 –0.545 < 0.001
Mini CAQ score 0.070 0.573 0.725 < 0.001
MMSE score 0.004 0.977 0.530 < 0.001
FDST 0.003 0.981 0.272 0.027
RDST 0.236 0.056 0.534 < 0.001
FBG (mg/dL) –0.023 0.855 –0.794 < 0.001
HbA1c –0.221 0.145 –0.577 < 0.001
Insulin (µIU/mL) –0.029 0.849 –0.660 < 0.001
HOMA-IR –0.010 0.935 –0.785 < 0.001
TC (mg/dL) –0.018 0.888 –0.619 < 0.001
TG (mg/dL) –0.212 0.087 –0.701 < 0.001
HDL-C (mg/dL) 0.232 0.060 0.573 < 0.001
LDL-C (mg/dL) –0.178 0.154 –0.673 < 0.001
Atherogenic index –0.204 0.101 –0.682 < 0.001
Pearson correlation was used. A P-value < 0.05 considered statistically significant.
BDNF, brain-derived neurotrophic factor; BMI, body mass index; WHR, waist to hip ra- tio; ERPs-P300, event-related potentials P300; ART, auditory reaction time; VRT, visual reaction time; STMT, symbol trail making test; SCT, symbol cancellation test; Mini-CAQ, mini-cognitive assessment questionnaire; MMSE, mini-mental state examination;
FDST, forward digit span test; RDST, reverse digit span test; FBG, fasting blood glucose;
HbA1c, glycated hemoglobin; HOMA-IR, homeostatic model assessment of insulin re- sistance; TC, total cholesterol; TG, triglycerides; HDL-C, high-density lipoprotein choles- terol; LDL-C, low-density lipoprotein cholesterol.
lated in the obese group. SCT time and errors were negatively cor- related. MMSE, Mini-CAQ, FDST, and RDST scores were posi- tively correlated in the obese group. FBG, HbA1c, insulin, HOMA- IR, TC, TG, LDL-C, and AI were negatively correlated while HDL-C was positively correlated in the obese group (Table 4).
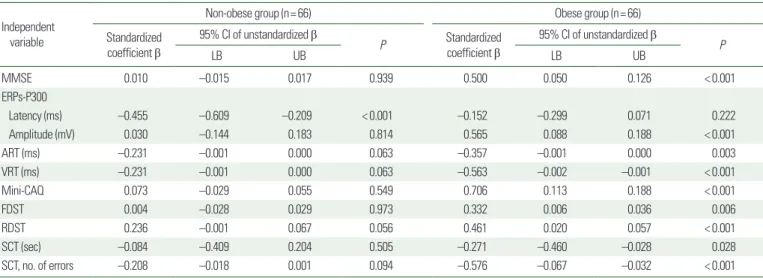
Multiple linear regression analyses depicted the individual con- tribution of obesity indices like BMI, WC, WHR, fat%, TC, and TG to BDNF levels in the non-obese group and the obese group (Table 5). The regression analyses also revealed the individual as- sociation of cognitive parameters (MMSE, ERPs-P300, RT, Mini- CAQ, DST, and SCT) to BDNF levels in the non-obese and obese groups (Table 6). The serum BDNF levels were higher in females
Table 6. Multiple linear regression analysis of BDNF (independent variable) with cognitive parameters (as dependable variables) in non-obese and obese groups Independent
variable
Non-obese group (n= 66) Obese group (n= 66)
Standardized coefficient β
95% CI of unstandardized β
P Standardized
coefficient β
95% CI of unstandardized β
LB UB LB UB P
MMSE 0.010 –0.015 0.017 0.939 0.500 0.050 0.126 < 0.001
ERPs-P300
Latency (ms) –0.455 –0.609 –0.209 < 0.001 –0.152 –0.299 0.071 0.222
Amplitude (mV) 0.030 –0.144 0.183 0.814 0.565 0.088 0.188 < 0.001
ART (ms) –0.231 –0.001 0.000 0.063 –0.357 –0.001 0.000 0.003
VRT (ms) –0.231 –0.001 0.000 0.063 –0.563 –0.002 –0.001 < 0.001
Mini-CAQ 0.073 –0.029 0.055 0.549 0.706 0.113 0.188 < 0.001
FDST 0.004 –0.028 0.029 0.973 0.332 0.006 0.036 0.006
RDST 0.236 –0.001 0.067 0.056 0.461 0.020 0.057 < 0.001
SCT (sec) –0.084 –0.409 0.204 0.505 –0.271 –0.460 –0.028 0.028
SCT, no. of errors –0.208 –0.018 0.001 0.094 –0.576 –0.067 –0.032 < 0.001
A P-value < 0.05 considered statistically significant.
BDNF, brain-derived neurotrophic factor; CI, confidence interval; LB, lower bound; UB, upper bound; MMSE, mini-mental state examination; ERPs-P300, event-related potentials P300; ART, auditory reaction time; VRT, visual reaction time; Mini-CAQ, mini-cognitive assessment questionnaire; FDST, forward digit span test; RDST, reverse digit span test; SCT, symbol cancellation test.
Comparison of biochemical parameters between non-obese and obese groups
FBG, HbA1c, fasting insulin, and HOMA-IR were higher in the obese group. The obese group had significantly higher mean values of TC, TG, LDL-C, VLDL-C and lipid derived parameters like AI, TC/HDL-C, TG/HDL-C, and LDL-C/HDL-C. BDNF and HDL-C were significantly lower in the obese group (Table 3).
Association of BDNF with different parameters
BMI and WHR were negatively correlated in the obese group.
ERPs-P300 latency was negatively correlated while amplitude was positively correlated in the obese group. RT were negatively corre-
Table 5. Multiple linear regression analysis of BDNF (as dependable variable) with obesity indices (as independent variables) in non-obese and obese groups Independent
variable
Non-obese group (n= 66) Obese group (n= 66)
Standardized coefficient β
95% CI of unstandardized β
P Standardized
coefficient β
95% CI of unstandardized β
LB UB LB UB P
BMI –0.520 –5.350 –1.662 < 0.001 –0.423 –6.721 –1.768 0.001
WC (cm) –0.145 –0.728 0.278 0.370 –0.084 –0.619 0.226 0.356
WHR –0.031 –53.66 41.99 0.808 –0.057 –61.544 28.121 0.458
Fat% 0.058 –0.195 0.344 0.583 0.185 0.013 0.773 0.043
TC (mg/dL) 0.052 –0.074 0.124 0.614 –0.205 –0.190 –0.013 0.025
TG (mg/dL) –0.044 –0.067 0.044 0.683 –0.378 –0.154 –0.050 < 0.001
A P-value < 0.05 considered statistically significant.
BDNF, brain-derived neurotrophic factor; CI, confidence interval; LB, lower bound; UB, upper bound; BMI, body mass index; WC, waist circumference; WHR, waist to hip ratio; TC, to- tal cholesterol; TG, triglycerides.