107
외과계 중환자실에서 사망률 감소를 위한 적정혈당지표에 관한 연구
윤소정2,3·송영천3·김재연3·이병구1,2·곽혜선1,2
1이화여자대학교 약학대학/생명약학부, 2이화여자대학교 임상보건과학대학원, 3서울아산병원 약제부 (2010년 6월 27일 접수·2010년 8월 27일 수정·2010년 8월 30일 승인)
Optimal Glycemic Control to Reduce Mortality in Surgical Intensive Care Unit
So Jung Yoon
2,3, Young Chun Song
3, Jae Yeon Kim
3, Byung Koo Lee
1,2, and Hye Sun Gwak
1,21College of Pharmacy & Division of Life and Pharmaceutical Sciences, Ewha Womans University, Seoul 120-750, Korea
2Ewha Graduate school of Clinical Health Sciences, Ewha Womans University, Seoul 120-750, Korea
3Division of Pharmaceutical Services, Asan Medical Center, Seoul 138-736, Korea
(Received June 27, 2010·Revised August 27, 2010·Accepted August 30, 2010)
서 론: 중환자실에서 집중적 인슐린 요법에 의한 평균혈당강하는 사망률을 감소시키는 것으로 나타났으나 이로 인한 저혈당 및 혈당변동은 새로운 문제로 대두되고 있다. 본 연구에서는 혈당과 관련한 여러 요인들이 사망에 미치 는 영향을 규명하고 적정 혈당치를 확인하고자 하였다.
연구방법: 2008년 2월부터 7월 사이인 6개월 동안 서울아산병원 외과계 중환자실에서 4일 이상 재실한 18세 이상의 성인 환자를 대상으로 전자 의무기록 조사를 통해 후향적으로 연구가 진행되었다. 연구를 위해 환자의 인구학적 특 성, 수술의 종류, 중환자실에서의 재실기간, 사망여부, 스테로이드 사용 유무, 기계적 인공호흡기의 사용유무, 신대체요 법의 사용유무, 혈당치, 재실기간 중 스테로이드 사용유무와 인슐린 양, 입원 후 첫 24시간 동안의 포도당 주입속도, 입원 후 2일 이내와 그 이후에 발생한 균혈증 감염, APACH II와 SOFA 점수를 조사하였다. 혈당수치는 각각의 환자에서 중환자실 입실 후 가장 처음 측정된 혈당, 재실기간 중 가장 높은 혈당과 가장 낮은 혈당수치를 조사하였 고 중환자실 전체 재실기간 동안 혈당수치의 평균과 변동계수를 계산하였다. 이상의 혈당관련지표를 포함한 인자들이 일차 종속변수인 사망에 어떠한 영향을 주는지를 환자를 생존군과 사망군으로 나누어 분석하였고 ROC (receiver operator characteristic) 곡선을 사용하여 혈당지표와 APACH 및 SOFA 점수의 cut-off치를 구하여 이로부터 단변량 및 다변량 분석을 시행하였다.
결 과: 연구에 포함된 환자는 170명 이었고 그 중 23명이 연구 기간 중 중환자실에서 사망하였다. 생존자에 비 해 사망자의 최대혈당은 유의적으로 높았고 최소혈당치는 유의적으로 낮아 높은 변동계수를 보였다. ROC곡선으로부터 산출된 혈당치들의 cut-off 수치는 최소혈당치 70 mg/dL, 변동계수 25%, 최대혈당치 250 mg/dL, 평균혈당치 150 mg/
dL 이었다. 다변량분석에서 최소혈당이 70 mg/dL 보다 큰 경우가 낮은 경우에 비해 오즈비가 0.922(95% 신뢰구간 0.881-0.965) 로 유의성 있게 낮았으며 변동계수가 25% 보다 높은 집단의 경우 그보다 낮은 집단에 비해 오즈비가 1.121(95% 신뢰구간 1.017-1.236)로 유의성 있게 높았다. Kaplan-Meier 생존분석 결과 최소혈당치 70 mg/dL와 변동 계수 25%에 따라 생존기간에 유의성 있는 차이가 나타났다.(각각 P < 0.001, P < 0.05)
결 론: 고혈당 발생의 감소뿐 아니라 최소혈당치를 70 mg/dL 이상으로 유지하면서 변동을 최소화하는 것이 외과 계 중환자실에서의 사망률감소를 위한 중요한 요인임을 알 수 있었다.
□ Key words - 중환자실 , 집중적 인슐린 요법 , 혈당관련지표 , 사망 , 적정혈당치
Hyperglycemia and insulin resistance are common findings in critically ill patients, even though they had
no history of diabetes.
1-3)It’s been reported that there is a positive correlation between hyperglycemia and morality in patients admitted to the surgical intensive care unit (SICU).
4)Intensive insulin therapy was employed to reduce mortality and morbidity in selected surgical patients based on two large randomized con- trolled trials.
4,5)The benefit of the intensive insulin
Correspondence to : Hye Sun Gwak, Pharm.D., Ph.D.
College of Pharmacy & Division of Life and Pharmaceutical Sciences, Ewha Womans University, 11-1 Daehyun-Dong Seodaemun-Gu, Seoul 120-750, Korea
Tel: +82-2-3277-4376, Fax: +82-2-3277-2851 E-mail: [email protected]
therapy was mainly attributed to a reduction in the mean glucose concentration. However, high incidence of hypoglycemia was of main concern by intensive insulin therapy even if the impact of hypoglycemia on mortality was controversial. In addition, some studies reported that variability of glucose influenced on mor- tality, indicating that death is caused by fluctuation of glucose level rather than low glucose level.
6,7)The aim of this study was, therefore, to assess the effects of glucose indices on mortality, and identify their optimal cut-off points in SICU setting.
MATERIALS AND METHODS
Study Population
The current study was conducted in Asan Medical Center in Korea. A retrospective chart review was con- ducted using all consecutive adult patients who were admitted to SICU and stayed for more than 4 days between February and July in 2008. The exclusion crite- ria were patients with history of diabetes requiring insu- lin therapy, brain death or referral to other hospitals.
Data Collection and Analysis
At the time of admission to SICU, demographic data, type of critical illness on admission to SICU, length of stay at SICU, data on mechanical ventilation, renal replacement therapy, and serial blood glucose level were obtained from review of individual chart. Use of steroids and insulin requirements for the whole SICU stay and glucose infusion rates for the first 24 hr after SICU admission were also documented. The occurrence of bacteremia within and after 2 days of SICU admis- sion (primary and secondary bacteremia, respectively) was also recorded. To determine the severity of illness, Acute Physiology and Chronic Health Evaluation (APACHE) II Score and Sequential Organ Failure Assessment (SOFA) Score were used.
For blood glucose indices, the mean and standard deviation (SD) of blood glucose concentration during SICU stay were calculated as arithmetical mean and SD of the entire set of measurement during SICU stay. To
evaluate relative variability, the coefficient of variation of glucose (SD/Mean × 100) was also calculated for each patient. The maximum and minimum blood glu- cose in each patient was determined as the highest and lowest values during SICU stay, respectively. The glu- cose measurement on admission was defined as the first glucose measurement after SICU admission.
Statistical Analysis
The primary outcome was SICU mortality. Patients were separated into SICU survivors and nonsurvivors.
Differences were assessed using Wilcoxon rank sum test for continuous data. Categorial variables were com- pared using the x
2-test. The area under the receiver operator characteristic (ROC) curves was calculated for several blood glucose indices (admission glucose, maxi- mum glucose, minimum glucose, mean glucose, coeffi- cient of variation of glucose) and disease severity (APACH II and SOFA scores). The estimate of the area under the ROC curve was computed using binegative exponential model and asymptotic 95% confidential intervals. Curves were compared using their 95% confi- dence intervals. All variables were analyzed with univariate regression analysis using cut-off values from ROC curves and with multivariate regression analysis correcting for age, gender and significant factors found in univariate analysis. Time of death was assessed by Kaplan-Meier analysis and the Mantel-Cox log-rank test.
All values were expressed as the mean ±S.D. A P value of less than 0.05 was considered significant. All statisti- cal analyses were performed by SPSS 13.0 for Windows (SPSS Inc., Chicago, IL, USA).
RESULTS
Among 224 patients eligible for the study, 54 patients
were excluded: 42 who had a history of diabetes melli-
tus requiring insulin therapy and 12 who were referred
to other hospitals. The number of death in SICU was
23, which the observed mortality rate was 13.5%. As
shown in Table 1, between survivors and non-survivors,
Table 1. Comparisons of survivors and non-survivors
Survivors Non-survivors P Value
(n=147) (n=23)
Sex(Males/Females), n 104/12 43/11 0.075
Age*, year 55(46-65) 54(46-67) 0.529
Height, cm 165.68±8.35 162.56±8.12 0.096
Weight, kg 64.67±11.94 61.31±11.35 0.237
BMI, kg/m2 23.39±3.34 23.14±3.59 0.740
SICU stay, days 10.71±12.22 20.70±23.19 0.024
Type of surgery, n 0.728
Liver transplantation 86 13
Stomach, intestine excision 24 5
Liver, biliary tract, pancreas excision 18 2
Vessel operation 11 1
Kidney transplantation/excision 6 1
Other 2 1
Steroid use, % 66.0 91.3 0.014
Mechanical ventilation, % 85.7 100.0 0.081
Renal replacement therapy, % 29.9 82.6 <0.001
Primary bacteremia, % 6.1 13.0 0.210
Secondary bacteremia, % 5.4 30.4 0.001
APACHE II Score (day 1) 21.33±7.94 29.39±8.84 <0.001
APACHE II Score (day 2) 16.59±7.14 27.65±8.76 <0.001
SOFA Score (day 1) 11.10±4.35 15.26±4.13 <0.001
SOFA Score (day 2) 9.76±4.35 15.39±4.02 <0.001
Glucose infusion rate (day 1), mg/kg/min 0.92±0.85 0.97±0.72 0.417
Dose of insulin , IU/kg/d 0.23±0.30 0.13±0.20 0.317
Admission glucose level, mg/dL 165.07±57.64 162.04±89.88 0.830
Maximum glucose level, mg/dL 249.82±72.49 305.35±119.45 0.028
Minimum glucose level, mg/dL 91.39±23.84 48.13±19.69 <0.001
Mean glucose level, mg/dL 155.05±25.62 139.81±23.31 0.008
Coefficient of variation of glucose, % 22.49±7.48 34.51±11.43 <0.001
*Age is expressed as median (interquartile range). BMI=Body Mass Index; ICU=Intensive Care Unit; Primary bacteremia: bacteremia occurrence within 2 days after SICU admission; Secondary bacteremia: bacteremia occurrence from 3 days after SICU admission; APACHE=Acute Physiology and Chronic Health Evaluation; SOFA=Sequential Organ Failure Assessment
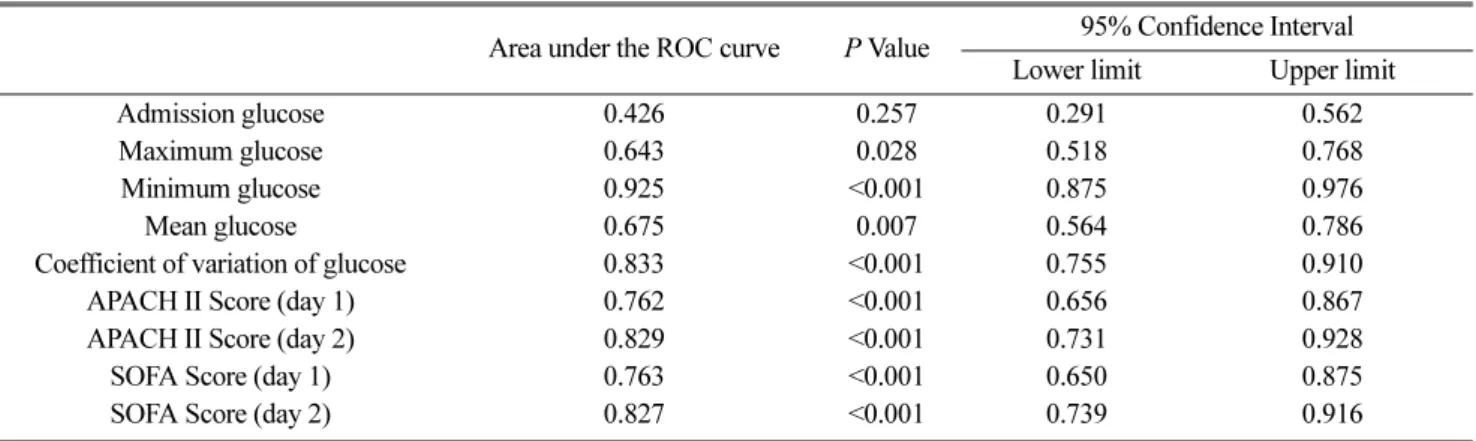
Table 2. Area under the ROC curves for each glycemic variable
Area under the ROC curve P Value 95% Confidence Interval Lower limit Upper limit
Admission glucose 0.426 0.257 0.291 0.562
Maximum glucose 0.643 0.028 0.518 0.768
Minimum glucose 0.925 <0.001 0.875 0.976
Mean glucose 0.675 0.007 0.564 0.786
Coefficient of variation of glucose 0.833 <0.001 0.755 0.910
APACH II Score (day 1) 0.762 <0.001 0.656 0.867
APACH II Score (day 2) 0.829 <0.001 0.731 0.928
SOFA Score (day 1) 0.763 <0.001 0.650 0.875
SOFA Score (day 2) 0.827 <0.001 0.739 0.916
ROC = Receiver Operator Characteristic
APACHE=Acute Physiology and Chronic Health Evaluation;
SOFA=Sequential Organ Failure Assessment
there were significant differences in length of SICU stay, steroid use, renal replacement therapy, secondary bacteremia occurrence from 3 days after SICU admis- sion and APACH II and SOFA Score.
Among glucose indices, significantly higher maxi- mum blood glucose level and lower minimum blood glucose level were obtained from non-survivors, result- ing in higher coefficient of variation. Mean glucose level was higher in survivors. (Table 1)
The ROC curve analyses were performed on glucose indi- ces including maximum, minimum and mean value of glu- cose concentrations and their variability, and disease severity such as APACHE II and SOFA Score. As described in Table 2, maximum, minimum and mean glucose, coeffi- cient of variation of glucose and APACHE II and SOFA Score on both day 1 and 2 showed significantly great area under the ROC curve. The minimum glucose level revealed the highest area of 0.925 (95% confidence interval (CI), 0.875 to 0.976) followed by coefficient of variation of glu- cose levels (area under the curve 0.833; 95% CI, 0.755 to 0.910).
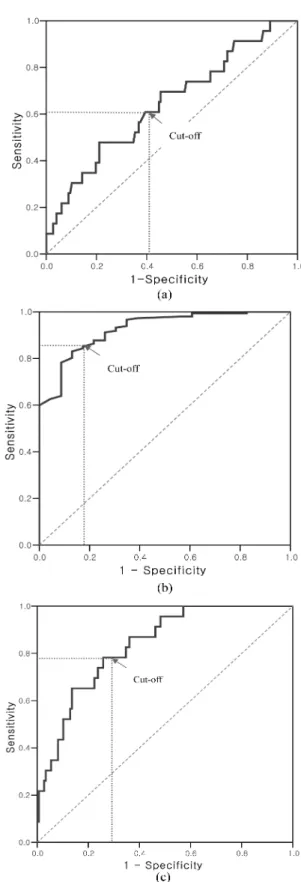
The ROC curve analysis showed that minimum glu- cose level of 70 mg/dL had higher sensitivity (87%) and specificity (82%) to discriminate the probability of death while patients whose coefficient of variation of blood glucose levels was greater than 25% had higher probability of death compared to those whose blood glucose levels were less fluctuated (coefficient of varia- tion ≤ 25%) with sensitivity of 78% and specificity of 70% as shown in Fig. 1. The cut-off levels (sensitivity, specificity) of factors which showed significantly great area under ROC curve were as follows: maximum glu- cose level of 250 mg/dL (61%, 59%), mean glucose level of 150 mg/dL (65%, 58%), APACHE II on day 1 of 25 (65%, 71%) and day 2 of 25 (74%, 86%) and SOFA on day 1 of 13 (72%, 62%) and day 2 of 13 (70%, 77%).
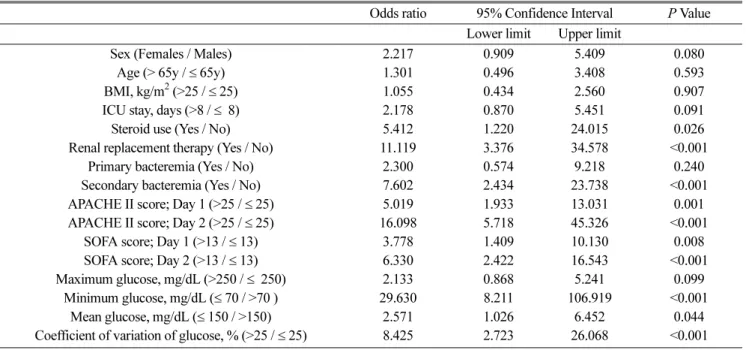
Based on the cut-off values, univariate analysis of factors affecting mortality was performed. As shown in Table 3, there was statistically significant difference in steroid use, renal replacement therapy, secondary bacte- remia and disease severity including APACHE and
Fig. 1. Receiver operating characteristic (ROC) curve. The value for area under curve greater than 0.5 indicate difference between the two groups. (a) maximum glucose level and mortality; (b) minimum glucose level and mortality; (c) coefficient of variation and mortality.
SOFA Score on both day 1 and 2. Among glucose indi- ces, minimum and mean glucose level and coefficient of variation of glucose levels were significantly associ- ated with increased risk of mortality; patients with min- imum glucose level at 70 or less showed 29.6 times higher mortality than those greater than 70. Coefficient of variation (%) also affected mortality significantly, which patients with coefficient of variation greater than 25 produced 8.4 fold higher mortality, compared to those of 25 or less.
Multivariate logistic regression was performed after correcting for age, gender and significant factors from univariate analysis. As shown in Table 4, steroid use,
SOFA Score on day 2, minimum glucose level and coefficient of variation were significantly associated with mortality. The odds ratios of mortality in patients who had minimum glucose level greater than 70 were 0.92 compared to those at 70 or less. In addition to minimum glucose level, coefficient of variation of glu- cose levels also showed significant factor of mortality However, the effects of maximum and mean glucose level on mortality were not found to be statistically sig- nificant from the multivariate analysis.
The Kaplan-Meier survival curves were plotted according to minimum glucose level and coefficient of variation of glucose levels. The difference of survival
Table 3. Univariate analysis of factors associated with mortalityOdds ratio 95% Confidence Interval P Value Lower limit Upper limit
Sex (Females / Males) 2.217 0.909 5.409 0.080
Age (> 65y / ≤ 65y) 1.301 0.496 3.408 0.593
BMI, kg/m2 (>25 / ≤ 25) 1.055 0.434 2.560 0.907
ICU stay, days (>8 / ≤ 8) 2.178 0.870 5.451 0.091
Steroid use (Yes / No) 5.412 1.220 24.015 0.026
Renal replacement therapy (Yes / No) 11.119 3.376 34.578 <0.001
Primary bacteremia (Yes / No) 2.300 0.574 9.218 0.240
Secondary bacteremia (Yes / No) 7.602 2.434 23.738 <0.001
APACHE II score; Day 1 (>25 / ≤ 25) 5.019 1.933 13.031 0.001
APACHE II score; Day 2 (>25 / ≤ 25) 16.098 5.718 45.326 <0.001
SOFA score; Day 1 (>13 / ≤ 13) 3.778 1.409 10.130 0.008
SOFA score; Day 2 (>13 / ≤ 13) 6.330 2.422 16.543 <0.001
Maximum glucose, mg/dL (>250 / ≤ 250) 2.133 0.868 5.241 0.099
Minimum glucose, mg/dL (≤ 70 / >70 ) 29.630 8.211 106.919 <0.001
Mean glucose, mg/dL (≤ 150 / >150) 2.571 1.026 6.452 0.044
Coefficient of variation of glucose, % (>25 / ≤ 25) 8.425 2.723 26.068 <0.001 BMI=Body Mass Index; ICU=Intensive Care Unit;
Primary bacteremia: bacteremia occurrence within 2 days after SICU admission Secondary bacteremia: bacteremia occurrence from 3 days after SICU admission APACHE=Acute Physiology and Chronic Health Evaluation;
SOFA=Sequential Organ Failure Assessment
Table 4. Multivariate analysis of factors associated with mortality
Odds ratio 95% Confidence Interval P Value Lower limit Upper limit
Steroid use (Yes / No) 15.771 1.582 157.221 0.019
SOFA Score (day1) (>13 / ≤ 13) 1.447 0.988 2.119 0.058
SOFA Score (day2) (>13 / ≤ 13) 1.688 1.148 2.482 0.008
Minimum glucose, mg/dL (≤ 70 / >70 ) 0.922 0.881 0.965 <0.001
Coefficient of variation of glucose, % (>25 / ≤ 25) 1.121 1.017 1.236 0.022 SOFA=Sequential Organ Failure Assessment
time between 2 groups according to minimum glucose level of 70 mg/dL and coefficient of variation of 25%
was statistically significant (P < 0.001 and P < 0.037, respectively) as depicted in Fig. 2.
DISCUSSION
In critically ill patients, hyperglycemia is often found due to peripheral insulin resistance. Critical illness facilitates high blood glucose level through an activa- tion of the hypothalamic-pituitary-adrenal axis, result- ing in the increase of hepatic glucose production and inhibition of glucose uptake to skeletal muscle. Many
studies have shown that high blood glucose level had strong association with morbidity and mortality in patients with critical illness such as SICU. Intensive insulin regimen, therefore, has been employed in this setting.
A randomized trial using SICU patients reported that maintaining blood concentration between 80 and 110 by intensive insulin therapy significantly reduced inhospi- tal mortality while a meta-analysis conducted in 2008 concluded that intensive insulin treatment failed to reduce mortality.
4,8)The conflicting results were partly attributed to the occurrence of hypoglycemia by inten- sive insulin therapy.
Several studies reported that the introduction of strict glycemic control in SICU has increased the risk of hypoglycemia.
9,10)Recent Nice-Sugar study reported that 6.8% of patients who received intensive insulin therapy experienced hypoglycemia compared to 0.5%
in the conventional treatment group.
10)Similar results were found from a study by Vriesendorp et al.; 5.1% in intensive insulin treatment and 0.8% in conventional therapy experienced hypoglycemic event.
9)Those stud- ies defined hypoglycemia as glucose level < 40 mg/dL.
In this study, among glucose indices, maximum, min- imum and mean glucose, and coefficient of variation were found to be significant factors affecting mortality.
The mortality rates were 9.1, 10.8, 14.3 and 31.8% in patients with maximum glucose level of < 220, 220 - 279, 280 - 339 and ≥ 340 (P = 0.017) while those were 87.5, 45.5, 11.4 and 1.9% in patients with minimum glucose level of < 40, 40-59, 60-79 and ≥ 80 (P <
0.001), respectively. Higher mortality rate was found in patients with high coefficient of variation; 40.7, 17.8 and 4.1 % of mortality rate was observed in patients with glucose coefficient of variation ≥ 35, 25-34 and <
25% (P < 0.001), respectively.
Based on the correlation between mortality and glu- cose indices, area under the ROC curves was calcu- lated. Among the calculated area, minimum glucose level showed the highest area followed by coefficient of variation of glucose. Cut-off values of minimum glu- cose level (70 mg/dL) and coefficient of variation of
Fig. 2. Kaplan-Meier curves. (a) minimum glucose level andsurvival; (b) coefficient of variation and survival.
glucose (25%) were obtained from the ROC curve. The univariate analysis of this study demonstrated signifi- cant increase in mortality in patients with minimum glucose level < 70 and coefficient of variation of glu- cose > 25%. In addition, mean glucose level was signif- icantly associated with mortality, which the level more than 150 mg/dL reduced mortality about 2.5 times com- pared to that 150 mg/dL or less. It was thought that the higher mortality rate in lower mean glucose level was mainly because low minimum glucose concentration was reflected to the mean value. From the result, it was speculated that mean glucose level by itself couldn’t be a good target of glucose control for survival but other factors such as minimum glucose level and coefficient of variation should be considered. Besides glucose indi- ces, steroid use, renal replacement therapy, secondary bacteremia and APACHE II and SOFA Score were sig- nificantly associated with mortality.
Multivariate analysis was performed after adjusting with significant factors found in univariate analysis.
The results revealed that steroid use, SOFA Score on day 2, minimum glucose level and coefficient of varia- tion of glucose were significant factors of mortality.
Kaplan-Meier survival curves showed higher mortality rate in the lower minimum glucose group and higher coefficient of variation group.
Recent study showed that hypoglycemia was not signifi- cantly associated with increased mortality when adjusting potential confounders.
11)Like other studies
9,10), in that study, hypoglycemia was defined as glucose level less than 40 mg/dL. Those studies, however, did not provide a rationale to determine the cut-off minimum glucose level. In this study, cut-off level of 70 mg/dL was obtained from ROC curve. Considering that mortality rate was still higher (45.5%) in patients with glucose level between 40 and 59, higher target minimum glu- cose level should be employed in clinical settings.
Up to now, main goal of glucose control in SICU has been to reduce the incidence of hyperglycemia. Based
on the results, it was concluded that in addition to reducing the incidence of hyperglycemia, glucose level should be controlled to minimize fluctuation while maintaining minimum glucose level of 70 mg/dL or higher. Further prospective study is required to confirm the results of present study because this study has limi- tations of the retrospective nature and single center investigation.
REFERENCES
1. Wolfe RR, Alson JR, Burke JF. Glucose netabolism in man: response to intravenous glucose infusion. Metabo- lism 1979; 28: 210-20.
2. Shangraw RE, Jahoor F, Miyoshi H et al., Differentiation between septic and postburn insulin resistance. Metabolism 1989; 38: 983-9.
3. Mizock BA. Alteration in carbohydrate metabolism during stress: a review of the literature. Am J Med 1995;
98: 75-84.
4. Van den Berghe G, Wouters P, Weekers F et al., Intensive insulin therapy in critically ill patients. N Engl J Med 2001;
345: 1359-67.
5. Van den Berghe G, Wilmer A, Hermans G et al., Intensive insulin therapy in medical intensive care patients. N Engl J Med 2006; 354: 449-61.
6. Leow MK, Wyckoff J. Under-recognised paradox of neuropathy from rapid glycaemic control. Postgrad Med J 2005; 81: 103-7.
7. Egi M, Bellomo R, Stachowski E et al., Variability of blood glucose concentration and short-term mortality in critically ill patients. Anesthesiology 2006; 105: 244-52.
8. Wiener RS, Wiener DC, Larson RJ. Benefits and risks of tight glucose control in critically ill adults: A meta- analysis. JAMA 2008; 300: 933-44.
9. Vriesendorp TM, van Santen S, DeVries HD et al., Predisposing factors for hypoglycemia in the intensive care unit. Crit Care Med 2006; 34: 96-101.
10. The Nice-Sugar Study Investigators. Intensive versus conventional glucose control in critically ill patients. N Engl J Med 2009; 360: 1283-97.
11. Arabi YM, Tamim HM, Rishu AH. Hypoglycemia with insulin therapy in critically ill patients: Predisposing factors and association with mortality. Crit Care Med 2009; 37: 2536-44.