Rock Slope Stability Investigations Conducted on the Road Cut in Samrangjin-Miryang Area
13
0
0
전체 글
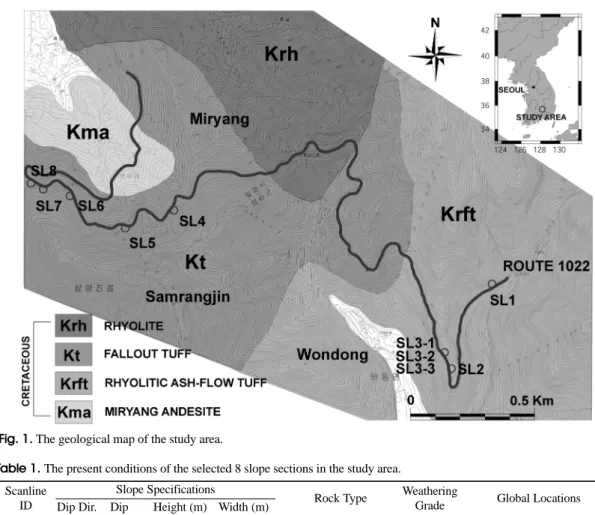
(2) 306. Jeong-Gi Um et al.. 1. Introduction This paper covers the studies performed to investigate the slope stability of the selected area of road cut slope. A road cut slope may encounter any of the following modes of instability depending on the rock type, discontinuity geometry network in the rock mass, mechanical properties of the discontinuities, external forces such as water forces, dynamic forces acting on the rock mass, weathered condition of the rock mass and the slope of the cut road: (a) plane failure, (b) wedge failure, (c) toppling failure, (d) simple, multiple block failure, (e) rotational failure and (f) complicated, multiple block failure. Since the in-situ stresses close to a free face are usually low, the stability of near-surface rock blocks can be investigated through a rigid block analysis. In order to perform a rigid block analysis, a kinematic feasibility analysis should be performed as the first step. Kinematics deals with the possible motion of bodies without reference to the forces which move them (Goodman, 1989). The possible failure under the modes (a) through (d) can be investigated only under kinematic considerations using kinematic analysis (Goodman, 1989; Um and Kulatilake, 2001) and block theory analysis (Goodman and Shi, 1985; Um and Kulatilake, 2001). Kinematic analysis also can be performed to calculate the maximum safe slope angles under only gravitational loading for possible single-plane sliding, wedge sliding and toppling failures. If kinematically unstable blocks are found, the mechanical stability of such single blocks can be investigated through limit equilibrium rock slope stability analysis (Goodman, 1989; Hoek and Bray, 1988; Warburton, 1981; Goodman and Shi, 1985; Kulatilake and Fuenkajorn, 1987; Giani, 1992). The investigated road cut sections are located in Samryangjin-Miryang rural route near the Mt. Chuntae about 35Km northeast of Busan, Korea. The rural route in part has recently undergone improvements, including widening, to provide visitors with a safer drive pass through the mountain. The road cut face is 6-17 m high and makes a 90o turns as it cross the mountain pass. A route map of the road cut as well as geological map is provided Fig. 1. The road cut has been made through Cretaceous volcanic rocks of rhyolitic ash-flow tuff,. fallout tuff, rhyolite and andesite. The road cut section in this area is of particular concern because of the existence of a high number of discontinuities in the area, as well as the extremely steep cut slope angle. The angle for the majority of the rock face is approximately 70-90o. On visual observation alone, it is apparent that the slope is somewhat unstable. There are a number of prominent discontinuity sets in the area, which create visible blocks. Debris from minor to large block failures finds its way onto the shoulder of the road, and sometimes onto the roadway itself. The purposes of this study are to ascertain if the cut slope in the vicinity of the Mt. Chuntae is dangerously unstable, and if it needs to be decreased to prevent dangerous failure. The Samryangjin-Miryang rural route is a highly traveled road, and a substantial failure could have drastic ramifications. To examine the stability and to assess the hazard of the slope failure, a total of 8 unstable road cut sections were selected by visual inspections. As the first step, discontinuity geometry data were collected on 8 sections using recently developed geodetic survey tools as well as conventional scanline surveys. The second step of the study was discontinuity geometry analyses. As the third step, Kinematic and block theory analyses were applied to examine the stability of the road cut. The final step of this study was the compiling of the results from the methods implemented.. 2. Discontinuity Mapping and Geometry Analysis The joint mapping took place at the site and consisted of the collection of joint geometry data, as well as the collection of mechanical properties such as joint roughness and Schmidt hammer rebound values. Horizontal scanlines were utilized in collecting joint orientation data for the unstable area. All of the data collected in the field was recorded on scanline survey logging forms. For the horizontal scanlines, a section of the face was measured off with a metric measuring tape laid on the ground. The height of the cut slope face was estimated with the help of a total station. The boundaries of the scanline were set as the top of the rock face, which was recorded as the cut-off length on the logging form. The horizontal bound-.
(3) Rock slope stability investigations conducted on the road cut in Samrangjin-Miryang area. 307. Fig. 1. The geological map of the study area. Table 1. The present conditions of the selected 8 slope sections in the study area. Scanline ID Dip Dir. SL1 144 SL2 089 SL3-1 242 SL3-2 242 SL3-3 229 SL4 344 SL5 312 SL6 074 SL7 020 SL8 009. Slope Specifications Dip Height (m) Width (m) 65 8.8 143 68 12.4 68 70 9.3 20 70 9.3 24 74 9.3 28 68 7.5 95 70 12.7 76 68 10.2 111 64 9.0 37 65 12.3 38. Rock Type rhyolitic ash-flow tuff rhyolitic ash-flow tuff rhyolitic ash-flow tuff rhyolitic ash-flow tuff rhyolitic ash-flow tuff fallout tuff fallout tuff fallout tuff fallout tuff fallout tuff. ary of the scanline was set according to the length of the straight face. To avoid having curved scanlines, the curve of the cut slope face was approximated with straight sections. The starting reference point is at the southwest end of the road cut slope (Fig. 1). SL1 starts at this reference point. The surveyed region extends across the Mt. Chuntae, in a northerly to westerly direction. After the scanline area was set, the collection of joint geometry data could be commenced. The dip. Weathering Grade MW MW SW SW SW SW MW MW MW SW. Global Locations o. N 35 23' 50.3" E 128 53' 38.6" N 35o 23' 37.1" E 128 53' 29.1" N 35o 23' 39.2" E 128 53' 28.9" N 35o 24' 00.6" E 128 52' 46.6" N 35o 23' 57.0" E 128 52' 39.0" N 35o 23' 57.9" E 128 52' 31.0" N 35o 24' 02.0" E 128 52' 25.4" N 35 o24' 02.3" E 128 52' 24.1". direction and dip of the slope face, the global location, elevation, trend and plunge of the scanline, the rock type and the exposure condition of the rock mass (unweathered, weathered or altered) were recorded. Table 1 summarizes the slope specifications and geological properties of the selected 8 slope sections in the study area. For individual joints that intersect the scanline, the intersection distance, dip direction, dip, apparent dip, semi-trace lengths on each side of the scanline, termination type for each.
(4) 308. Jeong-Gi Um et al.. Fig. 2. Joint orientation sets in the study area.. joint trace and condition of aperture were recorded. 0.5 m was used as the cut-off length for the traces. The joint orientation data were analyzed according to the clustering algorithm of Shanley and Mahtab (1976) and Mahtab and Yegulalp (1984) to find the dense points and the resulting joint sets. Joint sets between two and three was found to be suitable according to the results obtained from the applied method. The quality of the separation between the joint sets was considered to make a decision on the optimum number of joints sets. The final results obtained for joint set delineation are shown in Fig. 2. Most of the joint sets show high variability and this high variability is partly reflected by the low number of data available for orientation analyses. Number of orientation data belonging to each joint set and the mean directions obtained for the joint sets are shown in Table 2.. Kolmogorov-Smirnov goodness-of-fit test was used on joint spacing and semi-trace length data to find the suitable probability distributions as well as the best probability distribution to represent the statistical distribution of spacing and trace size for each joint cluster, and the results are given in Table 3. The distributions of gamma, exponential and log normal were found to be suitable to represent the spacing and semi-trace length of any of the joint clusters.. 3. Kinematic Analysis 3.1. Introduction Kinematic analyses are very useful to investigate possible failure of rock masses which contain joints. Failure involving movement of rock blocks on joints combine one or more of the three basic.
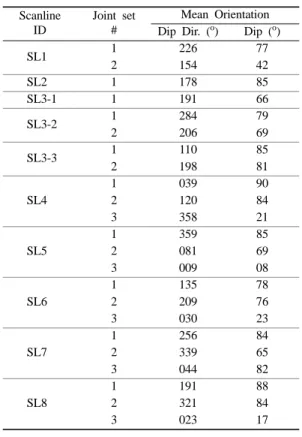
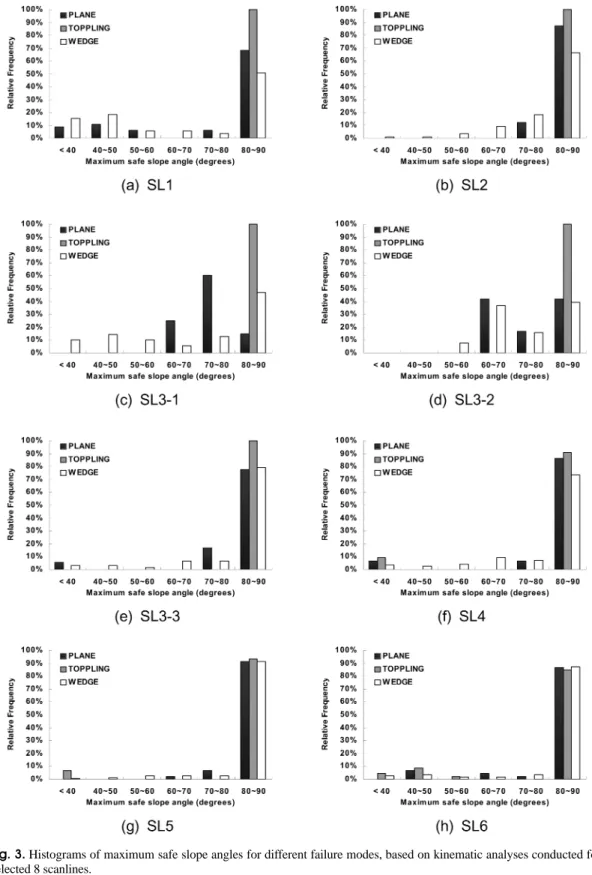
(5) Rock slope stability investigations conducted on the road cut in Samrangjin-Miryang area Table 2. Orientations of the joints sets in the scanline sections. Scanline ID SL1 SL2 SL3-1 SL3-2 SL3-3. SL4. SL5. SL6. SL7. SL8. Joint set # 1 2 1 1 1 2 1 2 1 2 3 1 2 3 1 2 3 1 2 3 1 2 3. Mean Orientation Dip (o) Dip Dir. (o) 226 77 154 42 178 85 191 66 284 79 206 69 110 85 198 81 039 90 120 84 358 21 359 85 081 69 009 08 135 78 209 76 030 23 256 84 339 65 044 82 191 88 321 84 023 17. modes-plane sliding, wedge sliding and toppling. For the selected 8 road cut sections, kinematic analyses were performed to estimate maximum safe slope angles with respect to the aforementioned three basic failure modes. The basic concepts related to estimation of maximum safe slope angles for the three basic modes of failure are discussed by Goodman (1989). A computer code KINEM (Um et al., 1996) that calculates maximum safe slope angles(MSSA) under kinematic considerations for single plane failure, wedge failure and toppling failure modes was used in this study. As the worst case scenario, it may be possible to have some rock joints with weak filling material in the considered rock masses. Therefore, to be on the conservative side a friction angle of 25o was used for the kinematic analyses conducted in this investigation. 3.2. Performed analyses and results The results obtained for the selected 8 scanline sections(disregarding the actual locations of joints). 309. are shown through histograms in Fig. 3. Most of the maximum safe slope angles for plane sliding were found to be greater than 65o. For most of the wedges, maximum safe cut slope angles greater than 45o were obtained. Toppling failures usually occur in layered rock such as slate, schist, and sedimentary rocks. Chances to form thin layers in a volcanic rock masses are extremely low other than in rock masses with sheet joints. The volcanic rock mass that exist in the study area does not contain sheet joints. Therefore, it is not really necessary to consider toppling mode for the study area. Anyway, to be on the conservative side, in this study, kinematic analysis was conducted for toppling. Results for individual joints are shown in Fig. 3. Most of the maximum safe slope angles for the toppling case were found to be greater than 80o discontinuities except in SL7 and SL8. Table 4 shows the results of obtained maximum safe slope angle corresponding to the plane sliding and wedge sliding modes for the selected 8 scanline sections. The results show that 25.53% of the joints can give rise to plane failure under gravitational loading for slope angles of 70 degrees in SL1. For SL3-1, SL3-2 and SL3-3, it changes to 25.00%, 41.67% and 5.56%, respectively. If the slope angle is brought down to 50 degrees, 25.53%, 25.00%, 41.67% and 5.56% can be brought down to 19.51%, 0.00%, 0.00% and 5.56%, respectively. Also, the results show that about 10.87% of the joints can give rise to single plane sliding under gravitational loading for slope angles of 70 degrees in SL6. If the slope angle is brought down to 50 degrees, the 10.87% can be brought down to 6.25%. The corresponding percentages associated with plane sliding in SL7 are 15.91% and 4.55%, respectively. The results given in Table 4 also show that about 45.61% of the joints have contributed to wedge sliding under gravitational loading for slope angles greater than 70 degrees in SL1. This 45.61% can be brought down to 33.92% by reducing the slope angle to 50 degrees. The results show that about 40.00% and 44.74% of the major joints have contributed as main joints in forming wedges in wedge sliding under gravitational loading for slope angles of 70 degrees in SL3-1 and SL3-2, respectively. These 40.00% and 44.74% can be brought down to about 24.29% and 0.00%, respectively, by reducing the slope angle to 50 degrees..
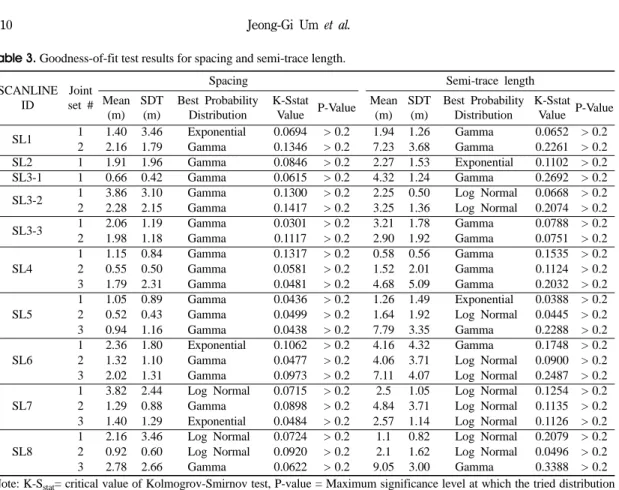
(6) 310. Jeong-Gi Um et al.. Table 3. Goodness-of-fit test results for spacing and semi-trace length. Spacing Semi-trace length SCANLINE Joint Mean SDT Best Probability K-Sstat Mean SDT Best Probability K-Sstat ID set # P-Value P-Value (m) (m) Distribution Value (m) (m) Distribution Value 1 1.40 3.46 Exponential 0.0694 > 0.2 1.94 1.26 Gamma 0.0652 > 0.2 SL1 2 2.16 1.79 Gamma 0.1346 > 0.2 7.23 3.68 Gamma 0.2261 > 0.2 SL2 1 1.91 1.96 Gamma 0.0846 > 0.2 2.27 1.53 Exponential 0.1102 > 0.2 SL3-1 1 0.66 0.42 Gamma 0.0615 > 0.2 4.32 1.24 Gamma 0.2692 > 0.2 1 3.86 3.10 Gamma 0.1300 > 0.2 2.25 0.50 Log Normal 0.0668 > 0.2 SL3-2 2 2.28 2.15 Gamma 0.1417 > 0.2 3.25 1.36 Log Normal 0.2074 > 0.2 1 2.06 1.19 Gamma 0.0301 > 0.2 3.21 1.78 Gamma 0.0788 > 0.2 SL3-3 2 1.98 1.18 Gamma 0.1117 > 0.2 2.90 1.92 Gamma 0.0751 > 0.2 1 1.15 0.84 Gamma 0.1317 > 0.2 0.58 0.56 Gamma 0.1535 > 0.2 SL4 2 0.55 0.50 Gamma 0.0581 > 0.2 1.52 2.01 Gamma 0.1124 > 0.2 3 1.79 2.31 Gamma 0.0481 > 0.2 4.68 5.09 Gamma 0.2032 > 0.2 1 1.05 0.89 Gamma 0.0436 > 0.2 1.26 1.49 Exponential 0.0388 > 0.2 SL5 2 0.52 0.43 Gamma 0.0499 > 0.2 1.64 1.92 Log Normal 0.0445 > 0.2 3 0.94 1.16 Gamma 0.0438 > 0.2 7.79 3.35 Gamma 0.2288 > 0.2 1 2.36 1.80 Exponential 0.1062 > 0.2 4.16 4.32 Gamma 0.1748 > 0.2 SL6 2 1.32 1.10 Gamma 0.0477 > 0.2 4.06 3.71 Log Normal 0.0900 > 0.2 3 2.02 1.31 Gamma 0.0973 > 0.2 7.11 4.07 Log Normal 0.2487 > 0.2 1 3.82 2.44 Log Normal 0.0715 > 0.2 2.5 1.05 Log Normal 0.1254 > 0.2 SL7 2 1.29 0.88 Gamma 0.0898 > 0.2 4.84 3.71 Log Normal 0.1135 > 0.2 3 1.40 1.29 Exponential 0.0484 > 0.2 2.57 1.14 Log Normal 0.1126 > 0.2 1 2.16 3.46 Log Normal 0.0724 > 0.2 1.1 0.82 Log Normal 0.2079 > 0.2 SL8 2 0.92 0.60 Log Normal 0.0920 > 0.2 2.1 1.62 Log Normal 0.0496 > 0.2 3 2.78 2.66 Gamma 0.0622 > 0.2 9.05 3.00 Gamma 0.3388 > 0.2 Note: K-Sstat= critical value of Kolmogrov-Smirnov test, P-value = Maximum significance level at which the tried distribution is suitable to represent the statistical distribution of joint geometry data (a minimum P-value of 0.05 is required to accept the tried probability distribution to represent the spacing or size distributions of the joint set). 4. Block Theory Analysis 4.1. Introduction Fig. 4 shows five types of blocks in a surface excavation formed by joints. Although the actual blocks are in three dimensions, to simplify the illustration a two-dimensional fig. is used. An infinite block (type V), as shown in Fig. 4(a) is not dangerous as long as it is incapable of internal cracking. Fig. 4 (b) is an example of type IV nonremovable tapered blocks. It is finite, but it cannot come out to free space because of its tapered shape. Finite and removable blocks can be separated into three categories, namely type III, type II, and type I. As shown in Fig. 4(c), a type III block is stable without friction under its gravity alone. A type II block as shown in Fig. 4(d) can remain stable as long as the sliding force on the block is less than its frictional resistance. Under only gravitational loading, the type II blocks are stable. However, they can come out into the free surface of excavation if there are external. forces like water forces, inertia forces etc. that make the total sliding force to be greater than the frictional resistance. Therefore, type II blocks are also called potential key blocks. Finally, a key block, that is denoted by type I and shown in Fig. 4(e), can slide into free space under gravitational loading without any external force unless a proper support system is provided. Therefore, the identification of key blocks and potential key blocks is one of the most important parts in a rock slope stability analysis. Procedures are given in the literature to separate these different block types along with the assumptions used in block theory (Goodman and Shi, 1985). Um and Kulatilake(2001) have developed computer programs to perform block theory analysis and to calculate maximum safe slope angles corresponding to types I and II blocks. 4.2. Performed analyses and results Block theory analysis was performed separately for each of the five scanline sections (SL4, SL5,.
(7) Rock slope stability investigations conducted on the road cut in Samrangjin-Miryang area. 311. Fig. 3. Histograms of maximum safe slope angles for different failure modes, based on kinematic analyses conducted for selected 8 scanlines..
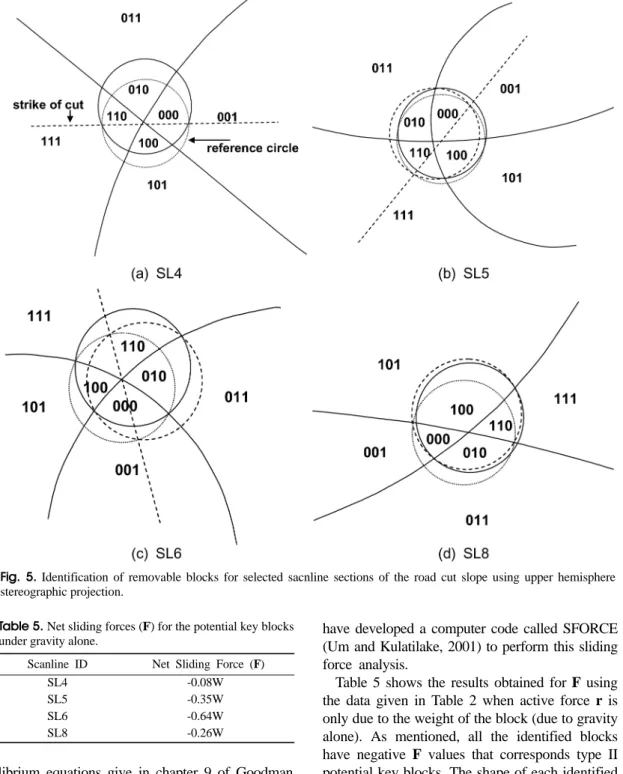
(8) Jeong-Gi Um et al.. 312. Fig. 3. Continued. Table 4. Percentages of joints contributed to possible plane, wedge and toppling instabilities in the selected 8 scanlines for different slope angles according to kinematic analysis. SCANLINE Cut Slope Angle Plane Sliding Toppling Wedge Sliding SCANLINE Cut Slope Angle Plane Sliding Toppling Wedge Sliding. SL1 70o 50o 19.15% 25.53% 0.00% 0.00% 33.92% 45.61% SL4 70o 50o 6.82% 6.82% 9.09% 9.09% 6.02% 19.28%. SL2 50o 70o 0.00% 0.00% 0.00% 0.00% 2.33% 15.12% SL5 50o 70o 0.00% 2.17% 6.52% 6.52% 1.72% 6.32%. Fig. 4. Blocks in a surface cut. (a) infinite, (b) tapered, (c) stable, (d) potential key block, (e) key block.. SL6, SL7, SL8) of joints mentioned in the previous Section. Within each scanline sections, mean orientation of three joint sets in Table 2 was considered to form possible blocks according to block theory. Note that at least three joint sets are needed to form a block, and SL1, SL2 and SL3 that have two joint sets are excluded form the block theory analysis. Different cut slope directions were used to simulate the changing strike direction of the. SL3-1 50o 70o 0.00% 25.00% 0.00% 0.00% 24.29% 40.00% SL6 50o 70o 6.52% 10.87% 13.04% 15.22% 5.75% 9.20%. SL3-2 50o 70o 0.00% 41.67% 0.00% 0.00% 0.00% 44.74% SL7 50o 70o 4.55% 15.91% 20.45% 22.73% 5.45% 15.15%. SL3-3 50o 70o 5.56% 5.56% 0.00% 0.00% 6.45% 14.52% SL8 50o 70o 2.33% 6.98% 13.95% 13.95% 6.21% 13.04%. road cut slope in the investigated area. Joint friction angle of 25 was used for the block theory analysis. From five analyzed scanline sections, potential key blocks (type II blocks) were identified in SL4, SL5, SL6 and SL8. There is no removable block in SL7. Fig. 5 shows the identification of removable blocks for four scanline sections in the study area using the upper hemisphere stereographic projection. The number 0 corresponds to the half space above joint plane and the number 1 corresponds to the half space below joint plane. In the upper hemisphere projection, the region above a joint plane is the area within the great circle of joint plane, and the region below the plane is the area outside of its great circle as shown in Fig. 5. A mode analysis (Goodman and Shi 1985, Chap. 9) was performed to find blocks corresponding to all the movement directions. Type III blocks lack a movement mode. On the other hand, a movement mode can be found for each of the type I & II blocks. This concept allows separation of type III blocks from types I and II blocks. Equi-.
(9) Rock slope stability investigations conducted on the road cut in Samrangjin-Miryang area. 313. Fig. 5. Identification of removable blocks for selected sacnline sections of the road cut slope using upper hemisphere stereographic projection. Table 5. Net sliding forces (F) for the potential key blocks under gravity alone. Scanline ID SL4 SL5 SL6 SL8. Net Sliding Force (F) -0.08W -0.35W -0.64W -0.26W. librium equations give in chapter 9 of Goodman and Shi (1985) can be used to compute sliding forces, F, under the resultant active force, r, for the lifting, single plane sliding and double plane sliding. A positive F corresponds to a type I block. Type II block produces a negative F. The authors. have developed a computer code called SFORCE (Um and Kulatilake, 2001) to perform this sliding force analysis. Table 5 shows the results obtained for F using the data given in Table 2 when active force r is only due to the weight of the block (due to gravity alone). As mentioned, all the identified blocks have negative F values that corresponds type II potential key blocks. The shape of each identified potential key blocks as well as photographs taken at the investigated scanline sections are shown in Fig. 6. According to the procedure used in the kinematic analysis, the lines of intersections having a plunge angle less than the friction angle of.
(10) 314. Jeong-Gi Um et al.. Fig. 6. The shape of identified potential key blocks in the scanline sections..
(11) Rock slope stability investigations conducted on the road cut in Samrangjin-Miryang area. the joints produce maximum safe slope angles of 90o. Therefore, for type II blocks it is not possible to make a comparison between the results obtained through kinematic and block theory analyses. The primary advantage of block theory over traditional kinematic analysis is that it gives the ability to identify the key blocks that require immediate attention. It separates the most important and dangerous blocks from the less critical ones. However, without the ability to look into toppling failure, kinematic analysis should be performed in conjunction with block theory (Um and Kulatilake, 2001).. 5. Limit equilibrium analysis of potential key blocks The purpose of this section is to show the effect of water force on factor of safety of key block stability. This is illustrated by performing limit equilibrium slope stability analyses on removable blocks belonging to type II block category that exist in the investigated scanline sections in the study area. Two shear strength criteria are tried in this investigation. The first is the linear Mohr-Coulomb criterion that expressed as τ = c + σntanφj. (1). where c is cohesion, σn is normal stress, φj is the joint friction angle. The second criterion is Barton's non-linear empirical equation (Barton, 1973) that expressed as σJ τ = σbtan⎛φb + JRClog 10 -----⎞ ⎝ σn⎠. (2). 315. shear strength criteria. Field observations carried out in the study area inferred that it may be possible to have some rock joints with weak fillings in the investigated area. Therefore, to be on the conservative side a friction angle of 25o was used for the stability analysis conducted in this investigation. The cohesion of the joint plane was considered to be zero. The same type II block was then considered with water pressure. It was assumed that the joint is filled up with water. Also it was assumed that the intact rock is impermeable and hence all of the water around the rock block is transmitted along the joint planes. A similar analysis was then performed using Barton's non-linear empirical equation (Eq. (2)). From the field observations the average JRC was found to be 4. The joint wall strength were estimated by Schmidt hammer rebound test and 100 MPa of σJ was used in this analysis. The obtained results are shown in Fig. 7. It is clear how a stable slope under dry condition can fail after a heavy rainfall. The fig. also shows how a stable slope under Barton's shear strength criterion can fail as the worst case scenario of using Mohr-Coulomb criterion. This information basically provides the concept related to designing road cut slope. The factor of safety for potential key blocks identified in SL6 and SL8 were calculated for the block with changing water pressure. In theses calculation, Mohr-Coulomb criterion was used to be on the conservative side. The results are shown in Fig. 8. This fig. also shows how a stable slope can become an unstable slope as the water pressure acting on joints increases.. where σJ is the joint wall compressive strength and φb is the basic friction angle. Note that when wall is unweathered, σJ is equal to σC (JCS). The factor of safety (SF) against sliding is given by R SF = ---D. (3). where R is the resisting force acting on single or double slide plane and D is the driving force along the sliding direction. Limit equilibrium analysis was first performed for the potential key block identified in SL4 section with dry situation. To calculate R, the linear Mohr-Coulomb criterion (Eq. (1)) is applied as. Fig. 7. Effect of water force on factor of safety of the potential key block identified in SL4..
(12) 316. Jeong-Gi Um et al.. Fig. 8. Effect of water force on factor of safety of the potential key block identified in SL6 and SL8.. 6. conclusions For road cut sections in the study area, the percentages of joints that can give rise to plane, wedge and toppling failure under gravitational loading for different slope angles are given in the paper. These results indicate that toppling failures would be low in the investigated region. Under only gravitational loading, type II blocks that can be formed in rock masses are stable under both single plane and wedge sliding modes. When the gravitational load is combined with the external loading such as water forces or dynamic forces, some type II blocks can give rise to failure under single or wedge sliding. The number of failures due to type II blocks increases as the magnitude of the external loading at the site increases. The obtained results indicate that the chance of sliding taking place through a type II block under a combined gravitational and external loading is quite high in the investigated area. Slope instability taking place due to type II blocks can be reduced by reducing the magnitude of the external loading at the site. Therefore, slope dewatering plane against rainy season should be done to keep the water levels down to the bear minimum in the slopes in the investigated region. The maximum safe slope angles presented here are not intended to suggest that present slope angles require lowering. The lowering of the present slope angle to accommodate these maximum safe slope angles is highly unfeasible. The amount of over burden needed to be removed to drastically lower the slope angle is unrealistic. These lower slope angles. correspond to blocks or areas that may need external support. This supports our observations during field data collection, which was conducted right after Typhoon season. Higher than normal precipitation was recorded in the study area. This resulted in numerous minor to substantial rock slope failures that occurred on the study area. The results obtained through limit equilibrium slope stability analyses conducted on the blocks belonging to type II block category that exist in the investigated area show how a stable slope can become an unstable slope as the water pressure acting on joints increases and how a stable slope under Barton's shear strength criterion can fail as the worst case scenario of using Mohr-Coulomb criterion.. Acknowledgement This research was funded by Ministry of Science & Technology, Grant Number M1032401000103B3101-00110. Special thanks go to reviewers for their timely comments and invaluable suggestions.. References Barton, N. (1973) Review of a new shear strength criterion for rock joints. Engineering Geology, v. 7, p. 287-332 Giani, G.P. (1992) Rock slope stability analysis. Balkema, Rotterdam. Goodman, R.E. (1989) Introduction to rock mechanics-2nd ed. John Wiley & Sons, Inc., New York. Goodman, R.E. and Shi, G.-H. (1985) Block theory and its application to rock engineering. Prentice-Hall, Inc., New Jersey. Hoek, E. and Bray, J. (1988) Rock Slope Engineering, 3rd Ed., Institute of Mining and Metallurgy, London. Kulatilake, P.H.S.W. and Fuenkajorn, K. (1987) Factor of safety of tetrahedral wedges: a probabilistic study. International Journal of Surface Mining, v. 1, p. 147-154. Mahtab, M.A. and Yegulalp, T.M. (1984) A similarity test for grouping orientation data in rock mechanics. Proceedings of the 25th U.S. Symposium on Rock Mechanics, p. 495-502. Shanley, R.J. and Mahtab, M.A. (1976) Delineation and analysis of clusters in orientation data. Mathematical Geology, v. 8, p. 9-23. Um, J. and Kulatilake, P.H.S.W. (2001) Kinematic and block theory analyses for shiplock slopes of Three Gorges Dam site in China. Geotechnical and Geological Engineering, v. 19, p. 21-42. Um, J., Kulatilake, P.H.S.W., Chen, J. and Teng, T. (1996) Maximum safe slope angles for shiplock slopes of three gorges dam site in chine based on kinematic analysis.
(13) Rock slope stability investigations conducted on the road cut in Samrangjin-Miryang area performed on major discontinuities. Proceedings of 13th Annual Meeting of ASSMR, Knoxville, Tennessee, p. 267-281. Warburton, P.M. (1981) Vector Stability Analysis of an Arbitrary Rock Block with Any Number of Free Faces.. 317. International Journal of Rock Mechanics and Mining Sciences, v. 18, p. 425-428. 2005년 3월 16일 원고접수, 2005년 5월 20일 게재승인..
(14)
수치
+5


관련 문서
The science of Geophysics is the application of physics to investigations of the Earth, Moon and Planets3. × In
1.6 Dynamic model interms of error wrt road 1 7 lane keeping model.. 1.7 lane keeping model 1.8
3-38 Data processing area for estimating the crack length .... 3-39 Relationship between the crack length and the sum
(b) Island formation starts due to an influx of the cooler part of the plasma outside the inversion radius through the magnetic reconnection as soon as the
• Min KB, Jing L, Numerical determination of the equivalent elastic compliance tensor for fractured rock masses using the distinct element method, International Journal
This study was conducted to analyze the effects of obesity on the core stability and metabolic syndrome risk factors of middle - aged women.. The effect
Numerical Approach in Rock Engineering Data limited problems. Recited from Starfield
※ Key words : the Corporation Act of 2005 in Japan, the Special Act on Innovation for Invigorating Industry, surcharge, large corporations, deregulation,
